2018 Hammersmith and Fulham London Borough Council election

Last updated

2018 Hammersmith and Fulham Borough Council election [1]
  2014 3 May 2018 2022  

All 46 seats to Hammersmith and Fulham Council
24 seats needed for a majority
Turnout39.0% (Increase2.svg2.4%)
 First partySecond party
  No image wide.svg No image wide.svg
Party Labour Conservative
Last election26 seats, 42.2%20 seats, 37.9%
Seats won3511
Seat changeIncrease2.svg9Decrease2.svg9
Popular vote27,40118,279
Percentage52.0%34.7%
SwingIncrease2.svg9.8%Decrease2.svg3.2%

Hammersmith and Fulham London UK local election 2018 map.svg
Map of the results of the 2018 Hammersmith and Fulham council election. Conservatives in blue and Labour in red.

Council control before election


Labour

Council control after election


Labour

A map showing the wards of Hammersmith and Fulham since 2002 Hammersmith and Fulham London UK labelled ward map 2002.svg
A map showing the wards of Hammersmith and Fulham since 2002

The 2018 Hammersmith and Fulham Council election took place on 3 May 2018 to elect members of Hammersmith and Fulham Council in London. [2] [3]

Contents

Overall results

Hammersmith and Fulham London Borough Council
Structure
Seats46 councillors
Hammersmith and Fulham Council 2018.svg
Political groups
Majority Party (35)
  •   Labour (35)

Opposition (11)

Hammersmith and Fulham Council election result 2018 [3] [4]
PartySeatsGainsLossesNet gain/lossSeats %Votes %Votes+/−
  Labour 3590+976.154.377,407+8.1
  Conservative 1109-923.933.848,192-7.4
  Liberal Democrats 000011.215,937+3.5
  Green 00000.5660-2.0
  UKIP 00000.1183-1.4
  Independent 00000.189+0.1

Labour consolidated control of the council by gaining 9 seats (in addition to the 11 they gained in 2014), winning 35 in all. The Conservatives lost 9 seats, winning 11 in all. This was the lowest number of Conservative councillors since 1986.

There were no wards with split party representation – for only the fourth time in the fifteen elections since the council was created in 1968. The previous occasions when this occurred was 1990, 1978 and the 1971 Labour landslide.

Another sign of the increased homogeneity was the number of wards where the winning party got less than 50% of the vote – just three wards this time. Ravenscourt Park with 46%, Town with 48% and Sands End with a fraction under 50%. This compares with the 2014 election when there were 6 wards including Sands End with 38%. In the 2010 election there were 10 wards including Addison with 39%. And in the 2006 election there were also 10 wards including Askew with 39%.

26 Councillors successfully retained their seats – 20 Labour and 6 Conservative. 5 sitting Councillors were defeated – all Conservative, including the previous opposition leader. [5]

The ward with the highest percentage vote for one party was Wormholt and White City which saw a 76.5% vote share for the Labour Party. This is the highest percentage any party has achieved at the five elections since these wards were established in 2002. Vote share percentages by ward for previous elections are not currently available.

The largest percentage change was in the Shepherds Bush Green ward, where the Labour Party increased its vote share by 20.9 percentage points – as the Green Party did not stand a candidate this time round. The largest percentage decrease was in the Fulham Reach ward where the Conservative vote dropped by 14.6 percentage points.

The candidate with the largest individual tally was Lisa Homan with 2,577 votes in the Askew ward. This veteran councillor has been elected on all but one occasion since 1994 – losing out in 2002 by 44 votes.

One of the successful Conservative candidates in Palace Riverside had been deselected from the same ward in 2006, and had run as an independent candidate – coming within 146 votes of winning at that election. [6]

The Liberal Democrats fielded a full slate of 46 candidates – in 2014 they put forward 39 candidates for election.

UKIP fielded 3 candidates – in 2014 they had 7 candidates.

The Green Party fielded 2 candidates – in 2014 they had 7 candidates.

There was 1 Independent candidate – the same number as in 2014, although a different individual. The 2018 independent had previously run in the same ward in the 2006 local election and in the Hammersmith constituency at the 2017 general election.

TUSC did not stand any candidates in the 2018 local elections – they had two candidates in Hammersmith and Fulham in 2014.

National Health Action Party did not field candidates in the 2018 local elections – they had a single candidate in Hammersmith and Fulham in 2014.

Ward results

(*) represents a candidate seeking re-election in the same ward.

(~) represents a candidate seeking re-election in a different ward.

Addison

Addison (3)
PartyCandidateVotes%±%
Labour Sue Fennimore* 1,902 54.5 +7.5
Labour Adam Connell* 1,849 52.9 +5.1
Labour Rachel Leighton 1,762 50.5 +9.1
Conservative Clare Ambrosino1,15333.0-11.4
Conservative James Colquhoun1,11431.9-9.8
Conservative Al Lewis98328.2-13.5
Green Liz Goad3309.5N/A
Liberal Democrats Laura Goeman3229.2-4.7
Liberal Democrats Luke Blackett3139.0N/A
Liberal Democrats Andrew Leitch2517.2N/A
UKIP Maggie Casey621.8N/A
UKIP Elizabeth Jones501.4N/A
Majority60917.5
Turnout 41.66%-1.3%
Labour hold Swing
Labour hold Swing
Labour gain from Conservative Swing

Askew

Askew (3)
PartyCandidateVotes%±%
Labour Lisa Homan* 2,577 68.9 +15.1
Labour Rory Vaughan* 2,515 67.3 +16.0
Labour Rowan Ree 2,466 66.0 +5.8
Conservative Dominic Masters69018.5-5.8
Conservative Paul Thomas65817.6-3.6
Conservative Arunasalam Yogeswaran57915.5-5.0
Liberal Democrats Catherine Remy50413.5+6.3
Liberal Democrats Florian Chevoppe-Verdier46812.5+2.8
Liberal Democrats Janet Burden46312.4+5.8
Majority177647.5
Turnout 37.06%+0.1%
Labour hold Swing
Labour hold Swing
Labour hold Swing

Avonmore and Brook Green

Avonmore and Brook Green (3)
PartyCandidateVotes%±%
Labour Rebecca Harvey 1,807 52.0 +8.4
Labour David Morton 1,794 51.7 +12.5
Labour Fiona Smith 1,696 48.8 +12.4
Conservative Caroline Ffiske*1,32938.3-4.1
Conservative Joe Carlebach*1,29937.4-7.1
Conservative Will Marshall1,17033.7-7.2
Liberal Democrats Billy Dann34810.0+0.5
Liberal Democrats Cecile Fossy3389.7+0.3
Liberal Democrats Julie Perrin3379.7+1.0
Majority36710.5
Turnout 42.48%+5.6%
Labour gain from Conservative Swing
Labour hold Swing
Labour gain from Conservative Swing

College Park and Old Oak

College Park and Old Oak (2)
PartyCandidateVotes%±%
Labour Wesley Harcourt* 1,459 73.6 +14.6
Labour Alexandra Sanderson 1,360 68.6 +5.0
Conservative Marie Higton37218.9-1.9
Conservative Paul Keegan35718.0+1.0
Liberal Democrats Niamh McCarthy1196.0-1.4
Liberal Democrats Steve Baxter1175.9N/A
Majority98849.7
Turnout 33.02%+1.3%
Labour hold Swing
Labour hold Swing

Fulham Broadway

Fulham Broadway (3)
PartyCandidateVotes%±%
Labour Ben Coleman* 1,720 56.2 +5.9
Labour Alan de'Ath* 1,611 52.6 +3.8
Labour Sharon Holder* 1,590 51.9 +2.6
Conservative Adam Carew1,09435.7-4.4
Conservative Aliya Afzal Khan1,04534.1-5.3
Conservative Matt Fincham1,02833.6-5.1
Liberal Democrats Natasha Farrant2678.7+1.7
Liberal Democrats Penelope Stradling2608.5+1.6
Liberal Democrats Michael Cook2588.4+2.4
Majority49616.2
Turnout 37.69%-1.7%
Labour hold Swing
Labour hold Swing
Labour hold Swing

Fulham Reach

Fulham Reach (3)
PartyCandidateVotes%±%
Labour Christabel Cooper 2,034 60.0 +13.8
Labour Iain Cassidy* 1,976 58.3 +11.8
Labour Guy Vincent* 1,903 56.2 +13.0
Conservative Gabriel Gavin95828.3-14.3
Conservative Rory Boden95628.2-13.1
Conservative Dorinne Tin Ming Kaw89226.3-14.5
Green Jimi Davies3309.7N/A
Liberal Democrats Jenny Beardmore3209.4+1.9
Liberal Democrats Rutger Wip2276.7+1.5
Liberal Democrats George Cotcher-Riley2116.2+1.5
Majority94527.9
Turnout 41.38%-0.3%
Labour hold Swing
Labour hold Swing
Labour hold Swing

Hammersmith Broadway

Hammersmith Broadway (3)
PartyCandidateVotes%±%
Labour Stephen Cowan* 2,255 68.6 +15.0
Labour PJ Murphy* 2,188 66.6 +13.0
Labour Patricia Quigley 2,126 64.7 +11.6
Conservative Naomi Greaves65820.0-9.3
Conservative David Rogers64419.6-5.8
Conservative Younis Mageit57917.6-7.4
Liberal Democrats David Burridge40712.4+2.8
Liberal Democrats Jessie Venegas-Garcia37311.4+2.7
Liberal Democrats Christine Longworth34010.3+2.8
Majority146844.7
Turnout 38.81%+1.8%
Labour hold Swing
Labour hold Swing
Labour hold Swing

Munster

Munster (3)
PartyCandidateVotes%±%
Conservative Adronie Alford* 1,374 51.4 -4.3
Conservative Alex Karmel* 1,367 51.1 -3.6
Conservative Dominic Stanton 1,316 49.2 -8.9
Labour Emma Cooper90033.6+7.7
Labour Nikolaos Souslous80029.9+6.6
Labour Leo Watson78629.4+8.6
Liberal Democrats Philip Barton40615.2+5.7
Liberal Democrats Ted Townsend38514.4+5.3
Liberal Democrats Krystian Belliere37814.1+6.1
Majority41615.6
Turnout 34.77%+2.7%
Conservative hold Swing

North End

North End (3)
PartyCandidateVotes%±%
Labour Daryl Brown* 1,944 65.6 +16.9
Labour Larry Culhane* 1,815 61.3 +16.2
Labour Zarar Qayyum 1,741 58.8 +14.4
Conservative Sophie Richards70223.7-16.1
Conservative Chris Glenny68323.1-14.7
Conservative Saif Lone67822.9-11.9
Liberal Democrats Gillian Barnes34611.7+2.3
Liberal Democrats Sarah Taylor33011.1+3.2
Liberal Democrats Meher Oliaji2438.2+2.1
UKIP John Lodge712.4-4.9
Majority103935.1
Turnout 37.94%-1.5%
Labour hold Swing
Labour hold Swing
Labour hold Swing

Palace Riverside

Palace Riverside (2)
PartyCandidateVotes%±%
Conservative Amanda Lloyd-Harris 1,576 61.3 +0.1
Conservative Donald Johnson* 1,565 60.9 -4.1
Labour Clare Clifford63124.5+3.8
Labour Jacolyn Daly56922.1+5.3
Liberal Democrats Tamara Dragadze36314.1+6.7
Liberal Democrats Alexander Bradford34913.6+7.0
Majority93436.4
Turnout 47.01%+2.7%
Conservative hold Swing

Parsons Green and Walham

Parsons Green and Walham (3)
PartyCandidateVotes%±%
Conservative Frances Stainton* 1,800 63.2 -1.7
Conservative Mark Loveday* 1,771 62.2 -0.9
Conservative Matt Thorley 1,755 61.6 -6.4
Labour Mary Smith61221.5+2.7
Labour Stephen Naulls59120.7+0.4
Labour Mahdi Pour Nezami56119.7+1.9
Liberal Democrats Eithne Buchanan-Barrow42014.7+4.2
Liberal Democrats Caroline Mason40914.4+5.8
Liberal Democrats Tony Couldrey37713.2+6.0
Majority114340.1
Turnout 38.26%+2.7%
Conservative hold Swing

Ravenscourt Park

Ravenscourt Park (3)
PartyCandidateVotes%±%
Labour Jonathan Caleb-Landy 1,834 45.9 +6.1
Labour Bora Kwon 1,768 44.2 +8.7
Labour Asif Siddique 1,752 43.8 +8.8
Conservative Harry Phibbs*1,40535.1-7.9
Conservative Lucy Ivimy*1,35133.8-12.3
Conservative Mark Higton1,28132.0-11.4
Liberal Democrats Henrietta Bewley81520.4+11.8
Liberal Democrats Irina Von Wiese 74418.6+12.5
Liberal Democrats Alison Hancock74118.5+12.5
Majority3478.7
Turnout 50.44%+1.1%
Labour gain from Conservative Swing

Sands End

Sands End (3)
PartyCandidateVotes%±%
Labour Lucy Richardson 1,829 49.0 +10.1
Labour Ann Rosenberg 1,818 48.8 +16.7
Labour Matt Uberoi 1,714 46.0 +14.5
Conservative Jackie Borland1,58542.5+0.7
Conservative Steve Hamilton*1,50040.2-2.4
Conservative Tom Martin1,48439.8-0.8
Liberal Democrats Raymond Burnet3429.2+2.1
Liberal Democrats Gerald Milch2887.7+1.5
Liberal Democrats Justin Kandiah2797.5+0.7
Majority1293.5
Turnout 39.41%+6.8%
Labour gain from Conservative Swing

Shepherds Bush Green

Shepherds Bush Green (3)
PartyCandidateVotes%±%
Labour Andrew Jones* 2,050 68.4 +9.2
Labour Natalie Perez* 2,023 67.5 +8.6
Labour Mercy Umeh* 1,981 66.1 +10.1
Conservative Charlotte Duthie55518.5-3.0
Conservative Simon Hewitt53317.8-2.4
Conservative Liane Pibworth47115.7-2.8
Liberal Democrats Ralph Redfern31910.6+2.0
Liberal Democrats Thomas Naylor30710.2N/A
Liberal Democrats Paul Buchanan-Barrow2739.1N/A
Majority142647.6
Turnout 35.35%+0.4%
Labour hold Swing
Labour hold Swing
Labour hold Swing

Town

Town (3)
PartyCandidateVotes%±%
Conservative Victoria Brocklebank-Fowler 1,567 48.0 -4.4
Conservative Belinda Donovan~ 1,508 46.2 +0.1
Conservative Andrew Brown* 1,480 45.3 -5.5
Labour Nick Buckley1,35441.5+17.2
Labour Helen Rowbottom1,33941.0+17.1
Labour James Doheny1,25538.4+16.5
Liberal Democrats Azi Ahmed32810.0-10.1
Liberal Democrats Henry Bagwell32810.0-9.2
Liberal Democrats Graham Muir3239.9-4.7
Majority1263.8
Turnout 41.70%+9.4%
Conservative hold Swing

Wormholt and White City

Wormholt and White City (3)
PartyCandidateVotes%±%
Labour Colin Aherne* 2,493 77.7 +9.3
Labour Sue Macmillan* 2,396 74.7 +12.7
Labour Max Schmid* 2,261 70.5 +13.7
Conservative Nick Botterill~47314.7-2.8
Conservative James O'Donohoe45014.0-2.4
Conservative Amir Sadjady40412.6-3.0
Liberal Democrats Oscar Tapper2427.5+2.2
Liberal Democrats Mark Anderson1875.8N/A
Liberal Democrats Stephen Morris1725.4N/A
Independent Jagdeo Hauzaree892.8N/A
Majority178855.8
Turnout 35.11%-1.9%
Labour hold Swing
Labour hold Swing
Labour hold Swing

By-elections

Fulham Broadway

A by-election was held in Fulham Broadway after the resignation of Councillor Alan de'Ath on 19 September 2019.

Fulham Broadway: 19 September 2019 [7]
PartyCandidateVotes%±%
Labour Helen Rowbottom 1,097 44.2 -8.4
Liberal Democrats Jessie Venegas75530.4+21.7
Conservative Aliya Afzal Khan62825.3-8.8
Majority34213.8
Turnout 2,48031.7-6.0
Labour hold Swing

Wormholt & White City

A by-election was held in Wormholt & White City following the death of Councillor Colin Aherne on 11 July 2021. [8]

Wormholt & White City: 23 September 2021
PartyCandidateVotes%±%
Labour Frances Umeh 1,462 70.0 -5.6
Conservative Constance Campbell43120.6+6.3
Green Naranee Ruthra-Rajan1105.3N/A
Liberal Democrats Michael Illingworth864.1-3.2
Majority1,03149.4
Turnout 2,08922.6
Labour hold Swing Decrease2.svg6.0

Related Research Articles

<span class="mw-page-title-main">Hammersmith (UK Parliament constituency)</span> Parliamentary constituency in the United Kingdom, 2010 onwards

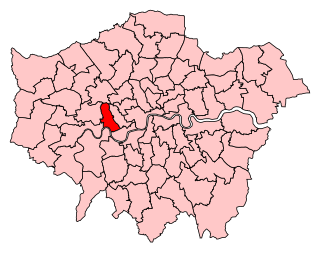
Hammersmith is a parliamentary constituency in the House of Commons of the UK Parliament. It is currently represented by Andy Slaughter, a member of the Labour Party, who has represented the seat since its recreation in 2010.

Hammersmith North was a borough constituency in the Metropolitan Borough of Hammersmith in West London. It returned one Member of Parliament (MP) to the House of Commons of the Parliament of the United Kingdom, elected by the first past the post system.

<span class="mw-page-title-main">Hammersmith and Fulham London Borough Council elections</span> English local election

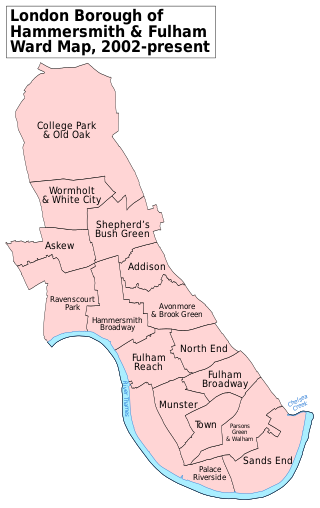
Hammersmith and Fulham London Borough Council is the local authority for the London Borough of Hammersmith and Fulham in London, England. The council is elected every four years.

<span class="mw-page-title-main">2006 Hammersmith and Fulham London Borough Council election</span> 2006 local election in England

Elections to Hammersmith and Fulham Council were held on 4 May 2006. The whole council was up for election for the first time since the 2002 election.

<span class="mw-page-title-main">2014 London local elections</span>

There were local government elections in London on Thursday 22 May 2014. All councillor seats on the 32 London borough councils were up for election. The electorates of Hackney, Lewisham, Newham and Tower Hamlets also elected their executive mayors, who operate in place of council leaders in those boroughs. Ward changes took place in Hackney, Kensington and Chelsea, and Tower Hamlets, which reduced the total number of councillors by 10 to 1,851. Both the mayoral and councillor elections are four-yearly.

<span class="mw-page-title-main">2014 Westminster City Council election</span> 2014 local election in England

The 2014 Westminster City Council election took place on 22 May 2014 to elect members of Westminster City Council in England. This was on the same day as other local elections.

<span class="mw-page-title-main">2012 Pendle Borough Council election</span>

The 2012 Pendle Borough Council election took place on 3 May 2012 to elect members of Pendle Borough Council in Lancashire, England. One third of the council was up for election and the council stayed under no overall control.

The 1964 Hammersmith Council election took place on 7 May 1964 to elect members of Hammersmith London Borough Council in London, England. The whole council was up for election and the Labour party gained control of the council with almost 63% of the vote.

<span class="mw-page-title-main">1978 Hammersmith London Borough Council election</span> 1978 local election in England

The 1978 Hammersmith Council election took place on 4 May 1978 to elect members of Hammersmith London Borough Council in London, England. The whole council was up for election, with an extra two wards and 10 fewer councillors - and the council went in no overall control.

<span class="mw-page-title-main">1982 Hammersmith and Fulham London Borough Council election</span> 1982 local election in England

The 1982 Hammersmith and Fulham Council election took place on 6 May 1982 to elect members of Hammersmith and Fulham London Borough Council in London, England. The whole council was up for election and the council stayed in no overall control.

<span class="mw-page-title-main">1994 Hammersmith and Fulham London Borough Council election</span> 1994 local election in England

The 1994 Hammersmith and Fulham Borough Council election took place on 5 May 1994 to elect members of Hammersmith and Fulham London Borough Council in London, England. The whole council was up for election and the Labour Party regained overall control of the council, which it had lost during the previous council term.

<span class="mw-page-title-main">2018 Barking and Dagenham London Borough Council election</span> 2018 local election in England, UK

The 2018 Barking and Dagenham Council election took place on 3 May 2018 to elect members of Barking and Dagenham Council in London. This was on the same day as other local elections. The Labour Party won every available council seat for the third election in a row, winning 74% of the popular vote. The Conservatives saw their vote share rise by 13 percentage points, but failed to win any seats.

<span class="mw-page-title-main">2022 London local elections</span>

The 2022 London local elections took place on 5 May 2022, as part of the 2022 United Kingdom local elections. All London borough councillor seats were up for election. Mayoral elections took place in Hackney, Lewisham, Newham and Tower Hamlets, with Croydon electing a mayor for the first time following a local referendum in October 2021.

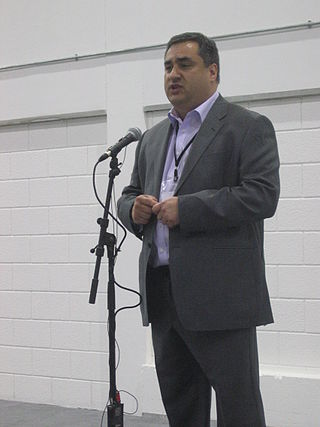
Nicholas Byron "Nick" Botterill is a British businessman, company director, and Conservative politician.

<span class="mw-page-title-main">2022 Barnet London Borough Council election</span> 2022 local election in Barnet

The 2022 Barnet London Borough Council election took place on 5 May 2022, alongside local elections in the other London boroughs and elections to local authorities across the United Kingdom. All 63 members of Barnet London Borough Council were elected. The Labour Party took overall control, winning 41 of the seats to the Conservative Party's 22. This was the first time Labour had won the council outright; previously, the Conservatives had always won the most seats, usually with an overall majority.

<span class="mw-page-title-main">2022 Enfield London Borough Council election</span> 2022 local election in Enfield

The 2022 Enfield London Borough Council election took place on 5 May 2022, alongside local elections in the other London boroughs and elections to local authorities across the United Kingdom. All 63 members of Enfield London Borough Council were elected.

<span class="mw-page-title-main">2022 Hammersmith and Fulham London Borough Council election</span> 2022 local election in Hammersmith and Fulham

The 2022 Hammersmith and Fulham London Borough Council election took place on 5 May 2022. All 50 members of Hammersmith and Fulham London Borough Council were elected. The elections took place alongside local elections in the other London boroughs and elections to local authorities across the United Kingdom.

<span class="mw-page-title-main">2022 Hillingdon London Borough Council election</span> 2022 local election in Hillingdon

The 2022 Hillingdon London Borough Council election took place on 5 May 2022. All 53 members of Hillingdon London Borough Council were elected. The elections took place alongside local elections in the other London boroughs and elections to local authorities across the United Kingdom.

<span class="mw-page-title-main">2022 Westminster City Council election</span> 2022 local election in Westminster

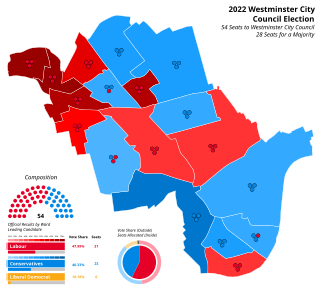
The 2022 Westminster City Councilelection took place on 5 May 2022. All 54 members of Westminster City Council have been elected. The elections took place alongside local elections in the other London boroughs and elections to local authorities across the United Kingdom.

<span class="mw-page-title-main">2022 Calderdale Metropolitan Borough Council election</span> 2022 local election in Calderdale

The 2022 Calderdale Metropolitan Borough Council election took place on 5 May 2022 to elect members of Calderdale Metropolitan Borough Council in England. One third of councillors — 17 out of 51, plus one vacancy in Ovenden ward were up for election. The election took place alongside other local elections across the United Kingdom.

References

  1. "Local Election Summaries 2018". The Elections Centre. Retrieved 24 June 2019.
  2. "Hammersmith and Fulham London Borough Council".
  3. 1 2 "2018 council election results". 10 April 2018.
  4. "Borough Council Election Results 2014". datapress.com. Archived from the original on 8 May 2018.
  5. "Hammersmith and Fulham local elections: Tory leader loses seat". 4 May 2018.
  6. Knowles, Katherine (13 April 2006). "Tories deselect single mother and gay Arab". Pink News . Retrieved 17 January 2023.
  7. "2019 Fulham Broadway ward by-election". Hammersmith & Fulham Borough Council. 13 August 2019. Retrieved 6 April 2020.
  8. "Tribute to Colin Aherne from H&F Leader Stephen Cowan". 12 July 2021.