2018 South Lakeland District Council election

Last updated

2018 South Lakeland District Council election [1]
  2016 3 May 2018 2019  

All 51 seats to South Lakeland District Council
26 seats needed for a majority
 First partySecond partyThird party
 
Party Liberal Democrats Conservative Labour
Last election32162
Seats won29193
Seat changeDecrease2.svg3Increase2.svg3Increase2.svg1
Popular vote43,86043,77710,828
Percentage41.0%40.9%10.1%

South Lakeland UK local election 2018 map.svg
Map showing the results of the 2018 South Lakeland District Council elections by ward. Liberal Democrats in yellow, Conservatives in blue, Labour in red. Striped wards indicate mixed representation.

Council control before election

Liberal Democrats

Council control after election

Liberal Democrats

The 2018 South Lakeland District Council election took place on 3 May 2018 to elect members of South Lakeland District Council in Cumbria, England. The whole council was up for election with boundary changes since the last election in 2016, these major changes to boundaries were recommended by the Local Government Boundary Commission for England (LGBCE) [2] .

Contents

Election result

This result had the following consequences for the total number of seats on the Council after the elections:

PartyPrevious councilNew council+/-
Liberal Democrats3229Decrease2.svg3
Conservatives1619Increase2.svg3
Labour23Increase2.svg1
Independent10Decrease2.svg1
Green00Steady2.svg
UKIP00Steady2.svg
Total5151
Working majority 13  7 
South Lakeland local election result 2018
PartySeatsGainsLossesNet gain/lossSeats %Votes %Votes+/−
  Liberal Democrats 2903-356.8641.0043860
  Conservative 1930+337.2540.9243777
  Labour 310+15.8810.1210828
  Independent 001-100.27286
  Green 000007.698231

Ward results

[3]

An asterisk * indicates an incumbent seeking re-election.

Ambleside and Grasmere

Ambleside and Grasmere (2)
PartyCandidateVotes%±%
Liberal Democrats Vicky Hughes* 863 58.4
Liberal Democrats Vivienne Rees* 780 52.8
Conservative Martin Hall39927.0
Conservative Sandra Lilley37525.4
Green Christina Birch14710.0
Labour Josh Gilroy1087.3
Labour Mark Harrison976.6
Green Arthur Kincaid765.1
Majority38125.8
Turnout 1,47742.7
Liberal Democrats win (new seat)

Arnside and Milnthorpe

Arnside and Milnthorpe (3)
PartyCandidateVotes%±%
Liberal Democrats Ian Stewart* 1,513 55.5
Liberal Democrats Rupert Audland* 1,449 53.2
Liberal Democrats Pete McSweeney* 1,440 52.9
Conservative Steven Hurst93034.1
Conservative Rachel Ashburner91633.6
Conservative Katy Shuttleworth67724.9
Green Jill Abel35313.0
Labour Barry Morgan1405.1
Green Hilary Pickup1234.5
Green Mark Poole1003.7
Majority51018.8
Turnout 2,72452.6
Liberal Democrats win (new seat)

Bowness and Levens

Bowness and Levens (3)
PartyCandidateVotes%±%
Conservative John Holmes* 1,271 57.4
Conservative Kevin Holmes 1,204 54.4
Conservative David Williams* 1,146 51.8
Liberal Democrats Lynda Bond64229.0
Liberal Democrats William Rooke58526.4
Liberal Democrats Carl Smith58426.4
Green Helen Bentley29613.4
Green Jenny Holden-Wilde1627.3
Labour Charlie Whinney1526.9
Green Chris Wilde1366.1
Majority50422.8
Turnout 2,21347.3
Conservative win (new seat)

Broughton and Coniston

Broughton and Coniston (3)
PartyCandidateVotes%±%
Conservative Anne Hall* 1,081 43.6
Liberal Democrats Tracy Coward 1,029 41.5
Conservative Matt Brereton 972 39.2
Liberal Democrats David Fletcher*94037.9
Conservative Anna Ellwood91837.0
Liberal Democrats Ian Wharton87635.4
Independent Joss Curwen*28611.5
Green Lynette Gilligan2349.4
Labour Geraldine Scott2329.4
Labour Paul Martin1656.7
Labour Kevin Parker1656.7
Majority321.3
Turnout 2,47848.8
Conservative win (new seat)
Liberal Democrats win (new seat)
Conservative win (new seat)

Burton and Crooklands

Burton and Crooklands (3)
PartyCandidateVotes%±%
Conservative Roger Bingham* 1,534 59.5
Conservative Brian Cooper* 1,218 47.2
Conservative Tom Harvey* 1,205 46.7
Liberal Democrats Sheila Eccles*98438.2
Liberal Democrats Christine Herbert89834.8
Liberal Democrats Karl Singleton88134.2
Labour Paul Casson1746.7
Green Claire Wickham1546.0
Green Wendi Lethbridge1455.6
Green Simon Blunden1345.2
Majority2218.5
Turnout 2,57853.8
Conservative win (new seat)

Cartmel

Cartmel (2)
PartyCandidateVotes%±%
Liberal Democrats Gill Gardner* 784 50.2
Conservative Michael Cornah 687 44.0
Liberal Democrats Dave Rawcliffe65742.1
Conservative Joanne Moore61139.1
Labour Kate Random Love986.3
Green Robin Le Mare936.0
Green Gwen Harrison442.8
Majority301.9
Turnout 1,56248.5
Liberal Democrats win (new seat)
Conservative win (new seat)

Furness Peninsula

Furness Peninsula (3)
PartyCandidateVotes%±%
Conservative James Airey* 1,014 49.6
Conservative Caroline Airey* 986 48.2
Conservative Andrew Butcher* 878 43.0
Liberal Democrats Janet Willis81239.7
Liberal Democrats Lorraine Birchall67332.9
Liberal Democrats Alan Cook62030.3
Labour Joan Casson24512.0
Labour Philip Cooper20910.2
Labour Eirik Hunt2029.9
Green Peter Howlett1728.4
Majority663.3
Turnout 2,04443.8
Conservative win (new seat)

Grange

Grange (3)
PartyCandidateVotes%±%
Liberal Democrats Eric Morrell* 1,215 48.6
Liberal Democrats Robin Ashcroft 1,139 45.5
Liberal Democrats Dave Khan 1,121 44.8
Conservative Steve Chambers1,05842.3
Conservative Nathan Bushell1,01640.6
Conservative Daniel Asplin97539.0
Green Rachel Whiteley27210.9
Labour Nicola Kennedy1897.6
Green Chris Rowley1154.6
Green Clive Wickham753.0
Majority632.5
Turnout 2,50254.1
Liberal Democrats win (new seat)

Kendal East

Kendal East (3)
PartyCandidateVotes%±%
Liberal Democrats Rachael Hogg 1,093 48.5
Liberal Democrats Eamonn Hennessy 958 42.5
Liberal Democrats Helen Ladhams 885 39.3
Conservative James Alexander80635.8
Conservative Lyndsay Slater71931.9
Conservative Pam Flitcroft70031.1
Labour Phil Atherton27912.4
Labour Helen Stafford22810.1
Labour Maggie Mason2219.8
Green Janet Antrobus2059.1
Green Paul Woods1546.8
Green Andy Mason1466.5
Majority793.5
Turnout 2,25244.0
Liberal Democrats win (new seat)

Kendal North

Kendal North (2)
PartyCandidateVotes%±%
Liberal Democrats Stephen Coleman* 667 42.6
Liberal Democrats Jon Owen 543 34.7
Green Carole Wood46829.9
Conservative Harry Taylor37223.8
Conservative Thomas Scott32420.7
Green Laura Miller27017.3
Labour Jo Magne23815.2
Labour Jim Ring18311.7
Majority754.8
Turnout 1,56547.4
Liberal Democrats win (new seat)

Kendal Rural

Kendal Rural (3)
PartyCandidateVotes%±%
Conservative Pat Bell 1,044 42.9
Liberal Democrats Anne Hutton 969 39.8
Liberal Democrats Hazel Hodgson 907 37.3
Conservative Mike Nicholson84834.9
Liberal Democrats Cheryl Tearle83034.1
Conservative Nigel Byrom81833.6
Green Fran Richardson33813.9
Green Adrian Porter28011.5
Green Daniel Rayson27411.3
Labour Mike Hallsall1817.4
Labour Hanna Burke1767.2
Majority592.4
Turnout 2,43249.5
Conservative win (new seat)
Liberal Democrats win (new seat)

Kendal South and Natland

Kendal South and Natland (3)
PartyCandidateVotes%±%
Liberal Democrats Jonathan Brook* 1,181 48.2
Liberal Democrats Chris Hogg* 1,130 46.2
Liberal Democrats Doug Rathbone 1,017 41.5
Conservative John Waddington94438.6
Conservative Repugnant Aron Taylor90637.0
Conservative Margaret Bond87235.6
Green Henry Adams1787.3
Labour Lois Sparling1747.1
Green Meg Hill1606.5
Labour Alison Gilchrist1425.8
Green Elsa Fuster-Mears1204.9
Labour Ian Law1144.7
Majority732.9
Turnout 2,44849.6
Liberal Democrats win (new seat)

Kendal Town

Kendal Town (3)
PartyCandidateVotes%±%
Liberal Democrats Giles Archibald* 1,219 53.6
Liberal Democrats Peter Thornton* 1,040 45.7
Liberal Democrats Phil Dixon* 1,006 44.2
Labour Paul Braithwaite43319.0
Conservative Fraser Lyall42518.7
Conservative Claire Shuttleworth42318.6
Conservative Daniel Egglestone41918.4
Labour Mick Downes39617.4
Labour Alison Ireland36516.0
Green Robin Bailey30113.2
Green Andrew Herbert27712.2
Green Ian Rodham22710.0
Majority57325.2
Turnout 2,27645.7
Liberal Democrats win (new seat)

Kendal West

Kendal West (3)
PartyCandidateVotes%±%
Liberal Democrats Brian Finch* 999 46.8
Liberal Democrats Matt Severn* 842 39.4
Liberal Democrats Graham Vincent* 841 39.4
Conservative Hannah Lane67031.4
Conservative Melvin Mackie55826.1
Conservative Bill Wearing53224.9
Labour Tony Rothwell35516.6
Labour Trevor Batchelor32615.3
Labour Kate Tordoff23110.8
Green Sue Cox2059.6
Green Rosie Whiting1366.4
Green Phil Whiting1195.6
Majority1718.0
Turnout 2,13541.0
Liberal Democrats win (new seat)

Sedbergh and Kirkby Lonsdale

Sedbergh and Kirkby Lonsdale (3)
PartyCandidateVotes%±%
Conservative Kevin Lancaster* 1,298 47.3
Liberal Democrats Ian Mitchell 1,213 44.2
Conservative Sheila Capstick 1,180 43.0
Liberal Democrats Suzie Pye1,17642.9
Liberal Democrats Christine Best1,15842.2
Conservative Sheena Pring1,07639.2
Green Andi Chapple2027.4
Labour Nick Cross1646.0
Green Daphne Jackson1415.1
Green Adam Rubinstein802.9
Majority40.1
Turnout 2,74250.4
Conservative win (new seat)
Liberal Democrats win (new seat)
Conservative win (new seat)

Ulverston East

Ulverston East (3)
PartyCandidateVotes%±%
Labour Mark Wilson* 818 50.7
Labour David Webster 806 50.0
Labour Shirley-Anne Wilson 747 46.3
Conservative Norman Bishop-Rowe*58136.0
Conservative Sarah Archer56134.8
Conservative Ben Cooper51431.9
Green Chris Loynes27216.9
Liberal Democrats Andrew Hudson22413.9
Majority16610.3
Turnout 1,61234.3
Labour win (new seat)

Ulverston West

Ulverston West (3)
PartyCandidateVotes%±%
Conservative Helen Irving* 1,032 50.0
Conservative Janette Jenkinson* 1,028 49.8
Conservative Amanda Rigg* 955 46.2
Labour Bharath Rajan64031.0
Labour Sharon Webster62530.3
Labour Derek Willison-Parry56927.5
Green Judy Filmore50024.2
Liberal Democrats Ray Beacham24712.0
Liberal Democrats Maureen Nicholson1949.4
Majority31515.2
Turnout 2,06644.6
Conservative win (new seat)

Windermere

Windermere (3)
PartyCandidateVotes%±%
Conservative Ben Berry* 1,234 51.2
Liberal Democrats Andrew Jarvis* 1,067 44.3
Liberal Democrats Dyan Jones* 1,035 43.0
Conservative Jane Hoyle97540.5
Liberal Democrats Magda Khan93438.8
Conservative Ian Keeling89937.3
Labour Penny Henderson2319.6
Green Kate Threadgold1817.5
Green Georgie Brasher853.5
Green Eve Morgan813.4
Majority602.5
Turnout 2,40950.7
Conservative win (new seat)
Liberal Democrats win (new seat)

By-Elections

A by-election was held on 20 December 2018 to fill a vacancy in Arnside & Milnthorpe following the death of Councillor Ian Stewart.

Arnside and Milnthorpe
PartyCandidateVotes%±%
Liberal Democrats Helen Chaffey 1,319 59.4 +3.9
Conservative Rachel Ashburner70931.9-1.7
Green Jill Abel1255.6-7.4
Labour Kate Love683.1-2.0
Majority61027.5+6.1
Turnout 2,22144.2-8.4
Liberal Democrats hold Swing

Related Research Articles

<span class="mw-page-title-main">Westmorland and Lonsdale (UK Parliament constituency)</span> Parliamentary constituency in the United Kingdom, 1983 onwards

Westmorland and Lonsdale is a constituency in the south of Cumbria, represented in the House of Commons of the UK Parliament since 2005 by Tim Farron, the former leader of the Liberal Democrats (2015–2017).

The election of councillors to Allerdale Borough Council in Cumbria, England took place every four years. The council was established in 1974 and it was abolished in 2023. The last elections were in 2019.

The district of Epping Forest is in the county of Essex in England. It was created on 1 April 1974, following the merger of Epping Urban District, Chigwell Urban District, Waltham Holy Cross Urban District, and part of Epping and Ongar Rural District.

Cotswold District Council in Gloucestershire, England, is elected every four years.

One third of South Lakeland District Council in Cumbria, England was elected each year, followed by one year without election.

Babergh District Council in Suffolk, England is elected every four years. Since the last boundary changes in 2019, 32 councillors have been elected from 24 wards.

Braintree District Council in Essex, England is elected every four years. Since the last comprehensive boundary changes in 2015, 49 councillors have been elected from 26 wards.

Dartford Borough Council is the local authority for the Borough of Dartford in Kent, England. The council is elected every four years.

South Oxfordshire District Council, a non-metropolitan district council in Oxfordshire, England is elected every four years.

West Berkshire Council is the local authority for West Berkshire, a unitary authority in Berkshire, England. Until 1 April 1998 it was a non-metropolitan district called Newbury.

<span class="mw-page-title-main">Mole Valley District Council elections</span>

One third of Mole Valley District Council in Surrey, England is elected each year, followed by one year when there is an election to Surrey County Council instead.

Three Rivers District Council elections are held three years out of four to elect members of Three Rivers District Council in Hertfordshire, England. Since the last boundary changes in 2014 the council has comprised 39 councillors representing 13 wards, each of which elects three councillors, one at each election such that a third of the council is elected each time. Elections to Hertfordshire County Council are held in the fourth year of the cycle when there are no district council elections.

South Gloucestershire Council is the local authority for the a unitary authority of South Gloucestershire, England. It was created on 1 April 1996, covering the area of the abolished Kingswood and Northavon districts, and also taking on the services previously provided by the former Avon County Council in the area.

South Northamptonshire District Council in Northamptonshire, England was elected every four years. After the last boundary changes in 2007, 42 councillors were elected from 27 wards. The council was abolished in 2021, with the area becoming part of West Northamptonshire.

Milton Keynes City Council is the local authority for the City of Milton Keynes, a unitary authority in Buckinghamshire, England. Until 1 April 1997 it was a non-metropolitan district.

<span class="mw-page-title-main">2016 South Lakeland District Council election</span>

The 2016 South Lakeland District Council election took place on 5 May 2016 to elect members of South Lakeland District Council in England. This was on the same day as other local elections.

<span class="mw-page-title-main">2018 Wakefield Metropolitan District Council election</span> Local election in England

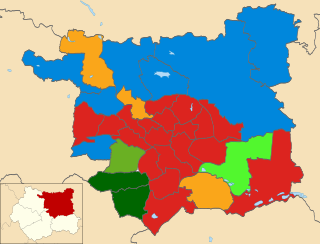
The 2018 Wakefield Metropolitan Borough Council election took place on 3 May 2018 to elect members of Wakefield Metropolitan District Council in England. The election was held on the same day as other local elections. The Labour Party and the Conservative Party fielded a full slate of 21 candidates, as well as 12 Liberal Democrats, 6 Yorkshire Party candidates, 4 Green Party candidates, 3 UK Independence Party candidates, 1 Trade Unionist and Socialist Coalition candidate and 1 Democrats and Veteran's Party candidate.

<span class="mw-page-title-main">2019 Leeds City Council election</span>

The 2019 Leeds City Council election took place on Thursday 2 May 2019 to elect members of Leeds City Council in England. It was held on the same day as other UK local elections across England and Northern Ireland.

<span class="mw-page-title-main">2019 South Lakeland District Council election</span>

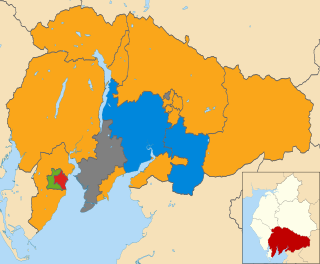
The 2019 South Lakeland District Council election took place on 2 May 2019 to elect members of South Lakeland District Council in Cumbria, England. One third of the council was up for election.

<span class="mw-page-title-main">2022 United Kingdom local elections</span> Elections to local councils and mayoralties

The 2022 United Kingdom local elections took place on Thursday 5 May 2022. These included elections for all London borough councils, for all local authorities in Wales and Scotland. Most seats in England were last up for election in 2018 and in Scotland and Wales in 2017. The elections coincided with the 2022 Northern Ireland Assembly election. In 91 cases, most of them in Wales, council seats were uncontested, each having only one candidate. Three seats in Scotland remained unfilled as no one nominated to fill them.

References

  1. Noel Dempsey (14 May 2018). "Local Elections 2018" (PDF). House of Commons Library. p. 21.
  2. "Re-organisation of Wards". www.southlakeland.gov.uk. South Lakeland Council. Retrieved 4 June 2018.
  3. "Election Results 2018". www.southlakeland.gov.uk. South Lakeland Council. Retrieved 4 June 2018.