2022 Westmorland and Furness Council election

Last updated

The 2022 Westmorland and Furness Council election was held on 5 May 2022 to elect members of Westmorland and Furness Council in England. The council area will consist of the area covered by the districts of Barrow-in-Furness, Eden and South Lakeland. [1] [2]

Contents

These were the first elections to the new authority, with the council acting as a 'shadow authority' until the abolition of the three former districts and Cumbria County Council on 1 April 2023. [3]

Results

The Liberal Democrats secured a majority on the incoming council with 36 out of 65 councillors. Labour will have 15 councillors, the Conservatives will have 11 councillors, the Green Party will have 1 councillor and 2 councillors were elected as independents. [4] [5]

2022 Westmorland and Furness Election
2022 Westmorland and Furness Council Election Results Map.png
PartyCouncillorsVotes
Of totalNetOf totalNet
Liberal Democrats 36
36 / 65
29,96039.8%
Labour Party 15
15 / 65
10,13213.4%
Conservative Party 11
11 / 65
20,84127.7%
Independents 2
2 / 65
8,23810.9%
Green Party 1
1 / 65
5,8397.7%
TUSC 0
0 / 65
3350.4%

Ward results (Barrow-in-Furness)

[6]

PartyCouncillorsVotes
Of totalNetOf totalNet
Labour Party 13
13 / 19
6,94446.5%
Conservative Party 5
5 / 19
5,34235.8%
Independents 1
1 / 19
1,68611.3%
Liberal Democrats 0
0 / 19
9506.4%

Dalton North

Dalton North (2)
PartyCandidateVotes%±%
Conservative Ben Shirley 921 60.6 N/A
Conservative Daniel Edwards 783 51.5 N/A
Labour Robert Elliot55636.6N/A
Liberal Democrats Rachael Hogg26217.2N/A
Liberal Democrats Stephen Coleman1439.4N/A
Majority
Turnout 1,52032.01
Conservative win (new seat)

Dalton South

Dalton South (2)
PartyCandidateVotes%±%
Independent Dave Taylor 585 38.4 N/A
Labour Tony Callister 488 32.0 N/A
Labour Steve Nott48331.7N/A
Conservative Sam Ronson46930.8N/A
Conservative Des English43228.4N/A
Independent Martin McLeavy26817.6N/A
Liberal Democrats Barbara Miller744.9N/A
Liberal Democrats Peter Baker644.2N/A
Majority
Turnout 1,52332.99
Independent win (new seat)
Labour win (new seat)

Hawcoat & Newbarns

Hawcoat & Newbarns (3)
PartyCandidateVotes%±%
Conservative Les Hall 1,151 41.9 N/A
Conservative Niyall Phillips 1,069 38.9 N/A
Conservative Roy Worthington 993 36.1 N/A
Labour David Cassidy97435.4N/A
Labour Mike Leach91333.2N/A
Labour Hayley Preston89132.4N/A
Independent Denise Edwards55820.3N/A
Independent Steven Pryer46817.0N/A
Independent Wendy McClure41615.1N/A
Liberal Democrats David Opie1605.8N/A
Liberal Democrats Sheila Eccles1234.5N/A
Liberal Democrats Christine Herbert1003.6N/A
Majority
Turnout 2,75031.44
Conservative win (new seat)

Old Barrow & Hindpool

Old Barrow & Hindpool (3)
PartyCandidateVotes%±%
Labour Anne Burns 1,183 66.6 N/A
Labour Kevin Hamilton 1,089 61.4 N/A
Labour Margaret Thomson 1,076 60.6 N/A
Conservative Anne Bispham50128.2N/A
Conservative Piya Das40722.9N/A
Conservative Brenda Lauderdale40622.9N/A
Liberal Democrats Adam Campbell1146.4N/A
Liberal Democrats Gill Gardiner995.6N/A
Liberal Democrats Stephen Pickthall834.7N/A
Majority
Turnout 1,77521.10
Labour win (new seat)

Ormsgill & Parkside

Ormsgill & Parkside (3)
PartyCandidateVotes%±%
Labour Bill McEwan 1,242 61.5 N/A
Labour Derek Brook 1,211 60.0 N/A
Labour Beverly Morgan 1,177 58.3 N/A
Conservative Elaine Burley63531.5N/A
Conservative Ann English57528.5N/A
Conservative Emma Wylie52726.1N/A
Liberal Democrats Jayne Richardson1145.6N/A
Liberal Democrats Phil Walker844.2N/A
Liberal Democrats Alasdair Wilkinson-Marsh683.4N/A
Majority
Turnout 2,01924.68
Labour win (new seat)

Risedale & Roosecote

Risedale & Roosecote (3)
PartyCandidateVotes%±%
Labour Jane Murphy 1,152 49.6 N/A
Labour Andy Coles 1,139 49.1 N/A
Labour Trevor Biggins 1,130 48.7 N/A
Conservative Derek Gawne98442.4N/A
Conservative Lynda Shaw94740.8N/A
Conservative Ronnie Haddow87137.5N/A
Liberal Democrats Michael Barwise1456.2N/A
Liberal Democrats Jade Sullivan1285.5N/A
Liberal Democrats Heather Troughton1215.2N/A
Majority
Turnout 2,32128.20
Labour win (new seat)

Walney Island

Walney Island (3)
PartyCandidateVotes%±%
Labour Frank Cassidy 1,349 61.4 N/A
Labour Anita Husband 1,179 53.7 N/A
Labour Therese Assouad 1,175 53.5 N/A
Conservative Paul Rose68131.0N/A
Conservative Steve Sharpe63829.1N/A
Conservative Terri-Ann Gibney62228.3N/A
Independent Steven Fletcher27512.5N/A
Liberal Democrats Paul Trollope813.7N/A
Liberal Democrats Chris Hogg773.5N/A
Liberal Democrats Tina Perkins592.7N/A
Majority
Turnout 2,19626.73
Labour win (new seat)

Ward results (Eden)

PartyCouncillorsVotes
Of totalNetOf totalNet
Liberal Democrats 11
11 / 16
7,89839.7%
Conservative Party 3
3 / 16
5,09625.6%
Independents 1
1 / 16
5,12425.8%
Labour Party 1
1 / 16
8244.1%
Green Party 0
0 / 16
9314.7%

Alston & Fellside

Alston & Fellside (2)
PartyCandidateVotes%±%
Independent Mary Robinson 984 45.9 N/A
Labour Michael Hanley 824 38.4 N/A
Labour Ian Lindley57226.7N/A
Conservative Michael Beveridge42519.8N/A
Conservative Dale Normington40318.8N/A
Liberal Democrats Andy Baker40218.7N/A
Liberal Democrats Richard Sanderson1476.9N/A
Majority
Turnout 2,14541.31
Independent win (new seat)
Labour win (new seat)

Appleby & Brough

Appleby & Brough (2)
PartyCandidateVotes%±%
Liberal Democrats Andy Connell 986 51.8 N/A
Liberal Democrats Graham Simpkins 631 33.2 N/A
Independent Gareth Hayes60932.0N/A
Independent William Patterson51126.9N/A
Conservative Colin Smith45123.7N/A
Conservative Harry Berkeley36319.1N/A
Majority
Turnout 1,90240.23
Liberal Democrats win (new seat)

Eamont & Shap

Eamont & Shap (1)
PartyCandidateVotes%±%
Liberal Democrats Neil Hughes 1,031 65.7 N/A
Conservative Tom Lowther53934.3N/A
Majority49231.4
Turnout 1,57045.55
Liberal Democrats win (new seat)

Eden & Lyvennet Vale

Eden & Lyvennet Vale (2)
PartyCandidateVotes%±%
Liberal Democrats Lorna Baker 960 51.0 N/A
Liberal Democrats Neil McCall 816 43.3 N/A
Conservative Paula Breen63033.4N/A
Conservative David Whipp58531.1N/A
Independent Mike Tonkin46624.7N/A
Majority
Turnout 1,88442.03
Liberal Democrats win (new seat)

Greystoke & Ullswater

Greystoke & Ullswater (1)
PartyCandidateVotes%±%
Liberal Democrats Judith Derbyshire 1,150 70.8 N/A
Conservative Debbie Wicks47529.2N/A
Majority67541.6
Turnout 1,62547.66
Liberal Democrats win (new seat)

Hesket & Lazonby

Hesket & Lazonby (2)
PartyCandidateVotes%±%
Conservative Colin Atkinson 676 33.4 N/A
Conservative Hilary Carrick 658 32.5 N/A
Independent Elaine Martin59929.6N/A
Independent David Ryland53026.2N/A
Liberal Democrats Roger Burgin48423.9N/A
Liberal Democrats David Evans22911.3N/A
Green Belinda Lloyd442.2N/A
Majority
Turnout 2,02340.93
Conservative win (new seat)

Kirkby Stephen & Tebay

Kirkby Stephen & Tebay (2)
PartyCandidateVotes%±%
Conservative Phil Dew 861 51.5 N/A
Liberal Democrats John Murray 697 41.7 N/A
Liberal Democrats Adrian Waite55733.3N/A
Independent Sandy Lancaster49629.7N/A
Conservative Ray Briggs26615.9N/A
Majority
Turnout 1,67241.90
Conservative win (new seat)
Liberal Democrats win (new seat)

Penrith North

Penrith North (2)
PartyCandidateVotes%±%
Liberal Democrats Patricia Bell 1,277 58.6 N/A
Liberal Democrats Mark Rudhall 820 37.6 N/A
Green Ali Ross67531.0N/A
Conservative Helen Fearon51923.8N/A
Conservative Harry Fearon44420.4N/A
Green Wade Tidbury26612.2N/A
Independent Scott Jackson1386.3N/A
Independent Peter Devine1225.6N/A
Majority
Turnout 2,17837.84
Liberal Democrats win (new seat)

Penrith South

Penrith South (2)
PartyCandidateVotes%±%
Liberal Democrats Virginia Taylor 911 45.5 N/A
Liberal Democrats Mike Eyles 899 44.9 N/A
Conservative Gillian Barnes52026.0N/A
Conservative Matt Vickers45922.9N/A
Independent Lee Quinn39719.8N/A
Independent Margaret Clark27213.6N/A
Green Richard O'Brien21210.6N/A
Majority
Turnout 2,00128.55
Liberal Democrats win (new seat)

Ward results (South Lakeland)

PartyCouncillorsVotes
Of totalNetOf totalNet
Liberal Democrats 25
25 / 30
21,11252.1%
Conservative Party 3
3 / 30
10,40325.7%
Green Party 1
1 / 30
4,90812.1%
Labour Party 1
1 / 30
2,3645.8%
Independents 0
0 / 30
1,4283.5%
TUSC 0
0 / 30
3350.8%

Bowness & Lyth

Bowness & Lyth (1)
PartyCandidateVotes%±%
Liberal Democrats Steve Bavin 747 53.1 N/A
Conservative Jim Bland58441.5N/A
Green Simon Clayton755.3N/A
Majority16311.6
Turnout 1,40648.34
Liberal Democrats win (new seat)

Burton & Holme

Burton & Holme (1)
PartyCandidateVotes%±%
Liberal Democrats Vicky Hughes 891 60.7 N/A
Conservative Tom Harvey51935.4N/A
Green Simon Blunden584.0N/A
Majority37225.3
Turnout 1,46852.57
Liberal Democrats win (new seat)

Coniston & Hawkshead

Coniston & Hawkshead (1)
PartyCandidateVotes%±%
Liberal Democrats Suzanne Pender 854 63.9 N/A
Conservative Michael Hoad37027.7N/A
Labour Paul Andrew Martin604.5N/A
Green Mark Poole534.0N/A
Majority48436.2
Turnout 1.33750.93
Liberal Democrats win (new seat)

Grange & Cartmel

Grange & Cartmel (3)
PartyCandidateVotes%±%
Liberal Democrats Jenny Boak 2,588 59.3 N/A
Liberal Democrats Pete Endsor 2,486 56.9 N/A
Liberal Democrats Sue Sanderson 2,040 46.7 N/A
Independent Fiona Hanlon1,42832.7N/A
Conservative Tor McLaren1,05024.0N/A
Conservative James Townley88220.2N/A
Conservative David Wilson72916.7N/A
Green Mandy Barnett3016.9N/A
Green Paul Woods1774.1N/A
Green Luke Mossbarnett1373.1N/A
TUSC Lilian El-Doufani1052.4N/A
Majority
Turnout 4,36749.85
Liberal Democrats win (new seat)

High Furness

High Furness (1)
PartyCandidateVotes%±%
Conservative Matt Brereton 581 41.4 N/A
Liberal Democrats Ian Wharton56240.0N/A
Labour Stephen Carter16411.7N/A
Green Peter Howlett976.9N/A
Majority191.4
Turnout 1,40445.97
Conservative win (new seat)

Kendal Castle

Kendal Castle (2)
PartyCandidateVotes%±%
Liberal Democrats Eamonn Hennessy 1,224 59.8 N/A
Liberal Democrats Helen Ladhams 1,212 59.2 N/A
Conservative Nigel Byrom43021.0N/A
Conservative David Williams40419.7N/A
Green Claire Wickham20710.1N/A
Green Janet Antrobus1989.7N/A
Labour Penny Henderson1346.5N/A
Majority
Turnout 2,04842.74
Liberal Democrats win (new seat)

Kendal Highgate

Kendal Highgate (2)
PartyCandidateVotes%±%
Liberal Democrats Phil Dixon 1,111 62.5 N/A
Liberal Democrats Matt Severn 942 53.0 N/A
Conservative Margaret Bond27915.7N/A
Conservative Mike Nicholson26414.8N/A
Green Rosie Naish25614.4N/A
Green Ian Rodham17910.1N/A
Labour Oliver Gill1609.0N/A
TUSC Trevor Batchelor1226.9N/A
Majority
Turnout 1,77838.13
Liberal Democrats win (new seat)

Kendal Nether

Kendal Nether (2)
PartyCandidateVotes%±%
Liberal Democrats Shirley Evans 1,192 62.6 N/A
Liberal Democrats Jonathan Cornthwaite 1,166 61.2 N/A
Conservative Lyndsay Slater33317.5N/A
Conservative Raymond Bower27114.2N/A
Green Liz Wood19910.5N/A
Labour Paul Braithwaite1829.6N/A
Green Daniel Rayson1548.1N/A
TUSC Paul Casson613.2N/A
Majority
Turnout 1,90437.99
Liberal Democrats win (new seat)

Kendal South

Kendal South (2)
PartyCandidateVotes%±%
Liberal Democrats Jonathan Brook 1,547 64.9 N/A
Liberal Democrats Doug Rathbone 1,540 64.6 N/A
Conservative Luke Gudgeon56423.7N/A
Conservative Shiela Worthington42117.7N/A
Green Elsa Fuster1777.4N/A
Labour Lois Sparling1355.7N/A
Green Phil Whiting1094.6N/A
Majority
Turnout 2,38348.33
Liberal Democrats win (new seat)

Kendal Strickland & Fell

Kendal Strickland & Fell (2)
PartyCandidateVotes%±%
Liberal Democrats Giles Archibald 1,381 56.4 N/A
Liberal Democrats Peter Thornton 1,225 50.0 N/A
Green Laura Miller74930.6N/A
Green Graham Vincent57623.5N/A
Labour Virginia Branney2439.9N/A
Conservative Irene Asbury2219.0N/A
Conservative Jacqueline Scott2158.8N/A
TUSC Martin Powell-Davies471.9N/A
Majority
Turnout 2,44849.44
Liberal Democrats win (new seat)

Kent Estuary

Kent Estuary (2)
PartyCandidateVotes%±%
Liberal Democrats Helen Chaffey 1,767 67.8 N/A
Liberal Democrats Rupert Audland 1,621 62.2 N/A
Conservative Margaret Handley65425.1N/A
Conservative Peter Smillie52620.2N/A
Green Jill Abel33712.9N/A
Majority
Turnout 52.15
Liberal Democrats win (new seat)

Levens & Crooklands

Levens & Crooklands (1)
PartyCandidateVotes%±%
Liberal Democrats Janet Battye 1,106 64.4 N/A
Conservative Kevin Holmes53931.4N/A
Green Hilary Pickup734.2N/A
Majority56733.0
Turnout 1,71854.66
Liberal Democrats win (new seat)

Low Furness

Low Furness (1)
PartyCandidateVotes%±%
Conservative Ben Cooper 650 44.5 N/A
Liberal Democrats Janet Willis62742.9N/A
Labour Eirik Hunt1288.8N/A
Green Paul Rigg563.8N/A
Majority231.6
Turnout 1,46143.91
Conservative win (new seat)

Sedbergh & Kirkby Lonsdale

Sedbergh & Kirkby Lonsdale (2)
PartyCandidateVotes%±%
Liberal Democrats Ian Mitchell 1,891 60.2 N/A
Liberal Democrats Hazel Hodgson 1,854 59.1 N/A
Conservative Kevin Lancaster98331.3N/A
Conservative Pat Bell89828.6N/A
Green Tony Gray2257.2N/A
Majority
Turnout 3,13951.81
Liberal Democrats win (new seat)

Ulverston

Ulverston (3)
PartyCandidateVotes%±%
Green Judy Filmore 1,445 36.4 N/A
Labour Jackie Drake 1,286 32.4 N/A
Conservative Helen Irving 1,265 31.8 N/A
Labour Michelle Scrogham1,24731.4N/A
Conservative Andrew Butcher1,21830.7N/A
Labour Mark Wilson1,18929.9N/A
Conservative Amanda Rigg1,16529.3N/A
Green Bob Gerry93023.4N/A
Green Rob O'Hara86421.8N/A
Liberal Democrats Andrew Hudson3458.7N/A
Liberal Democrats Dave Rushton2466.2N/A
Liberal Democrats Charles Howarth2095.3N/A
Majority
Turnout 3,97242.76
Green win (new seat)
Labour win (new seat)
Conservative win (new seat)

Upper Kent

Upper Kent (1)
PartyCandidateVotes%±%
Liberal Democrats Ali Jama 949 60.3 N/A
Conservative Deborah Huck41526.4N/A
Green Fran Richardson21013.3N/A
Majority53433.9
Turnout 1,57447.44
Liberal Democrats win (new seat)

Windermere & Ambleside

Windermere & Ambleside (3)
PartyCandidateVotes%±%
Liberal Democrats Will Clark 2,330 67.1 N/A
Liberal Democrats Andrew Jarvis 2,231 64.3 N/A
Liberal Democrats Dyan Jones 2,183 62.9 N/A
Conservative Cath Musetti96627.8N/A
Conservative Jolyon Stephenson77422.3N/A
Conservative Paula Cross75121.6N/A
Green Kate Threadgold39011.2N/A
Majority
Turnout 3,47145.52
Liberal Democrats win (new seat)

By-elections

Grange & Cartmel

Grange & Cartmel: 2 May 2024
PartyCandidateVotes%±%
Liberal Democrats Andy Hull 2,852 77.2 +20.3
Conservative Ally Hibbert69118.7-5.3
TUSC Martin Powell-Davies1514.2+1.8
Majority2,16158.5N/A
Turnout 3,69443.0-6.9
Liberal Democrats hold Swing

See also

Related Research Articles

<span class="mw-page-title-main">Cumbria</span> Ceremonial county of England

Cumbria is a ceremonial county in North West England. It borders the Scottish council areas of Dumfries and Galloway and Scottish Borders to the north, Northumberland and County Durham to the east, North Yorkshire to the south-east, Lancashire to the south, and the Irish Sea to the west. Its largest settlement is the city of Carlisle.

<span class="mw-page-title-main">Westmorland</span> Historic county of England

Westmorland is an area of Northern England which was historically a county. People of the area are known as Westmerians. The area includes part of the Lake District and the southern Vale of Eden.

<span class="mw-page-title-main">Appleby-in-Westmorland</span> Market town in Cumbria, England

Appleby-in-Westmorland is a market town and civil parish in Westmorland and Furness, Cumbria, England, with a population of 3,048 at the 2011 Census. Crossed by the River Eden, Appleby is the county town of the historic county of Westmorland. It was known just as Appleby until 1974–1976, when the council of the successor parish to the borough changed it to retain the name Westmorland, which was abolished as an administrative area under the Local Government Act 1972, before being revived as Westmorland and Furness in 2023. It lies 14 miles (23 km) south-east of Penrith, 32 miles (51 km) south-east of Carlisle, 27 miles (43 km) north-east of Kendal and 45 miles (72 km) west of Darlington.

<span class="mw-page-title-main">South Lakeland</span> Former local government district in England

South Lakeland was a local government district in Cumbria, England, from 1974 to 2023. Its council was based in Kendal. The district covered the southern part of the Lake District region, as well as northwestern parts of the Yorkshire Dales. At the 2011 Census, the population of the district was 103,658, an increase from 102,301 at the 2001 Census.

<span class="mw-page-title-main">Borough of Copeland</span> Former borough and non-metropolitan district in England

The Borough of Copeland was a local government district with borough status in western Cumbria, England. Its council was based in Whitehaven. It was formed on 1 April 1974 by the merger of the Borough of Whitehaven, Ennerdale Rural District and Millom Rural District. The population of the Non-Metropolitan district was 69,318 according to the 2001 census, increasing to 70,603 at the 2011 Census.

<span class="mw-page-title-main">Allerdale</span> Former non-metropolitan district in England

Allerdale was a non-metropolitan district of Cumbria, England, with borough status. Its council was based in Workington and the borough has a population of 93,492 according to the 2001 census, increasing to 96,422 at the 2011 Census.

<span class="mw-page-title-main">Eden District</span> Former local government district in England

Eden was a local government district in Cumbria, England, based at Penrith Town Hall in Penrith. It was named after the River Eden, which flowed north through the district toward Carlisle. Its population of 49,777 at the 2001 census, increased to 52,564 at the 2011 Census. A 2019 estimate was 53,253. In July 2021 it was announced that, in April 2023, Cumbria would be divided into two unitary authorities. On 1 April 2023, Eden District Council was abolished and its functions transferred to the new authority Westmorland and Furness, which also covers the former districts of Barrow-in-Furness and South Lakeland.

<span class="mw-page-title-main">Borough of Barrow-in-Furness</span> Former local government district in England

Barrow-in-Furness was a local government district with borough status in Cumbria, England. It was named after its main town, Barrow-in-Furness. Other settlements included Dalton-in-Furness and Askam-in-Furness. It was the smallest district in Cumbria, but the most densely populated, with 924 people per square kilometre. The population was 71,980 in 2001, reducing to 69,087 at the 2011 Census.

<span class="mw-page-title-main">Eden District Council elections</span>

Eden District Council in Cumbria, England was elected every four years.

<span class="mw-page-title-main">Cumbria County Council</span> Former local authority in England

Cumbria County Council was the county council for the non-metropolitan county of Cumbria in the North West of England. Established in April 1974, following its first elections held the previous year, it was an elected local government body responsible for the most significant local services in the area, including schools, roads, and social services.

<span class="mw-page-title-main">Cumberland County Council, England</span> Local government body in Cumberland, England

Cumberland County Council was the county council of Cumberland in the North West of England, an elected local government body responsible for most local services in the county. It was established in 1889 as a result of the Local Government Act 1888. Carlisle was initially within its area but became a separate county borough in 1914. In 1974, both authorities were merged along with parts of others into the new Cumbria County Council. In April 2023 local government in Cumbria was reorganised into two unitary authorities, one of which is named Cumberland Council and includes most of the historic county, with the exception of Penrith and the surrounding area.

<span class="mw-page-title-main">Combined authorities and combined county authorities</span> Type of local government institution in England

A combined authority (CA) is a type of local government institution introduced in England outside Greater London by the Local Democracy, Economic Development and Construction Act 2009. CAs are created voluntarily and allow a group of local authorities to pool appropriate responsibility and receive certain devolved functions from central government in order to deliver transport and economic policy more effectively over a wider area. In areas where local government is two-tier, both must participate in the combined authority.

<span class="mw-page-title-main">Cumberland Council</span> Local authority of Cumberland, England

Cumberland Council is the local authority for Cumberland in England. It is a unitary authority, having the powers of a non-metropolitan county and district council combined. It was first elected in May 2022 and operated as a shadow authority until taking up its powers on 1 April 2023. Cumberland Council replaced Cumbria County Council, Allerdale Borough Council, Carlisle City Council and Copeland Borough Council.

<span class="mw-page-title-main">2021 United Kingdom local elections</span> Elections to local councils and mayoralties

The 2021 United Kingdom local elections were held on Thursday 6 May 2021. More than 145 English local councils, around 5,000 councillor seats, thirteen directly elected mayors in England, and 39 police and crime commissioners in England and Wales were contested. On the same day, the 2021 Hartlepool by-election took place, and there were also elections to the Scottish Parliament, Senedd and London Assembly, the last in conjunction with the London mayoral election.

Structural changes to local government in England took place between 2019 and 2023. Some of these changes continue the trend of new unitary authorities being created from other types of local government districts, which was a policy of Communities Secretary Robert Jenrick from 2019.

<span class="mw-page-title-main">2022 United Kingdom local elections</span> Elections to local councils and mayoralties

The 2022 United Kingdom local elections took place on Thursday 5 May 2022. These included elections for all London borough councils, for all local authorities in Wales and Scotland. Most seats in England were last up for election in 2018 and in Scotland and Wales in 2017. The elections coincided with the 2022 Northern Ireland Assembly election. In 91 cases, most of them in Wales, council seats were uncontested, each having only one candidate. Three seats in Scotland remained unfilled as no one nominated to fill them.

<span class="mw-page-title-main">Cumberland (unitary authority)</span> District in Cumbria, England

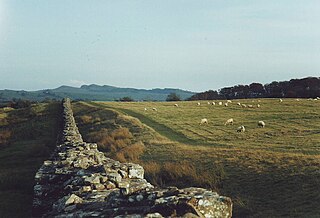
Cumberland is a unitary authority area in Cumbria, England, which means that is a non-metropolitan county and district. It borders Scotland, Northumberland, Westmorland and Furness, and the Irish Sea. Part of the area is in the Lake District National Park and notable landmarks include Carlisle Cathedral, Carlisle Castle and Hadrian's Wall.

<span class="mw-page-title-main">Westmorland and Furness</span> District in Cumbria, England

Westmorland and Furness is a unitary authority area in Cumbria, England. The economy is mainly focused on tourism around both the Lake District and Cumbria Coast, shipbuilding and the port in Barrow-in-Furness, and agriculture in the rural parts of the area.

<span class="mw-page-title-main">Westmorland and Furness Council</span> Local authority of Westmorland and Furness, England

Westmorland and Furness Council is the local authority for Westmorland and Furness in the north-west of England. It is a unitary authority, having the powers of a county council and district council combined. Westmorland and Furness Council was first elected in May 2022, operating as a shadow authority until it replaced Cumbria County Council, Barrow-in-Furness Borough Council, Eden District Council and South Lakeland District Council on 1 April 2023.

All 65 members of Westmorland and Furness Council unitary authority in England are elected every four years.

References

  1. "Next steps for new unitary councils in Cumbria, North Yorkshire and Somerset". Ministry of Housing, Communities & Local Government. 21 July 2021. Retrieved 9 January 2022.
  2. "The Cumbria (Structural Changes) Order 2022" . Retrieved 24 March 2023.
  3. "Names for two controversial Cumbria councils revealed". BBC News. 5 November 2021. Retrieved 9 January 2022.
  4. "Westmorland and Furness".
  5. "Westmorland & Furness result - Local Elections 2022". BBC News.
  6. "Westmorland and Furness" . Retrieved 24 March 2023.