Elections to Newport City Council were held on 5 May 2022 along with elections to the other 21 local authorities in Wales, community council elections in Wales and 2022 United Kingdom local elections. The previous full council election took place in May 2017, though there had also been a number of by-elections in the city in the intervening period.
The Labour Party had controlled Newport since 2012 and the Liberal Democrats, Conservatives and independents were hoping to make some inroads at this election. [1]
Following an electoral boundary review, the overall number of electoral wards increased from 20 to 21, with the total number of councillors increasing by one, from 50 to 51. The former Rogerstone ward was split into three [1] while the Tredegar Park and Marshfield ward were merged. The Langstone, Llanwern and Lliswerry wards were substantially reconfigured.
Party | Seats | Gains | Losses | Net gain/loss | Seats % | Votes % | Votes | +/− | |
---|---|---|---|---|---|---|---|---|---|
Labour | 35 | 4 | 68.6 | 49.1 | 44,892 | +13.0 | |||
Conservative | 7 | 5 | 13.7 | 28.3 | 25,928 | -3.7 | |||
Independent | 4 | 3 | 7.8 | 7.4 | 6,769 | +4.4 | |||
Newport Ind. | 3 | 1 | 5.9 | 4.6 | 4,198 | -5.6 | |||
Liberal Democrats | 1 | 1 | 2.0 | 8.0 | 7,314 | -1.4 | |||
Green | 1 | 1 | 2.0 | 1.8 | 1,621 | -0.1 | |||
Plaid Cymru | 0 | 0.0 | 0.5 | 485 | -3.6 | ||||
Propel | 0 | 0.0 | 0.3 | 281 | N/A |
An asterix indicates the candidate is a sitting councillor for the ward standing for re-election. [4]
Party | Candidate | Votes | % | ±% | |
---|---|---|---|---|---|
Labour | Pat Drewett | 1,366 | 47.7 | ||
Conservative | Matthew Evans * | 1,324 | 46.2 | ||
Conservative | David Fouweather * | 1,253 | 43.7 | ||
Conservative | Charles Ferris * | 1,216 | 42.4 | ||
Labour | Joshua Worrad | 1,130 | 39.4 | ||
Labour | Ibrahim Hayat | 1,123 | 39.2 | ||
Green | Christian Schmidt | 348 | 12.1 | ||
Plaid Cymru | Jonathan Clark | 334 | 11.7 | ||
Liberal Democrats | Karl Mudd | 191 | 6.7 | ||
Liberal Democrats | Roisin Stallard | 164 | 5.7 | ||
Liberal Democrats | Rabeya Sharmin | 147 | 5.1 | ||
Turnout | 43.0 | ||||
Labour gain from Conservative | |||||
Conservative hold | |||||
Conservative hold |
Party | Candidate | Votes | % | ±% | |
---|---|---|---|---|---|
Labour | Debbie Harvey * | 996 | 73.6 | ||
Labour | Tim Harvey | 897 | 66.3 | ||
Labour | Alex Pimm | 884 | 65.3 | ||
Conservative | Kerry Ballard | 453 | 33.5 | ||
Conservative | Paul Mainwaring | 405 | 29.9 | ||
Liberal Democrats | Harry Petty | 255 | 18.8 | ||
Liberal Democrats | Shihan Uddin | 198 | 14.6 | ||
Turnout | 26.5 | ||||
Labour hold | |||||
Labour hold | |||||
Labour hold |
Party | Candidate | Votes | % | ±% | |
---|---|---|---|---|---|
Labour | Deb Davies * | 1,113 | 69.4 | ||
Labour | Matthew Pimm | 1,030 | 64.2 | ||
Labour | Mark Spencer * | 1,006 | 62.7 | ||
Liberal Democrats | Holly Townsend | 418 | 26.1 | ||
Liberal Democrats | Jeff Evans | 363 | 22.6 | ||
Conservative | Mary Shwartz | 337 | 21.0 | ||
Conservative | Saeed Zafar | 286 | 17.8 | ||
Liberal Democrats | Harun Rashid | 260 | 16.2 | ||
Turnout | 31.8 | ||||
Labour hold | |||||
Labour hold | |||||
Labour hold |
Party | Candidate | Votes | % | ±% | |
---|---|---|---|---|---|
Newport Ind. | Kevin Whitehead * | 673 | 52.5 | ||
Newport Ind. | Janet Cleverly * | 633 | 49.4 | ||
Newport Ind. | Jason Jordan * | 594 | 46.4 | ||
Labour | Neil Griffiths | 528 | 41.2 | ||
Labour | Orhan Aksoy | 487 | 38.0 | ||
Labour | Coral Houtman | 460 | 35.9 | ||
Conservative | Carolyn Foster | 164 | 12.8 | ||
Conservative | Paula Fouweather | 157 | 12.3 | ||
Conservative | Denise Hall | 148 | 11.6 | ||
Turnout | 24.6 | ||||
Newport Ind. hold | |||||
Newport Ind. hold |
Party | Candidate | Votes | % | ||
---|---|---|---|---|---|
Conservative | William Routley | 1,052 | 59.7 | ||
Conservative | Ray Mogford | 1,042 | 59.1 | ||
Labour | Julie Hando | 580 | 32.9 | ||
Labour | Andrew Bettridge | 530 | 30.1 | ||
Liberal Democrats | Sian Townsend | 194 | 11.0 | ||
Liberal Democrats | Md Ahmed | 125 | 7.1 | ||
Turnout | 33.7 | ||||
Conservative win (new seat) | |||||
Conservative win (new seat) |
Routley and Mogford had been the sitting councillors for the former Langstone ward, which had the Bishton community added at this election.
Party | Candidate | Votes | % | ±% | |
---|---|---|---|---|---|
Labour | Jason Hughes * | 1,334 | 53.7 | ||
Labour | Claire Baker-Westhead | 1,271 | 51.2 | ||
Labour | Steve Cocks | 1,200 | 48.3 | ||
Conservative | Joan Watkins * | 1,141 | 45.9 | ||
Conservative | Huw Davies | 1,051 | 42.3 | ||
Conservative | Harry Weeks | 1,034 | 41.6 | ||
Liberal Democrats | Paul L'Allier | 228 | 9.2 | ||
Liberal Democrats | Belayet Khan | 192 | 7.7 | ||
Turnout | 41.0 | ||||
Labour hold | |||||
Labour hold | |||||
Labour gain from Conservative |
Party | Candidate | Votes | % | ±% | |
---|---|---|---|---|---|
Labour | Stephen Marshall * | 1,199 | 63.8 | ||
Labour | Bev Perkins | 1,145 | 60.9 | ||
Labour | Dimitri Batrouni | 1,106 | 58.9 | ||
Conservative | Nicholas Clark | 709 | 37.7 | ||
Conservative | Lloyd Walsh | 646 | 34.4 | ||
Conservative | Jay Shwartz | 587 | 31.2 | ||
Liberal Democrats | Anamul Hossain | 246 | 13.1 | ||
Turnout | 31.1 | ||||
Labour hold | |||||
Labour hold | |||||
Labour hold |
Party | Candidate | Votes | % | ±% | |
---|---|---|---|---|---|
Conservative | David Williams * | 657 | 43.6 | ||
Labour | John Harris | 654 | 43.4 | ||
Labour | Kath Hopkins | 651 | 43.2 | ||
Conservative | David Williams | 639 | 42.4 | ||
Liberal Democrats | Nathan Tarr | 415 | 27.5 | ||
Turnout | 40.3 | ||||
Conservative hold | |||||
Labour gain from Conservative |
Party | Candidate | Votes | % | ±% | |
---|---|---|---|---|---|
Conservative | Martyn Kellaway * | 658 | 63.8 | ||
Labour | Abul Chowdhury | 313 | 30.4 | ||
Liberal Democrats | Colleen Kennard-Smith | 60 | 5.8 | ||
Turnout | |||||
Conservative hold | Swing | ||||
Party | Candidate | Votes | % | ±% | |
---|---|---|---|---|---|
Independent | Allan Morris * | 1,723 | |||
Independent | Andrew Sterry | 1,623 | |||
Independent | Mark Howells | 1,616 | |||
Independent | James Peterson | 1,564 | |||
Labour | Roger Jeavons * | 902 | |||
Labour | John Richards * | 864 | |||
Labour | Shah Alom | 848 | |||
Labour | Ruqia Hayat | 833 | |||
Conservative | Luke Thompson | 284 | |||
Turnout | |||||
Independent hold | |||||
Independent gain from Labour | |||||
Independent gain from Labour |
The community of Nash was transferred from Liswerry to the Llanwern ward at this election.
Party | Candidate | Votes | % | ±% | |
---|---|---|---|---|---|
Labour | Jane Mudd * | 978 | 48.8 | ||
Labour | James Clarke * | 933 | 46.5 | ||
Labour | David Mayer * | 867 | 43.2 | ||
Conservative | Michael Brunnock | 745 | 37.1 | ||
Conservative | Stephen Manley | 692 | 34.5 | ||
Conservative | Jonathan Hollins | 561 | 28.0 | ||
Newport Ind. | Michael Cox | 526 | 26.2 | ||
Newport Ind. | Rachel Reaney | 482 | 24.0 | ||
Liberal Democrats | Sarah Lockyer | 147 | 7.3 | ||
Liberal Democrats | Kobir Ahmed | 87 | 4.3 | ||
Turnout | |||||
Labour hold | |||||
Labour hold | |||||
Labour hold |
Party | Candidate | Votes | % | ±% | |
---|---|---|---|---|---|
Labour | Saeed Adan | 840 | 55.4 | ||
Labour | Debbie Jenkins | 759 | 50.1 | ||
Newport Ind. | Marc Ravenscroft | 347 | 22.9 | ||
Newport Ind. | Wan Taylor | 298 | 19.7 | ||
Liberal Democrats | Shamimul Islam | 270 | 17.8 | ||
Plaid Cymru | Khalilur Rahman | 151 | 10.0 | ||
Conservative | Brinley Cox | 133 | 8.8 | ||
Conservative | Judith Davies | 129 | 8.5 | ||
Liberal Democrats | Mihai Munteanu | 103 | 6.8 | ||
Turnout | |||||
Labour hold | |||||
Labour hold |
Party | Candidate | Votes | % | ±% | |
---|---|---|---|---|---|
Labour | Emma Corten | 901 | 69.7 | ||
Labour | Laura Lacey * | 884 | 68.4 | ||
Labour | Malcolm Linton * | 809 | 62.6 | ||
Conservative | Tina Evans | 374 | 28.9 | ||
Conservative | Nicola Hobbs | 348 | 26.9 | ||
Conservative | Georgina Webb | 319 | 24.7 | ||
Independent | Raymond Lord | 243 | 18.8 | ||
Turnout | 24.6 | ||||
Labour hold | |||||
Labour hold | |||||
Labour hold |
Party | Candidate | Votes | % | ||
---|---|---|---|---|---|
Labour | Bev Davies | 503 | 62.6 | ||
Conservative | Toby Jones | 243 | 30.3 | ||
Liberal Democrats | Shopon Chowdhury | 57 | 7.1 | ||
Majority | |||||
Turnout | 33.6 | ||||
Labour win (new seat) |
Party | Candidate | Votes | % | ||
---|---|---|---|---|---|
Conservative | Chris Reeks | 667 | 54.9 | ||
Labour | Jonathan Gibbons | 548 | 45.1 | ||
Majority | |||||
Turnout | 51.2 | ||||
Conservative win (new seat) |
Party | Candidate | Votes | % | ||
---|---|---|---|---|---|
Labour | Yvonne Forsey | 1,133 | 68.3 | ||
Labour | John Reynolds | 916 | 55.2 | ||
Conservative | Andrew Hill | 532 | 32.0 | ||
Conservative | Graham Berry | 530 | 31.9 | ||
Liberal Democrats | Liz Newton | 209 | 12.6 | ||
Turnout | 31.5 | ||||
Labour win (new seat) | |||||
Labour win (new seat) |
Forsey had been one of the sitting councillors in the former Rogerstone ward.
Party | Candidate | Votes | % | ±% | |
---|---|---|---|---|---|
Labour | Paul Cockeram * | 503 | 44.3 | ||
Green | Lauren James | 475 | 41.9 | ||
Labour | Nicky Vignoli | 401 | 35.3 | ||
Green | Tanya Sinnett | 358 | 31.5 | ||
Conservative | Judy Gilligan | 205 | 18.1 | ||
Conservative | Khushbir Bhullar | 167 | 14.7 | ||
Newport Ind. | Rhys Richards | 161 | 14.2 | ||
Turnout | 31.9 | ||||
Labour hold | |||||
Green gain from Labour |
James became Newport's first ever Green Party councillor. [3]
Party | Candidate | Votes | % | ±% | |
---|---|---|---|---|---|
Labour | Paul Bright | 1,004 | 48.8 | ||
Labour | Phil Hourahine * | 963 | 46.8 | ||
Liberal Democrats | Carmel Townsend * | 898 | 43.7 | ||
Labour | Asum Mahmood | 844 | 41.0 | ||
Liberal Democrats | Mike Hamilton | 726 | 35.3 | ||
Liberal Democrats | Oliver Townsend | 718 | 34.9 | ||
Conservative | Michael Enea | 418 | 20.3 | ||
Conservative | Marie Jermyn | 338 | 16.4 | ||
Conservative | Muhammad Tariq | 262 | 12.7 | ||
Turnout | 34.5 | ||||
Labour gain from Liberal Democrats | |||||
Labour hold | |||||
Liberal Democrats hold |
Party | Candidate | Votes | % | ±% | |
---|---|---|---|---|---|
Labour | Kate Thomas * | 879 | 67.9 | ||
Labour | Miqdad Al-Nuaimi * | 804 | 62.1 | ||
Conservative | Saleh Baqi | 366 | 28.3 | ||
Newport Ind. | Nick Baneswell | 305 | 23.6 | ||
Conservative | Ben Jones | 234 | 18.1 | ||
Turnout | 31.2 | ||||
Labour hold | |||||
Labour hold |
Party | Candidate | Votes | % | ||
---|---|---|---|---|---|
Labour | Thian Howells | 1,148 | 54.4 | ||
Labour | Allan Screen | 993 | 47.1 | ||
Labour | Trevor Watkins | 917 | 43.5 | ||
Conservative | Sarah Nurse | 855 | 40.5 | ||
Conservative | Wayne Cresswell | 846 | 40.1 | ||
Conservative | Brian Miles | 846 | 40.1 | ||
Green | Catherine Linstrum | 440 | 20.9 | ||
Propel | Celia Jones | 156 | 7.4 | ||
Propel | Shane Williams | 125 | 5.9 | ||
Turnout | 28.5 | ||||
Labour win (new seat) | |||||
Labour win (new seat) |
Watkins had been the sitting councillor for the former Tredegar Park ward.
Party | Candidate | Votes | % | ±% | |
---|---|---|---|---|---|
Labour | Gavin Horton * | 982 | 54.4 | ||
Labour | Farzina Hussain * | 933 | 51.7 | ||
Conservative | Bilal Meah | 449 | 24.9 | ||
Conservative | Faisal Rahman | 426 | 23.6 | ||
Liberal Democrats | John Miller | 350 | 19.4 | ||
Liberal Democrats | Nurul Islam | 293 | 16.2 | ||
Newport Ind. | Annette Farmer | 179 | 9.9 | ||
Turnout | 34.3 | ||||
Labour hold | |||||
Labour hold |
Horton and Hussain had won seats in this ward at two separate by-elections in 2021.
Newport is a city and county borough in Wales, situated on the River Usk close to its confluence with the Severn Estuary, 12 miles northeast of Cardiff. With a population of 145,700 at the 2011 census, Newport is the third-largest authority with city status in Wales, and seventh most populous overall. Newport became a unitary authority in 1996 and forms part of the Cardiff-Newport metropolitan area. Newport was the site of the last large-scale armed insurrection in Great Britain, the Newport Rising of 1839.
Newport East is a constituency in the city of Newport, South Wales, represented in the House of Commons of the UK Parliament since 2005 by Jessica Morden of the Labour Party.
Ringland is both a community and electoral ward of the city of Newport, South Wales.
Rogerstone is a large village and community (parish) in Newport, Wales. The area is governed by Newport City Council. The village falls within the ancient parish of Bassaleg and historic county of Monmouthshire.
Marshfield is a village and community of Newport, Wales. The village sits approximately 5 miles southwest of Newport, and 7 miles northeast of Cardiff. The area is governed by Newport City Council.
Langstone is a community and village of the city of Newport, Wales. The area is governed by the Newport City Council. The community had a population of 3,279 in 2011.
Llanwern is a community in the eastern part of the City of Newport, South East Wales. Llanwern is bounded by the M4 and Langstone to the north, Ringland, Lliswerry and the River Usk to the west, the River Severn to the south and the city boundary to the east. The population of the Llanwern community in 2011 was 333). which contains Llanwern village and the western half of the site of Llanwern steelworks. The area is governed by the Newport City Council. The community population dropped to 289 in 2011. The community also includes the area of Glan Llyn.
Blaenau Gwent County Borough Council is the governing body for Blaenau Gwent, one of the Principal Areas of Wales.
Tredegar Park is a community of the city of Newport. It is named after the nearby park, although the community covers a much smaller area.
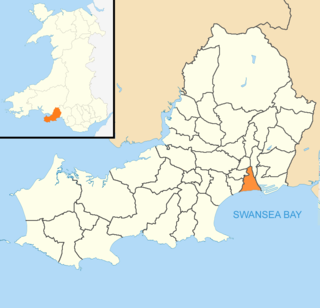
Castle is an electoral ward and community in the City and County of Swansea, Wales, UK. Castle covers most of the heart of the City of Swansea, with Swansea Castle at its centre.
Grangetown is an electoral ward in the city of Cardiff, Wales. It covers its namesake community of Grangetown. The ward was originally created in 1890 as a ward to Cardiff County Borough Council.
The Newport Independents Party is a small political party formed in 2017 to campaign in the city of Newport, Wales. The party won four council seats on Newport City Council in May 2017.
Elections to Newport City Council were held on 3 May 2017 along with elections to the other 21 local authorities in Wales, community council elections in Wales and 2017 United Kingdom local elections.
The 1973 Gwent County Council election was held on Thursday 12 April 1973 to elect councillors to the new Gwent County Council, governing the new county of Gwent, Wales. It took place on the same day as other county council elections in the United Kingdom.
The 2022 Cardiff Council election took place on 5 May 2022 to elect 79 members to Cardiff Council. On the same day, elections were held to the other 21 local authorities and to community councils in Wales as part of the 2022 Welsh local elections. The previous Cardiff all-council election took place in May 2017 and future elections will take place every five years.
The 2022 Carmarthenshire County Council election took place on Thursday 5 May 2022 to elect 75 members to Carmarthenshire Council. On the same day, elections were held to the other 21 local authorities and to community councils in Wales as part of the 2022 Welsh local elections.
An election to City and County of Swansea Council took place on 5 May 2022 as part of the 2022 Welsh local elections. Seventy five seats were up for election across 32 wards. The previous full election took place in 2017.
Tredegar Park and Marshfield is an electoral ward for Newport City Council in south Wales. It was created in 2022 by combining the former wards of Tredegar Park and Marshfield. It is represented by three city councillors.
Llanwern is the name of an electoral ward for Newport City Council in south Wales. It covers several rural communities to the east of the city. It is represented by one city councillor.