2018 Haringey London Borough Council election

Last updated

2018 Haringey Council election
  2014 3 May 2018 2022  

All 57 seats on Haringey London Borough Council
 First partySecond party
  No image wide.svg No image wide.svg
LeaderJoseph EjioforLiz Morris
Party Labour Liberal Democrats
Leader since20182018
Leader's seatBruce GroveHighgate
Last election48 seats, 50.1%9 seats, 19.9%
Seats won4215
Seat changeDecrease2.svg6Increase2.svg6
Popular vote112,98047,137
Percentage57.3%23.9%
SwingIncrease2.svg7.2%Increase2.svg3.1%

Haringey London UK local election 2018 map.svg
Map of the results of the 2018 Haringey council election. Labour in red and Liberal Democrats in yellow.

Council control before election


Labour

Council control after election


Labour

The 2018 Haringey Council election took place on 3 May 2018 to elect members of Haringey Council in England. This was on the same day as other local elections.

Contents

Summary of results

Haringey Council election result 2018
PartySeatsGainsLossesNet gain/lossSeats %Votes %Votes+/−
  Labour 4206-673.757.3112,980+7.2
  Liberal Democrats 1560+626.323.947,137+3.1
  Green 0---010.420,409-5.0
  Conservative 0---07.815,335-2.1
  TUSC 0---00.2372-2.0
  Independent 0---00.1287-0.5
  Duma Polska 0---00.1195New
  Democrats and Veterans 0---00.1133New
  English Democrat 0---00.087New
  CPA 0---00.067New
 Federalist Party0---00.044New

Ward results

Voting results sourced from Haringey Votes. [1]

Alexandra

Alexandra (3)
PartyCandidateVotes%±%
Liberal Democrats Nick Da Costa 2,028 44.7 +13.4
Liberal Democrats Alessandra Rossetti 1,987 43.8 +13.5
Liberal Democrats Josh Dixon 1,918 42.3 +12.8
Labour Nikki Pound1,78539.4+5.4
Labour Liz McShane*1,74938.6+3.4
Labour Sean O'Donovan1,65836.6+6.2
Green Jeremy Green4449.8-18.7
Green Claire Valerie Lewis4038.9-14.1
Conservative Kay Carter3487.7-3.3
Conservative David Douglas3217.1-5.0
Green Ben Levitas3167.0-14.9
Conservative Daphne Forrest2736.0-3.9
Turnout 4,54854.69+6.31
Liberal Democrats gain from Labour Swing
Liberal Democrats hold Swing

Bounds Green

Bounds Green (3)
PartyCandidateVotes%±%
Labour Pat Berryman** 2,289 62.7 +9.5
Labour Yvonne Say 2,188 60.0 +6.9
Labour James Chiriyankandath 2,126 58.3 +9.6
Liberal Democrats David Morgan Beacham**71019.5-5.5
Liberal Democrats Indijana Harper62317.1-4.5
Liberal Democrats John Fynaut57915.9-5.5
Green Francesca Box50613.9+0.6
Conservative David Sheen3228.8+1.9
Green Mike Shaughnessy3038.3-2.8
Conservative James Wild3008.2+2.1
Green Kenneth John Burlton2827.7-3.4
Conservative Bhaskar Mitra2757.5+2.0
Turnout 3,66038.73+0.93
Labour hold Swing
Labour hold Swing
Labour hold Swing

Pat Berryman was a sitting councillor in Fortis Green ward

David Beacham was a sitting councillor in Alexandra ward

Bruce Grove

Bruce Grove (3)
PartyCandidateVotes%±%
Labour Felicia Opoku* 2,031 69.4 +13.5
Labour Joseph Ejiofor* 1,988 67.9 +10.2
Labour Matthew White 1,949 66.6 +5.2
Green Lucy Craig39713.6-4.3
Green Raymundo Abadinas Obedencio35312.1-2.7
Conservative Charles Everett2699.2-1.5
Conservative Roger Edward Bradley2669.1+0.3
Green Eric Haydon Bateson2588.8-5.0
Liberal Democrats Lydia Hirst2548.7+2.0
Conservative Simon Hall2488.5+0.3
Liberal Democrats Adam Perry1866.4+0.8
Liberal Democrats Paul Negus1735.9+1.0
Turnout 2,94031.35+0.89
Labour hold Swing
Labour hold Swing
Labour hold Swing

Crouch End

Crouch End (3)
PartyCandidateVotes%±%
Liberal Democrats Dawn Barnes 2,200 48.5 +16.4
Liberal Democrats Luke Cawley-Harrison 2,101 46.3 +20.0
Liberal Democrats Tammy Palmer 1,920 42.3 +16.0
Labour Charley Allan1,70037.5+2.8
Labour Annette Baker1,66036.6+2.3
Labour Will Armston-Sheret1,61735.7+5.8
Green Rachel Aveyard51711.4-9.1
Green Greta Sykes3938.7-8.2
Green David Norwood3337.3-8.4
Conservative Lucy Clark3076.8-3.2
Conservative Chris Clark2966.5-3.0
Conservative Julian Sherwood2756.1-5.0
Turnout 4,54348.93+5.15
Liberal Democrats gain from Labour Swing
Liberal Democrats hold Swing

Fortis Green

Fortis Green (3)
PartyCandidateVotes%±%
Liberal Democrats Viv Ross* 2,078 47.7 +13.2
Liberal Democrats Sakina Chenot 1,989 45.7 +8.9
Liberal Democrats Justin Hinchcliffe 1,939 44.5 +14.4
Labour Anna Lawton1,70239.1+6.5
Labour Marta Garcia de la Vega1,56636.0+4.6
Labour Jessica Tabois1,48634.1+3.7
Green Nancy Hocking44110.1-6.2
Conservative Helen Egford3407.8-5.4
Conservative Kay Curtis3207.3-4.6
Conservative Loretta Mahmud3197.3-4.5
Green Nadja von Massow2906.7-6.5
Green Malcolm Powell2585.9-9.0
Turnout 4,36848.29+5.88
Liberal Democrats hold Swing
Liberal Democrats gain from Labour Swing

Harringay

Harringay (3)
PartyCandidateVotes%±%
Labour Gina Adamou* 2,144 57.9 +12.2
Labour Sarah James 2,007 54.2 +16.4
Labour Zena Brabazon* 1,989 53.7 +16.5
Liberal Democrats Karen Alexander1,10529.8-2.3
Liberal Democrats David Schmitz99927.0-3.9
Liberal Democrats Matthew Cuthbert89724.2+0.4
Green Rejane Cadorel39110.6-7.2
Green Jon Sen3479.4-5.7
Green Tristan James Law Smith3208.6-6.9
Conservative Christopher Alan Lane1664.5-1.4
Conservative John James Morgan1544.2-1.6
Conservative Demetrios Panayi Savvides1403.8-1.6
Duma PolskaRegina Roszczynska581.6N/A
Duma PolskaPawel Rafal Lemanowicz531.4N/A
Turnout 3,71542.01+1.49
Labour hold Swing
Labour hold Swing
Labour hold Swing

Highgate

Highgate (3)
PartyCandidateVotes%±%
Liberal Democrats Liz Morris* 2,041 54.7 +16.9
Liberal Democrats Bob Hare* 1,951 52.3 +18.4
Liberal Democrats Paul Dennison 1,844 49.5 +18.1
Labour Jean Brown1,13730.5+1.7
Labour Gareth Morgan1,01127.1+1.7
Labour Mark Streather99926.8+3.1
Conservative William MacDougall41211.0-13.6
Conservative Tom Waterton-Smith3699.9-14.4
Green Linda Christine Leroy3509.4-5.5
Conservative Kieran Marriott3298.8-14.1
Green Izzy Rogers3038.1-3.5
Green Alex Rendall2105.6-5.6
Turnout 3,73644.94+1.23
Liberal Democrats hold Swing

Hornsey

Hornsey (3)
PartyCandidateVotes%±%
Labour Adam Jogee* 2,451 61.3 +13.7
Labour Dana Carlin 2,447 61.2 +15.5
Labour Elin Weston* 2,304 57.6 +13.0
Liberal Democrats Gillian Kilby89222.3-6.0
Liberal Democrats Jim Jenks78519.6-11.3
Liberal Democrats Paul Secher68717.2-12.2
Green Mary Bridget Hogan49612.4-1.5
Green Peter Budge41410.4-2.3
Green Culann Walsh3348.4-2.4
Conservative Guy Thomas Carter2847.1+1.1
Conservative Peter James Forrest2656.6+1.7
Conservative Peter Gilbert2506.3+1.8
Turnout 4,00442.88-1.89
Labour hold Swing
Labour hold Swing
Labour hold Swing

Muswell Hill

Muswell Hill (3)
PartyCandidateVotes%±%
Liberal Democrats Pippa Connor* 2,130 48.5 +10.1
Liberal Democrats Scott Emery 1,956 44.6 +6.6
Liberal Democrats Julia Ogiehor 1,944 44.3 +8.7
Labour Co-op Emma Whysall1,69538.6+5.4
Labour Co-op Frank Hobson1,64837.6+0.6
Labour Co-op Peter Chalk1,60036.5+5.4
Green Jacqueline Lesley Ashworth44010.0-6.1
Green Joyce Eileen Rosser4019.1-7.6
Green Sam Hall3718.5-7.1
Conservative Rod Allen2605.9-5.3
Conservative Catherine MacDougall2465.6-3.9
Conservative Laurence Frederick Pearce2325.3-3.7
Turnout 4,39653.49+4.64
Liberal Democrats hold Swing
Liberal Democrats gain from Labour Swing

Noel Park

Noel Park (3)
PartyCandidateVotes%±%
Labour Peray Ahmet* 1,938 64.6 +5.2
Labour Emine Ibrahim** 1,906 63.5 +6.9
Labour Khaled Moyeed 1,765 58.8 +3.0
Liberal Democrats Pamela Jane Willis46715.6+0.1
Liberal Democrats John Harper46015.3-0.1
Liberal Democrats Derin Adebiyi43514.5+0.8
Green Victoria Violet McGregor Elliott35011.7-4.1
Conservative Mike Burgess2949.8+3.1
Green Mike McGowan2949.8-0.6
Conservative Valerie Margaret Clayton2478.2+1.6
Green Jordan William Rapaport2147.1-2.6
Conservative Edward McRandal1926.4+1.3
Turnout 3,01332.62-0.98
Labour hold Swing
Labour hold Swing
Labour hold Swing

Emine Ibrahim was a sitting councillor in Harringay ward

Northumberland Park

Northumberland Park (3)
PartyCandidateVotes%±%
Labour John Bevan* 2,188 78.5 +16.9
Labour Kaushika Amin* 2,098 75.3 +13.5
Labour Sheila Peacock* 2,036 73.1 +6.7
Conservative Baran Yazgili1736.2-2.0
Green Joanne Louise Fry1706.1-4.4
Conservative Massimo Rossi1666.0-0.8
Conservative Eva Ostrowski1625.8-0.5
Green Emily Sarah Darko1565.6-0.5
Green Kenneth Alcuin Insull Edwards1495.3-0.6
Liberal Democrats Clive David Carter**1475.3+0.7
Liberal Democrats Valerie Mortimer1103.9-0.7
Liberal Democrats Brian Haley1073.8+0.5
English Democrat Janus Polenceusz461.7N/A
English Democrat Max Spencer411.5N/A
Turnout 2,79329.98-2.01
Labour hold Swing
Labour hold Swing
Labour hold Swing

Clive Carter was a sitting councillor in Highgate ward

Seven Sisters

Seven Sisters (3)
PartyCandidateVotes%±%
Labour Barbara Blake** 2,306 68.0 +9.7
Labour Dhiren Basu* 2,225 65.6 +6.9
Labour Erdal Dogan 2,121 62.5 +4.7
Conservative Anna Karolina Piasecka44113.0+1.1
Conservative Stephen Michael Noble42912.6+1.5
Conservative Brian Albert Ronald Fox40011.8+1.5
Green David Bennie39911.8-4.8
Green Desmond Patrick Gilmartin2878.5-5.9
Green Ronald Andrew Stewart2728.0-5.0
Liberal Democrats Pauline Wearden1554.6-0.4
Liberal Democrats Richard Siemicki1514.5+0.3
TUSC Karen Tate1303.8-3.0
TUSC Nick Auvache1243.6-1.3
Liberal Democrats Joshua Ariel Weinstein1193.5+0.6
TUSC David Kaplan1183.5N/A
Turnout 3,41131.76-5.21
Labour hold Swing
Labour hold Swing
Labour hold Swing

Barbara Blake was a sitting councillor for St Ann's ward.

St Ann's

St Ann's (3)
PartyCandidateVotes%±%
Labour Julie Davis 2,042 63.5 +5.0
Labour Mike Hakata 1,756 54.6 +6.4
Labour Noah Tucker* 1,752 54.5 +6.8
Green Ann Clark92428.7+4.5
Green Jarelle Andrae Francis80124.9+8.0
Green Lee Paul Jerome70421.9+6.0
Conservative Catherine Ann Mary El Gamry2307.2-0.8
Liberal Democrats Mark Alexander2076.4-1.4
Liberal Democrats Sara Beynon2036.3-0.6
Conservative Daniel Niall El Gamry2036.3+0.1
Conservative Caesar Lalobo1645.1-0.5
Liberal Democrats Adrian Woodhead1384.3-2.4
Independent Andrew Nigel Reid1203.7-3.8
Turnout 3,22634.59+2.09
Labour hold Swing
Labour hold Swing
Labour hold Swing

Stroud Green

Stroud Green (3)
PartyCandidateVotes%±%
Labour Kirsten Hearn* 2,431 58.5 +15.9
Labour Eldridge Culverwell 2,378 57.2 +14.7
Labour Daniel Stone 2,126 51.2 +15.1
Liberal Democrats Elizabeth Payne1,00324.1-7.6
Liberal Democrats Jeremy Cunnington97723.5-6.6
Liberal Democrats Alexander Sweet92222.2-7.5
Green Melissa Jane Guest68516.5-3.2
Green Jack Callen56013.5-4.0
Green Alfred Jahn3538.5-8.3
Conservative Vicki Carver2425.8±0.0
Conservative Suraj Bhanot2285.5±0.0
Conservative Mark Andrew Wills2245.4-0.1
CPA Helen Spiby-Vann671.6N/A
Turnout 4,17546.64+0.79
Labour hold Swing
Labour hold Swing
Labour hold Swing

Tottenham Green

Tottenham Green (3)
PartyCandidateVotes%±%
Labour Isidoros Diakides* 2,432 72.7 +14.8
Labour Makbule Gunes* 2,342 70.0 +12.5
Labour Preston Tabois 2,306 69.0 +13.3
Green Cecily Hope Spelling43112.9-6.7
Green Rosa Nerine Fass42012.6-4.9
Conservative Daniel Babis2668.0-3.2
Conservative Jeannette Pinnock2417.2-1.1
Liberal Democrats Henry Fisher2347.0+0.1
Green Eva Martina Weitsch2316.9-6.6
Liberal Democrats Elena Sandrini2286.8+1.4
Conservative Matt Jama2146.4-0.6
Liberal Democrats Nigel Scott1775.3+0.2
Federalist Alex Gunter441.3N/A
Turnout 3,35131.31-0.59
Labour hold Swing
Labour hold Swing
Labour hold Swing

Tottenham Hale

Tottenham Hale (3)
PartyCandidateVotes%±%
Labour Ruth Gordon 2,605 77.1 +7.6
Labour Vincent Carroll* 2,472 73.2 +5.5
Labour Reg Rice* 2,347 69.5 +6.7
Conservative Christine Sampson Allicock3169.4-1.0
Conservative Mike Moss2908.6-1.3
Green David Bryan Newbury2828.3-6.8
Green Thomas Spencer2687.9-2.7
Conservative Hammad Mirza Baig2507.4-0.7
Green Elizabeth Clare Scurfield2266.7-2.6
Liberal Democrats Georgia May1965.8-0.3
Liberal Democrats Matthew Amos1955.8±0.0
Liberal Democrats Samuel Payne1444.3-0.9
Duma PolskaDorota Lopatynska-de-Slepowron842.5N/A
Turnout 3,39130.87-0.96
Labour hold Swing
Labour hold Swing
Labour hold Swing

West Green

West Green (3)
PartyCandidateVotes%±%
Labour Mahir Demir 2,077 66.6 +8.6
Labour Sarah Williams 2,072 66.5 +8.8
Labour Ishmael Osamor 1,899 60.9 +5.6
Green Hero Eliza Bennett43714.0-0.8
Conservative Sharon Sarah Cronin2929.4-3.1
Liberal Democrats Katherine Hamilton2778.9+1.1
Green Mike King2728.7-3.1
Green George Pearson Mackie2708.7-1.9
Conservative Benjamin Woodhead2668.5-2.1
Liberal Democrats Will Chan2548.1+1.1
Conservative Mitty Ragnuth2317.4-2.0
Liberal Democrats Thibaud Emmanuel Remi Lecluse2147.4+1.6
Independent Michael Opoku-Brobbey1675.4N/A
Turnout 3,13738.73+4.99
Labour hold Swing
Labour hold Swing
Labour hold Swing

White Hart Lane

White Hart Lane (3)
PartyCandidateVotes%±%
Labour Charles Adje* 2,094 75.1 +15.4
Labour Gideon Bull* 2,074 74.4 +11.3
Labour Anne Stennett* 1,981 71.0 +18.9
Conservative Margaret Annie Bradley32411.6+1.3
Conservative Hazel Christina Stokes2559.1-0.7
Conservative Neil Edmund O'Shea2468.8-0.6
Green Pamela Jean Harling1997.1-0.8
Green Friedrich Paul Ernst1776.3-2.9
Green Dennis Richard Bury1555.6-0.5
Liberal Democrats Paul Head1124.0-3.5
Liberal Democrats Jean-Philippe Chenot1093.9-1.8
Liberal Democrats Cara Jenkinson1003.6-1.0
Democrats and Veterans Neville Watson311.1N/A
Turnout 2,79531.01-1.88
Labour hold Swing
Labour hold Swing
Labour hold Swing

Woodside

Woodside (3)
PartyCandidateVotes%±%
Labour Peter Mitchell* 2,122 64.3 +2.6
Labour Mark Blake** 2,106 63.8 +4.3
Labour Lucia das Neves 2,057 62.3 +5.3
Liberal Democrats Petros Christoforou50215.2+2.4
Liberal Democrats Angela Kawa45213.7+1.7
Liberal Democrats Paul Strang42612.9+1.9
Green Ursula Katharina Bury3149.5-2.9
Green Michael Victor Cordwell James3059.2-1.2
Conservative Reece Fox2778.4+0.1
Conservative John Rupert Sparrow2497.5±0.0
Conservative Padmanie Lawtoo2377.2+0.9
Green Ivana Curcic2337.1-0.7
Democrats and Veterans Andrew Price451.4N/A
Democrats and Veterans Cristian Scirocco290.9N/A
Democrats and Veterans Ruth Price280.8N/A
Turnout 3,31235.65+0.15
Labour hold Swing
Labour hold Swing
Labour hold Swing

Mark Blake was a sitting councillor in Muswell Hill ward

By-elections

A by-election was held in West Green ward on 13 December 2018 following the resignation of Ishmael Osamor.

West Green
PartyCandidateVotes%±%
Labour Seema Chandwani 1,273 56.6 -4.3
Liberal Democrats Elizabeth Payne62127.6+18.7
Green Cecily Spelling24310.8-3.2
Conservative Hammad Baig1145.1-4.3
Majority65229.0
Turnout 2,25824.6-14.1
Labour hold Swing

Related Research Articles

<span class="mw-page-title-main">London Borough of Haringey</span> London borough in United Kingdom

The London Borough of Haringey is a London borough in North London, classified by some definitions as part of Inner London, and by others as part of Outer London. It was created in 1965 by the amalgamation of three former boroughs. It shares borders with six other London boroughs. Clockwise from the north, they are: Enfield, Waltham Forest, Hackney, Islington, Camden, and Barnet.

<span class="mw-page-title-main">Haringey London Borough Council elections</span>

Haringey London Borough Council is the local authority for the London Borough of Haringey in London, England. The council is elected every four years.

<span class="mw-page-title-main">2010 Southwark London Borough Council election</span>

Elections for Southwark Council were held on 6 May 2010. The 2010 General Election and other local elections took place on the same day.

<span class="mw-page-title-main">2010 Haringey London Borough Council election</span> Council election in London


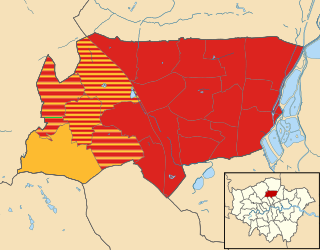
Elections for Haringey Council in London, England were held on 6 May 2010.

<span class="mw-page-title-main">2006 Haringey London Borough Council election</span> 2006 local election in England

Elections to Haringey Council were held on 4 May 2006. The whole council was up for election for the first time since the 2002 election.

The 1964 Haringey Council election took place on 7 May 1964 to elect members of Haringey London Borough Council in London, England. The whole council was up for election and the Labour party gained control of the council.

The 1968 Haringey Council election took place on 9 May 1968 to elect members of Haringey London Borough Council in London, England. The whole council was up for election and the Conservative party gained overall control of the council.

The 1974 Haringey Council election took place on 2 May 1974 to elect members of Haringey London Borough Council in London, England. The whole council was up for election and the Labour party stayed in overall control of the council.

The 1971 Haringey Council election took place on 13 May 1971 to elect members of Haringey London Borough Council in London, England. The whole council was up for election and the Labour party gained overall control of the council.

The 1998 Haringey Council election took place on 7 May 1998 to elect members of Haringey London Borough Council in London, England. The whole council was up for election and the Labour party stayed in overall control of the council.

The 1994 Haringey Council election took place on 5 May 1994 to elect members of Haringey London Borough Council in London, England. The whole council was up for election and the Labour party stayed in overall control of the council.

The 1990 Haringey Council election took place on 3 May 1990 to elect members of Haringey London Borough Council in London, England. The whole council was up for election and the Labour party stayed in overall control of the council.

The 1986 Haringey Council election took place on 8 May 1986 to elect members of Haringey London Borough Council in London, England. The whole council was up for election and the Labour party retained overall control of the council.

The 1982 Haringey Council election took place on 6 May 1982 to elect members of Haringey London Borough Council in London, England. The whole council was up for election and the Labour party stayed in overall control of the council.

<span class="mw-page-title-main">2018 London local elections</span>

The 2018 London local elections took place in London on 3 May 2018 as part of wider local elections in England. All London borough councillor seats were up for election. Elections to the Corporation of London were held in 2017. Mayoral contests were also held in Hackney, Lewisham, Newham and Tower Hamlets. The previous London borough elections were in 2014.

<span class="mw-page-title-main">2018 Cannock Chase District Council election</span>

Elections to Cannock Chase District Council took place on 3 May 2018 on the same day as other local elections in England. A third of the council was up for election, meaning a total of 13 councillors were elected from all but two of the council's wards.

<span class="mw-page-title-main">2019 Cannock Chase District Council election</span>

Elections to Cannock Chase District Council took place on 2 May 2019 on the same day as other local elections in England, including to several parish councils in the district. All of the council's wards were up for election, meaning a total of 15 councillors were elected.

<span class="mw-page-title-main">2021 Sheffield City Council election</span>

The 2021 Sheffield City Council election took place on 6 May 2021 to elect members of Sheffield City Council in England, as part of the nationwide local elections. The election was originally due to take place on 7 May 2020, but was postponed due to the COVID-19 pandemic. One seat from each ward was up for election.

<span class="mw-page-title-main">2022 Haringey London Borough Council election</span> 2022 local election in Haringey

The 2022 Haringey London Borough Council election took place on 5 May 2022. All 57 members of Haringey London Borough Council were elected. The elections took place alongside local elections in the other London boroughs and elections to local authorities across the United Kingdom.

<span class="mw-page-title-main">2022 Lambeth London Borough Council election</span>

The 2022 Lambeth London Borough Council election took place on 5 May 2022. All 63 members of Lambeth London Borough Council were elected. The elections took place alongside local elections in the other London boroughs and elections to local authorities across the United Kingdom.

References

  1. "Haringey votes - Haringey Elections website". voting.haringey.gov.uk. Retrieved 8 May 2018.