| |||||||||||||||||||||||||||||||||||||||||||||||||||||||||||||
All 57 council seats on Merton London Borough Council | |||||||||||||||||||||||||||||||||||||||||||||||||||||||||||||
---|---|---|---|---|---|---|---|---|---|---|---|---|---|---|---|---|---|---|---|---|---|---|---|---|---|---|---|---|---|---|---|---|---|---|---|---|---|---|---|---|---|---|---|---|---|---|---|---|---|---|---|---|---|---|---|---|---|---|---|---|---|
Turnout | 49.5% (4.2%) [1] [2] | ||||||||||||||||||||||||||||||||||||||||||||||||||||||||||||
| |||||||||||||||||||||||||||||||||||||||||||||||||||||||||||||
|
Elections for the London Borough of Merton were held on 5 May 1994 to elect members of Merton London Borough Council in London, England. This was on the same day as other local elections in England. [4]
The whole council was up for election. As a result of changes in authority boundaries between Merton, Lambeth and Wandsworth, there were some minor ward boundary changes. [5]
The Labour Party maintained its majority control of the council, increasing its majority from one seat to eleven seats. [6]
This was the first election in which the Liberal Democrats gained seats in Merton, winning all three seats on the ward of West Barnes from the Conservatives. [7] The Liberal Democrats had not stood in the ward in the last election, [2] and their predecessors, the SDP-Liberal Alliance, came last in the ward in the 1986 election, behind the Conservatives and Labour. [8]
This was also the last election which was contested by the Longthornton and Tamworth Residents Association, which lost two seats to Labour and whose only elected councillor no longer sat for the party by the time of the 1998 election. [6]
Party | Seats | Gains | Losses | Net gain/loss | Seats % | Votes % | Votes | +/− | |
---|---|---|---|---|---|---|---|---|---|
Labour | 40 | 11 | 0 | 11 | 70.2% | 50.3% | 82,294 | 8.1% | |
Conservative | 10 | 0 | 12 | 12 | 17.5% | 31.3% | 51,153 | 10.0% | |
Liberal Democrats | 3 | 3 | 0 | 3 | 5.3% | 12.5% | 20,540 | 6.0% | |
Merton Park Residents | 3 | 0 | 0 | 0 | 5.3% | 3.6% | 5,860 | 0.5% | |
Longthornton and Tamworth Residents | 1 | 0 | 2 | 2 | 1.8% | 2.6% | 4,308 | 0.5% | |
Green | 0 | 0 | 0 | 0 | 0 | 2.6% | 4,177 | 0.2% | |
Independent | 0 | 0 | 0 | 0 | 0 | 0.6 | 914 | n/a | |
West Barnes Independent Residents | 0 | 0 | 0 | 0 | 0 | 0.2 | 286 | 1.3% | |
Monster Raving Loony | 0 | 0 | 0 | 0 | 0 | 0.0 | 63 | n/a |
Party | Candidate | Votes | % | ±% | |
---|---|---|---|---|---|
Labour | Maria Dingwall | 1,717 | 52.6 | +2.8 | |
Labour | Susan Assinen | 1,643 | 50.4 | +3.5 | |
Labour | Adrian Holt | 1,582 | 48.5 | +2.9 | |
Conservative | Anne Bottell | 820 | 25.1 | -9.1 | |
Conservative | Margaret Connon | 795 | 24.4 | -9.3 | |
Conservative | Philip Thorley | 761 | 23.3 | -8.1 | |
Green | Jacqueline Barrow | 589 | 18.1 | +9.1 | |
Liberal Democrats | Elizabeth Barker | 382 | 11.7 | +0.7 | |
Liberal Democrats | Gail Moss | 331 | 10.1 | +1.2 | |
Liberal Democrats | Julian Rudd | 257 | 7.9 | -0.7 | |
Independent | Monowara Ahmad | 108 | 3.3 | N/A | |
Independent | Grace Giddins | 97 | 3.0 | +0.9 | |
Independent | Muhammad Rahman | 80 | 2.5 | N/A | |
Independent | Abdul Kalam | 76 | 2.3 | N/A | |
Turnout | 3,267 | 47.0 | -4.4 | ||
Labour hold | Swing | ||||
Party | Candidate | Votes | % | ±% | |
---|---|---|---|---|---|
Labour | Michael Mannion | 1,631 | 46.0 | +9.6 | |
Labour | Charles Lucas | 1,611 | 45.5 | +9.2 | |
Labour | Brian White | 1,608 | 45.4 | +10.7 | |
Conservative | Thelma Earnshaw* | 1,195 | 33.7 | -14.0 | |
Conservative | Joan Pethen* | 1,146 | 32.3 | -14.9 | |
Conservative | Pauline Blythe | 1,130 | 31.9 | -14.1 | |
Liberal Democrats | Peter Larkin | 556 | 15.7 | +1.6 | |
Liberal Democrats | Anne-Marie Anderson | 533 | 15.0 | +2.3 | |
Liberal Democrats | George Senior | 502 | 14.2 | +1.9 | |
Green | Justin Craig | 185 | 5.2 | N/A | |
Turnout | 3,547 | 53.5 | -6.2 | ||
Labour gain from Conservative | Swing | ||||
Party | Candidate | Votes | % | ±% | |
---|---|---|---|---|---|
Labour | Siobhain McDonagh* | 2,202 | 64.3 | +3.2 | |
Labour | Sheila Knight* | 1,945 | 56.8 | +2.9 | |
Labour | Reginald Flegg* | 1,901 | 55.5 | +5.7 | |
Green | Thomas Walsh | 896 | 26.2 | +5.7 | |
Conservative | Christopher Grayling | 568 | 16.6 | -10.5 | |
Conservative | Margaret Ali | 554 | 16.2 | -9.4 | |
Conservative | Shamima Hardcastle | 486 | 14.2 | -7.1 | |
Liberal Democrats | Malcolm Geldart | 417 | 12.2 | N/A | |
Turnout | 3,434 | 45.3 | -0.5 | ||
Labour hold | Swing | ||||
Party | Candidate | Votes | % | ±% | |
---|---|---|---|---|---|
Labour | Michael Brunt* | 1,822 | 53.1 | +11.5 | |
Labour | Stephen Blann | 1,808 | 52.7 | +7.5 | |
Labour | John Pickover | 1,599 | 46.6 | +8.9 | |
Conservative | John Elvidge* | 1,045 | 30.4 | -8.7 | |
Conservative | Samantha George | 996 | 29.0 | -8.1 | |
Conservative | Robert Greenly | 953 | 27.8 | -7.2 | |
Liberal Democrats | Matthew Griffiths | 440 | 12.8 | +3.1 | |
Liberal Democrats | Richard Ladmore | 420 | 12.2 | +2.2 | |
Liberal Democrats | Graham Stone | 390 | 11.4 | +1.7 | |
Green | Christina Langley | 356 | 10.4 | -7.2 | |
Turnout | 3,437 | 56.0 | -3.7 | ||
Labour hold | Swing | ||||
Labour gain from Conservative | Swing | ||||
Party | Candidate | Votes | % | ±% | |
---|---|---|---|---|---|
Labour | Arthur Kennedy | 1,055 | 45.0 | +7.3 | |
Labour | Kevin Beale | 1,027 | 43.8 | +8.6 | |
Conservative | Robert Clark | 824 | 35.1 | -8.8 | |
Conservative | Jean Fortescue | 824 | 35.1 | -8.2 | |
Liberal Democrats | Philip Rumney | 318 | 13.6 | +3.5 | |
Liberal Democrats | Barry Fairbank | 303 | 12.9 | -0.2 | |
Green | Julia Garrett | 136 | 5.8 | -1.9 | |
Turnout | 2,349 | 54.8 | -4.8 | ||
Labour gain from Conservative | Swing | ||||
Party | Candidate | Votes | % | ±% | |
---|---|---|---|---|---|
Labour | David Proctor* | 2,003 | 56.1 | +6.6 | |
Labour | Daniel Connellan* | 1,953 | 54.7 | +6.1 | |
Labour | Geraldine Stanford* | 1,938 | 54.3 | +6.5 | |
Conservative | Nigel Dixon | 1,075 | 30.1 | -7.6 | |
Conservative | Selvin Brown | 1,054 | 29.5 | -7.0 | |
Conservative | Suresh Pandya | 991 | 27.8 | -6.5 | |
Liberal Democrats | Antoinette McCabe | 338 | 9.5 | N/A | |
Green | Francis Cluer | 215 | 6.0 | -4.0 | |
Turnout | 3,575 | 48.7 | -5.6 | ||
Labour hold | Swing | ||||
Party | Candidate | Votes | % | ±% | |
---|---|---|---|---|---|
Labour | Linda Kirby* | 1,331 | 63.1 | -2.2 | |
Labour | Joseph Abrams* | 1,262 | 59.8 | -2.1 | |
Conservative | Hazel McDonald | 439 | 20.8 | -7.5 | |
Conservative | Margaret Sheldrick | 397 | 18.8 | -7.6 | |
Liberal Democrats | Jonathan Snelling | 231 | 10.9 | N/A | |
Liberal Democrats | Marc Plessier | 199 | 9.4 | N/A | |
Green | Mary Wensley | 76 | 3.6 | N/A | |
Turnout | 2,119 | 49.9 | -0.7 | ||
Labour hold | Swing | ||||
Party | Candidate | Votes | % | ±% | |
---|---|---|---|---|---|
Conservative | James Holmes | 1,360 | 46.4 | -9.8 | |
Conservative | Jason Garbutt | 1,352 | 46.1 | -7.8 | |
Conservative | David Williams* | 1,350 | 46.1 | -7.4 | |
Labour | Christine Bickerstaff | 879 | 30.0 | +6.9 | |
Labour | William Bailey | 871 | 29.7 | +8.2 | |
Labour | Laurence North | 793 | 27.1 | +7.2 | |
Liberal Democrats | Louise Pugh | 550 | 18.8 | +3.3 | |
Liberal Democrats | Blaise Eglington | 539 | 18.4 | +4.8 | |
Liberal Democrats | Joan Pyke-Lees | 530 | 18.1 | +5.2 | |
Green | Richard Miller | 220 | 7.5 | -8.5 | |
Turnout | 2,936 | 43.9 | -7.9 | ||
Conservative hold | Swing | ||||
Party | Candidate | Votes | % | ±% | |
---|---|---|---|---|---|
Labour | Anthony Colman* | 1,547 | 66.7 | +0.8 | |
Labour | Malcolm Searle | 1,401 | 60.4 | -5.4 | |
Conservative | Gordon Raymond | 424 | 18.3 | -9.6 | |
Conservative | Dorothy Truman | 382 | 16.5 | +6.9 | |
Liberal Democrats | Wendy Taylor | 275 | 11.9 | N/A | |
Liberal Democrats | Patrick Macgabhann | 251 | 10.8 | N/A | |
Turnout | 2,326 | 45.9 | -4.7 | ||
Labour hold | Swing | ||||
Party | Candidate | Votes | % | ±% | |
---|---|---|---|---|---|
Labour | Patric Cunnane | 1,474 | 39.8 | +8.7 | |
Longthornton and Tamworth Residents | Robert Elgin* | 1,450 | 39.1 | +1.9 | |
Labour | Steven Holt | 1,437 | 38.8 | +8.2 | |
Longthornton and Tamworth Residents | Gillian Elgin* | 1,430 | 38.6 | +3.3 | |
Longthornton and Tamworth Residents | Terry Ellis | 1,428 | 38.6 | +3.0 | |
Labour | Mohammad Syed | 1,341 | 36.2 | +7.6 | |
Conservative | Richard Gill | 574 | 15.5 | -12.3 | |
Conservative | Ayman Akshar | 500 | 13.5 | -11.4 | |
Conservative | Harris Yee-Chong | 489 | 13.2 | -11.7 | |
Liberal Democrats | Caroline Plessier | 237 | 6.4 | N/A | |
Turnout | 3,709 | 51.1 | +2.6 | ||
Labour gain from Longthornton and Tamworth Residents | Swing | ||||
Longthornton and Tamworth Residents hold | Swing | ||||
Labour gain from Longthornton and Tamworth Residents | Swing | ||||
Party | Candidate | Votes | % | ±% | |
---|---|---|---|---|---|
Labour | Cyril Gallant | 1,417 | 42.8 | +5.3 | |
Labour | Nicholas Draper | 1,365 | 41.2 | +5.2 | |
Conservative | Janet Jones* | 1,351 | 40.8 | -9.6 | |
Conservative | Terence Daniels | 1,347 | 40.6 | -10.4 | |
Labour | Mark Springett | 1,310 | 39.5 | +5.7 | |
Conservative | Peter Morss* | 1,217 | 36.7 | -11.6 | |
Liberal Democrats | Patricia Pearce | 529 | 16.0 | N/A | |
Green | Susan Boulding | 288 | 8.7 | -2.9 | |
Turnout | 3,316 | 49.8 | -7.8 | ||
Labour gain from Conservative | Swing | ||||
Conservative hold | Swing | ||||
Party | Candidate | Votes | % | ±% | |
---|---|---|---|---|---|
Merton Park Residents | Neville Beddoe* | 1,968 | 57.6 | +9.8 | |
Merton Park Residents | Bridget Smith* | 1,948 | 57.0 | +8.9 | |
Merton Park Residents | Desmonde Child* | 1,944 | 56.9 | +8.8 | |
Labour | Edmond Ceci | 667 | 19.5 | +3.1 | |
Conservative | John Day | 664 | 19.4 | -10.8 | |
Labour | Alison Morgan | 645 | 18.9 | +2.3 | |
Conservative | Christopher Dyson | 633 | 18.5 | -12.8 | |
Conservative | Anne Sparrow | 632 | 18.5 | -12.6 | |
Labour | Aeronwen Griffiths | 628 | 18.4 | +2.7 | |
Liberal Democrats | William Prosser | 158 | 4.6 | N/A | |
Turnout | 3,423 | 52.8 | -6.5 | ||
Merton Park Residents hold | Swing | ||||
Party | Candidate | Votes | % | ±% | |
---|---|---|---|---|---|
Labour | Thomas Munn | 2,019 | 58.6 | +9.4 | |
Labour | Paul Harper* | 2,015 | 58.4 | +8.6 | |
Labour | Judith Saunders | 1,844 | 53.5 | +7.2 | |
Conservative | Nicholas Brewer | 740 | 21.5 | -9.6 | |
Conservative | Oliver Colvile | 679 | 19.7 | -10.0 | |
Conservative | Vivianne Pallister | 635 | 18.4 | -8.3 | |
Liberal Democrats | Lorraine Snelling | 377 | 10.9 | +0.5 | |
Independent | Richard Law | 325 | 9.4 | +0.6 | |
Liberal Democrats | Konrad Brodzinski | 298 | 8.6 | -1.1 | |
Liberal Democrats | Marek Siemaszko | 279 | 8.1 | +0.3 | |
Turnout | 3,453 | 44.7 | -2.4 | ||
Labour hold | Swing | ||||
Party | Candidate | Votes | % | ±% | |
---|---|---|---|---|---|
Labour | Frederick Flatt* | 1,885 | 62.4 | +14.3 | |
Labour | John Cole | 1,864 | 61.7 | +46.0 | |
Labour | Patrick Tiernan | 1,579 | 52.3 | +13.0 | |
Conservative | Beryl Akshar | 731 | 24.2 | -15.2 | |
Conservative | Kevin Shinkwin | 681 | 22.5 | -15.1 | |
Conservative | Abdul Kanso | 624 | 20.6 | -13.4 | |
Liberal Democrats | Patrick Howard | 478 | 15.8 | N/A | |
Turnout | 3,031 | 48.9 | -4.5 | ||
Labour hold | Swing | ||||
Labour gain from Conservative | Swing | ||||
Party | Candidate | Votes | % | ±% | |
---|---|---|---|---|---|
Labour | Philip Jones* | 2,040 | 64.1 | +9.2 | |
Labour | Peter Smith | 1,990 | 62.6 | +6.5 | |
Labour | Peter McCabe* | 1,987 | 62.5 | +8.4 | |
Conservative | Stephen Ashcroft | 623 | 19.6 | -8.4 | |
Conservative | Thomas Harris | 585 | 18.4 | -8.9 | |
Conservative | Michael Troy | 535 | 16.8 | -9.9 | |
Liberal Democrats | Philip Knight | 393 | 12.4 | +4.8 | |
Green | Julian Davidson | 210 | 6.6 | +1.2 | |
Independent | Terence Sullivan | 88 | 2.8 | N/A | |
Monster Raving Loony | Doris Wright | 63 | 2.0 | N/A | |
Turnout | 3,187 | 48.8 | -4.9 | ||
Labour hold | Swing | ||||
Party | Candidate | Votes | % | ±% | |
---|---|---|---|---|---|
Conservative | Margaret Brierly | 1,482 | 46.3 | -8.2 | |
Conservative | Robert Bell | 1,411 | 44.1 | -9.0 | |
Conservative | Michael Miles | 1,383 | 43.2 | -9.0 | |
Labour | Sandra Thorogood | 1,067 | 33.3 | +4.6 | |
Labour | Michael Mroczek | 962 | 30.1 | +4.2 | |
Labour | Mark Vines-Forman | 954 | 29.8 | +4.0 | |
Liberal Democrats | Nicola Savile-Tucker | 664 | 20.1 | +8.8 | |
Liberal Democrats | David Hurst | 647 | 19.6 | +8.4 | |
Liberal Democrats | Kevin McGuinness | 639 | 19.4 | +8.6 | |
Green | Andrew Taylor | 235 | 7.1 | -6.0 | |
Turnout | 3,304 | 46.3 | -7.9 | ||
Conservative hold | Swing | ||||
Party | Candidate | Votes | % | ±% | |
---|---|---|---|---|---|
Labour | Alec Leaver* | 1,994 | 62.3 | +6.1 | |
Labour | Steven Conquest | 1,860 | 58.1 | +4.7 | |
Labour | Michael Spacey | 1,797 | 56.2 | +4.2 | |
Conservative | Keith Guy | 745 | 23.3 | -8.6 | |
Conservative | Michael McGrory | 716 | 22.4 | -8.8 | |
Conservative | John Telford | 650 | 20.3 | -10.5 | |
Liberal Democrats | Susan Simmonds | 346 | 10.8 | N/A | |
Liberal Democrats | Nicholas Wren | 303 | 9.5 | N/A | |
Liberal Democrats | Ademola Akinmade | 288 | 9.0 | N/A | |
Green | Stephen Boulding | 171 | 5.3 | -5.0 | |
Turnout | 3,202 | 50.2 | -3.9 | ||
Labour hold | Swing | ||||
Party | Candidate | Votes | % | ±% | |
---|---|---|---|---|---|
Labour | Kingsley Abrams* | 1,519 | 46.9 | +6.5 | |
Labour | Patrick O'Sullivan | 1,433 | 44.3 | +6.8 | |
Labour | Paul Barasi | 1,427 | 44.1 | +6.8 | |
Conservative | Richard Aitken-Davies | 981 | 30.3 | -2.2 | |
Conservative | Diana Harris | 942 | 29.1 | -1.6 | |
Conservative | Simon Elliott | 941 | 29.1 | -1.5 | |
Liberal Democrats | Suzanne Deeley | 590 | 18.2 | -2.7 | |
Liberal Democrats | Anthony Dix | 543 | 16.8 | -2.3 | |
Liberal Democrats | Neil Rennie | 540 | 16.7 | -4.5 | |
Green | Sarah Miskin | 226 | 7.0 | -5.5 | |
Independent | Mohammad Karim | 140 | 4.3 | N/A | |
Turnout | 3,239 | 56.9 | +2.7 | ||
Labour hold | Swing | ||||
Party | Candidate | Votes | % | ±% | |
---|---|---|---|---|---|
Conservative | Roger Farrance | 1,551 | 58.3 | -4.3 | |
Conservative | Sarah Newton | 1,544 | 58.0 | -2.4 | |
Conservative | Allan Jones* | 1,502 | 56.4 | -4.9 | |
Liberal Democrats | Elizabeth Robins | 583 | 21.9 | +6.6 | |
Liberal Democrats | Marilyn Rumney | 516 | 19.4 | +8.2 | |
Labour | Denise Leggett | 494 | 18.6 | +2.0 | |
Labour | Duncan Michael | 485 | 18.2 | +1.5 | |
Liberal Democrats | Richard Tibbetts | 479 | 18.0 | +5.9 | |
Labour | Sittampalam Balarajah | 446 | 16.8 | +1.2 | |
Green | Margaret Garrett | 171 | 6.4 | -8.0 | |
Turnout | 2,663 | 44.9 | -8.1 | ||
Conservative hold | Swing | ||||
Party | Candidate | Votes | % | ±% | |
---|---|---|---|---|---|
Liberal Democrats | Alison Willott | 1,386 | 36.5 | N/A | |
Liberal Democrats | Iain Dysart | 1,330 | 35.0 | N/A | |
Liberal Democrats | Nicholas Harris | 1,275 | 33.6 | N/A | |
Labour | Laurence Naylor | 1,093 | 28.8 | +1.5 | |
Labour | Barry Edwards | 1,083 | 28.5 | -0.2 | |
Conservative | Margaret Grant | 1,066 | 28.1 | -16.8 | |
Conservative | Paul Hannan | 1,052 | 27.7 | -15.7 | |
Labour | Stephen Nixon | 1,044 | 27.5 | -3.0 | |
Conservative | Kenneth Butt | 1,026 | 27.0 | -15.6 | |
Independent | Roger Logan | 286 | 7.5 | -16.6 | |
Green | Jennifer Barrow | 203 | 5.3 | N/A | |
Turnout | 3,804 | 54.5 | -3.0 | ||
Liberal Democrats gain from Conservative | Swing | ||||
Lambeth is a London borough in South London, England, which forms part of Inner London. Its name was recorded in 1062 as Lambehitha and in 1255 as Lambeth. The geographical centre of London is at Frazier Street near Lambeth North tube station, though nearby Charing Cross on the other side of the Thames in the City of Westminster is traditionally considered the centre of London.
Wimbledon is a constituency represented in the House of Commons of the UK Parliament. Since 2005, the seat has been represented by Stephen Hammond of the Conservatives.
Streatham is a constituency represented in the House of Commons of the UK Parliament since 2019 by Bell Ribeiro-Addy of the Labour Party.
Lambeth London Borough Council is elected every four years.
Elections for the Council in the London Borough of Croydon are held every four years to elect 70 councillors. At the last elections, which were held in May 2018, 29 Conservative councillors and 41 Labour councillors were elected, providing a Labour majority of twelve seats.
The Camden London Borough Council in London, England is elected every four years. Since the last boundary changes in 2002, 54 councillors have been elected from 18 wards.
Local government elections took place in London, and some other parts of the United Kingdom on Thursday 4 May 2006. Polling stations were open between 7am and 10pm.
The London Borough of Lewisham is a London borough, in the United Kingdom, established in 1964. Elections are held every four years using a plurality bloc vote electoral system for the councillors and the supplementary vote electoral system for the elected mayor.
Sutton London Borough Council in London, England is elected every four years.
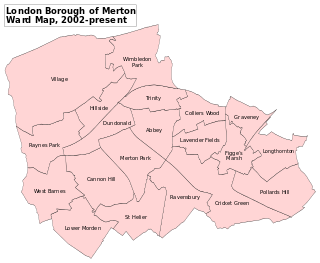
Merton London Borough Council in London, England is elected every four years; it has administrative control over the London Borough of Merton.
Elections for the London Borough of Merton were held on 7 May 1998 to elect members of Merton London Borough Council in London, England. This was on the same day as other local elections in England and a referendum on the Greater London Authority; in the latter, Merton voted in favour of creating the Greater London Authority by 72.2% on a 37.6% turnout.
Local government elections took place in London, and some other parts of the United Kingdom on Thursday 6 May 2010. Polling stations were open between 7am and 10pm.
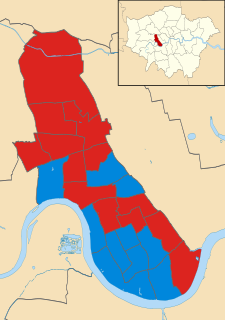
Elections for the London Borough of Merton were held on 6 May 2010. This was on the same day as other local elections in England and a national general election.
Wandsworth London Borough Council, England, is elected every four years. From 2002 to 2018, 60 councillors were elected from 20 wards. Following ward boundary changes, in 2022 58 councillors were elected in 22 wards returning either 2 or 3 councillors each.
There were local government elections in London on Thursday 22 May 2014. All councillor seats on the 32 London borough councils were up for election. The electorates of Hackney, Lewisham, Newham and Tower Hamlets also elected their executive mayors, who operate in place of council leaders in those boroughs. Ward changes took place in Hackney, Kensington and Chelsea, and Tower Hamlets, which reduced the total number of councillors by 10 to 1,851. Both the mayoral and councillor elections are four-yearly.
Local government elections took place in London, and some other parts of the United Kingdom on Thursday 2 May 2002. Ward changes took place in every borough, following a series of reviews and 32 statutory instruments which reduced the total number of councillors by 56 from 1,917 to 1,861.
The 1968 Barnet Council election took place on 9 May 1968 to elect members of Barnet London Borough Council in London, England. The whole council was up for election and the Conservative party stayed in overall control of the council. There were 60 seats divided into 20 wards of 3 seats each. The Conservatives won 56 seats, Labour 3 and the Liberals 1. There were also 5 aldermen, all of whom were Conservatives. The first election to Barnet Council was in 1964, and it acted as a shadow council until the London Borough of Barnet was established in 1965. No comparisons are possible between the 1964 and 1968 elections due to changes in the boundaries and the total number of councillors.
The 1990 Hammersmith and Fulham Council election took place on 3 May 1990 to elect members of Hammersmith and Fulham London Borough Council in London, England. The whole council was up for election and the Labour party stayed in overall control of the council.
Elections for the London Borough of Merton were held on 3 May 1990 to elect members of Merton London Borough Council in London, England. This was on the same day as other local elections in England and Scotland.
Elections for the London Borough of Merton were held on 2 May 2002. This was on the same day as other local elections in England. These elections were held under new ward boundaries, which increased the number of councillors to sixty from fifty-seven. Labour remained in overall control of the council with a reduced majority.