| |||||||||||||||||||||||||||||
60 seats for election to Hounslow London Borough Council 31 seats needed for a majority | |||||||||||||||||||||||||||||
---|---|---|---|---|---|---|---|---|---|---|---|---|---|---|---|---|---|---|---|---|---|---|---|---|---|---|---|---|---|
Registered | 155,314 [1] | ||||||||||||||||||||||||||||
Turnout | 75,959, 48.91% [1] | ||||||||||||||||||||||||||||
| |||||||||||||||||||||||||||||
|
The 1990 Hounslow Council election took place on 3 May 1990 to elect members of Hounslow London Borough Council in London, England. The whole council was up for election and the Labour party stayed in overall control of the council. [2]
This section is empty. You can help by adding to it. (March 2015) |
Party | Seats | Gains | Losses | Net gain/loss | Seats % | Votes % | Votes | +/− | |
---|---|---|---|---|---|---|---|---|---|
Labour | 44 [n 1] | 4 | 0 | 4 | 73.33 | 49.49 | 99,384 | ||
Conservative | 15 | 0 | 2 | 2 | 25.00 | 38.12 | 76,553 | ||
Liberal Democrats | 1 | 0 | 2 | 2 | 1.67 | 8.87 | 17,818 | ||
Green | 0 | 0 | 0 | 0.00 | 2.88 | 5,793 | |||
Independent Labour | 0 | 0 | 0 | 0.00 | 0.28 | 562 | |||
Isleworth South Community Group | 0 | 0 | 0 | 0.00 | 0.20 | 398 | |||
Independent | 0 | 0 | 0 | 0.00 | 0.11 | 220 | |||
BNP | 0 | 0 | 0 | 0.00 | 0.05 | 93 | |||
Total | 60 | 200,821 |
(*) - indicates an incumbent †andidate
(†) - indicates an incumbent candidate who has changed wards
Party | Candidate | Votes | % | |
---|---|---|---|---|
Labour | Michael N. Carman | 1,603 | 45.17 | |
Labour | Melvin B. Collins | 1,543 | ||
Labour | Patricia A. Nicholas† [n 2] | 1,514 | ||
Conservative | Margery Buck | 1,306 | 36.33 | |
Conservative | John F. Hardwick | 1,234 | ||
Conservative | Christopher J.H. Williams | 1,208 | ||
Green | John W. Bradley | 473 | 13.76 | |
Liberal Democrats | Steven R. Round | 219 | 4.74 | |
Liberal Democrats | Roy L. Knight | 106 | ||
Registered electors | 6,555 | |||
Turnout | 3,353 | 51.15 | ||
Rejected ballots | 2 | 0.06 | ||
Labour hold | ||||
Labour hold | ||||
Labour hold | ||||
Party | Candidate | Votes | % | |
---|---|---|---|---|
Conservative | Norah M. Atkins* | 1,254 | 41.57 | |
Conservative | Jillian M. Potter | 1,178 | ||
Labour | John H. Grigg | 1,049 | 32.96 | |
Labour | Ilyas Khwaja | 878 | ||
Green | Michael S.C. Maxwell | 386 | 13.20 | |
Liberal Democrats | Michael E. Browne | 359 | 12.27 | |
Registered electors | 5,028 | |||
Turnout | 2,740 | 54.49 | ||
Rejected ballots | 11 | 0.40 | ||
Conservative hold | ||||
Party | Candidate | Votes | % | |
---|---|---|---|---|
Conservative | Josephine C.F. Langton* | 1,643 | 37.72 | |
Conservative | Robert R.F. Kinghorn* | 1,636 | ||
Conservative | Paul K.J. Lynch | 1,577 | ||
Labour | Valerie J. Lamey | 1,311 | 28.26 | |
Liberal Democrats | Paul R. Rustad | 1,191 | 25.12 | |
Labour | Nigel Rogers | 1,173 | ||
Labour | Michael Shrimpton | 1,155 | ||
Liberal Democrats | Paula B. Kelly | 1,046 | ||
Liberal Democrats | Andrew T. Steed | 997 | ||
Green | Hilary T. Maxwell | 382 | 8.90 | |
Registered electors | 7,109 | |||
Turnout | 4,310 | 60.63 | ||
Rejected ballots | 6 | 0.14 | ||
Conservative hold | ||||
Party | Candidate | Votes | % | |
---|---|---|---|---|
Labour | Henry A. North | 1,951 | 67.40 | |
Labour | Harbans S. Kanwal* | 1,829 | ||
Labour | Jagpal S. Khangura* | 1,815 | ||
Conservative | Jack H. Austin | 1,013 | 32.60 | |
Conservative | Walter J. Pestell | 865 | ||
Conservative | Gurcharan S. Matharoo | 829 | ||
Registered electors | 7,371 | |||
Turnout | 3,199 | 43.40 | ||
Rejected ballots | 31 | 0.97 | ||
Labour hold | ||||
Labour hold | ||||
Labour hold | ||||
Party | Candidate | Votes | % | |
---|---|---|---|---|
Labour | Gary W. Cooper | 1,584 | 38.85 | |
Labour | Stephen J. Crawshaw* | 1,511 | ||
Labour | Derek W. Bonsor | 1,468 | ||
Conservative | Raymond Ferguson | 1,292 | 31.24 | |
Conservative | Patricia E. Page | 1,234 | ||
Conservative | Mark T. Simpson | 1,142 | ||
Liberal Democrats | James Daly* | 978 | 23.58 | |
Liberal Democrats | Peter R. Hills | 952 | ||
Liberal Democrats | Nigel Quin | 840 | ||
Green | Mary R. Stacey | 248 | 6.33 | |
Registered electors | 8,580 | |||
Turnout | 4,016 | 46.81 | ||
Rejected ballots | 5 | 0.12 | ||
Labour gain from Liberal Democrats | ||||
Labour hold | ||||
Labour hold | ||||
Party | Candidate | Votes | % | |
---|---|---|---|---|
Labour | David Archer* | 1,396 | 39.03 | |
Labour | Colin Driscoll | 1,373 | ||
Labour | Stephen M. McEvoy* | 1,277 | ||
Conservative | Mark E. Benson | 1,156 | 32.18 | |
Conservative | Daniel R. Lee | 1,117 | ||
Liberal Democrats | Robert G. Hill | 1,089 | 28.79 | |
Conservative | Alison H. Parry | 1,064 | ||
Liberal Democrats | Alan M. Juriansz | 986 | ||
Liberal Democrats | Mohammad A. Rahman | 910 | ||
Registered electors | 7,932 | |||
Turnout | 3,665 | 46.21 | ||
Rejected ballots | 8 | 0.22 | ||
Labour hold | ||||
Labour hold | ||||
Labour hold | ||||
Party | Candidate | Votes | % | |
---|---|---|---|---|
Labour | Michael J. Hunt* | 2,044 | 55.02 | |
Labour | John W. Chatt* | 2,012 | ||
Labour | Stuart Walmsley | 1,944 | ||
Conservative | Deborah E. Beach | 1,312 | 35.05 | |
Conservative | Andrew J. Cleary | 1,286 | ||
Conservative | Richard G. Coats | 1,223 | ||
Liberal Democrats | Ruth M. Hill | 385 | 9.93 | |
Liberal Democrats | Norman L.A. de Laune | 336 | ||
Registered electors | 8,752 | |||
Turnout | 3,867 | 44.18 | ||
Rejected ballots | 14 | 0.36 | ||
Labour hold | ||||
Labour hold | ||||
Labour hold | ||||
Party | Candidate | Votes | % | |
---|---|---|---|---|
Labour Co-op | Herbert R. Ham* | 1,623 | 56.26 | |
Labour Co-op | Alfred G. King* | 1,533 | ||
Labour Co-op | Edward J. Pauling* | 1,493 | ||
Conservative | Mary T. Lee | 1,135 | 40.36 | |
Conservative | William G. Martin | 1,135 | ||
Conservative | Jonathon C. Lebosquet | 1,067 | ||
BNP | Michael R. O'Rourke | 93 | 3.38 | |
Registered electors | 6,618 | |||
Turnout | 2,957 | 44.68 | ||
Rejected ballots | 8 | 0.27 | ||
Labour Co-op hold | ||||
Party | Candidate | Votes | % | |
---|---|---|---|---|
Labour | Ruth M. Cadbury* | 2,230 | 62.51 | |
Labour | Brian W. Price* | 2,104 | ||
Labour | David J. Hopkins | 2,081 | ||
Conservative | Raymond A. Langton | 1,350 | ||
Conservative | Gregory F. Pugsley | 1,258 | 37.49 | |
Conservative | Michael R. Lingens | 1,238 | ||
Registered electors | 7,802 | |||
Turnout | 3,748 | 48.04 | ||
Rejected ballots | 35 | 0.93 | ||
Labour hold | ||||
Labour hold | ||||
Labour hold | ||||
Party | Candidate | Votes | % | |
---|---|---|---|---|
Labour | Leslie Bawn | 1,395 | 38.05 | |
Liberal Democrats | Raymond E. Fincher* | 1,389 | 37.30 | |
Labour | Dave Wetzel† [n 3] | 1,354 | ||
Labour | Hilda E. Wetzel | 1,348 | ||
Liberal Democrats | Peter S. Cribb* | 1,344 | ||
Liberal Democrats | Michael F. Hoban | 1,285 | ||
Conservative | Judith S. Russell | 720 | 18.05 | |
Conservative | Ronald C.F. Russell | 691 | ||
Conservative | George E. Dryja | 533 | ||
Green | Albany M. Back | 237 | 6.60 | |
Registered electors | 7,940 | |||
Turnout | 3,720 | 46.85 | ||
Rejected ballots | 14 | 0.38 | ||
Labour hold | ||||
Liberal Democrats hold | ||||
Labour gain from Liberal Democrats | ||||
Party | Candidate | Votes | % | |
---|---|---|---|---|
Labour | James A. Kenna | 1,166 | 49.04 | |
Labour | Govind Agarwal | 1,087 | ||
Conservative | Richard R. Foster* | 982 | 41.78 | |
Conservative | Allan Wilson | 937 | ||
Liberal Democrats | Ian A. Venn | 211 | 9.18 | |
Registered electors | 4,911 | |||
Turnout | 2,380 | 48.46 | ||
Rejected ballots | 7 | 0.29 | ||
Labour gain from Conservative | ||||
Labour hold | ||||
Party | Candidate | Votes | % | |
---|---|---|---|---|
Conservative | Bramwell J.E. Ballard* | 1,168 | 47.00 | |
Labour | Roger M. Clarke | 1,120 | 45.64 | |
Conservative | Paul N. Woodward | 1,041 | ||
Labour | Ajit S. Mann | 1,025 | ||
Liberal Democrats | Christopher F. Fox | 183 | 7.36 | |
Liberal Democrats | Sarah E. Thomas-Bengry | 163 | ||
Registered electors | 5,155 | |||
Turnout | 2,534 | 49.16 | ||
Rejected ballots | 9 | 0.36 | ||
Conservative hold | ||||
Labour gain from Conservative | ||||
Party | Candidate | Votes | % | |
---|---|---|---|---|
Labour | Ronald J. Bartholomew | 2,409 | 60.33 | |
Labour | Rajinder S. Bath | 2,328 | ||
Labour | Mohammed H. Chaudhary | 2,296 | ||
Conservative | Simon R.P. Foster` | 1,444 | 35.06 | |
Conservative | Adrian J. Wilson | 1,354 | ||
Conservative | Caroline A. Imrie | 1,288 | ||
Liberal Democrats | Annelise V. Juriansz | 229 | 4.61 | |
Liberal Democrats | Jennifer M. Juriansz | 129 | ||
Registered electors | 8,535 | |||
Turnout | 4,289 | 50.25 | ||
Rejected ballots | 10 | 0.23 | ||
Labour hold | ||||
Labour hold | ||||
Labour hold | ||||
Party | Candidate | Votes | % | |
---|---|---|---|---|
Labour | Geoffrey C. Gill* | 2,047 | 59.09 | |
Labour | Robert J. Wheatley* | 1,971 | ||
Labour | Sham S. Jassar* | 1,882 | ||
Conservative | Jane M. Baker | 1,017 | 28.24 | |
Conservative | Gerald A.R. McGregor | 925 | ||
Conservative | Shirley Wrigley | 878 | ||
Green | Ivor D. Trueman | 422 | 12.68 | |
Registered electors | 7,230 | |||
Turnout | 3,416 | 47.25 | ||
Rejected ballots | 19 | 0.56 | ||
Labour hold | ||||
Labour hold | ||||
Labour hold | ||||
Party | Candidate | Votes | % | |
---|---|---|---|---|
Labour | David J. Mockeridge* | 2,289 | 61.21 | |
Labour | Jagdish R. Sharma* | 2,237 | ||
Labour | Ajmer S. Dhillon | 2,210 | ||
Conservative | Alfred J.M. Rowntree | 1,137 | 26.39 | |
Conservative | Haj M.A. Gondal | 893 | ||
Conservative | Chandrapal S. Sethi | 875 | ||
Green | Margaret M. Culliton | 455 | 12.40 | |
Registered electors | 8,204 | |||
Turnout | 3,863 | 47.09 | ||
Rejected ballots | 19 | 0.49 | ||
Labour hold | ||||
Labour hold | ||||
Labour hold | ||||
Party | Candidate | Votes | % | |
---|---|---|---|---|
Conservative | Valerie D. Marks* | 2,215 | 49.03 | |
Conservative | Peter E. Leggett | 2,188 | ||
Conservative | William H. Martin* | 2,134 | ||
Labour | Christopher D. Moss | 1,783 | 37.94 | |
Labour | Balbhardar S. Jain | 1,639 | ||
Labour | Shiv R.S. Mann | 1,635 | ||
Green | Carole Shearman | 579 | 13.03 | |
Registered electors | 8,021 | |||
Turnout | 4,461 | 55.62 | ||
Rejected ballots | 6 | 0.13 | ||
Conservative hold | ||||
Party | Candidate | Votes | % | |
---|---|---|---|---|
Labour | John Connelly* | 2,212 | 54.56 | |
Labour | Arjan S. Dhillon* | 2,078 | ||
Labour | Gurcharan K. Mann | 1,914 | ||
Conservative | Thomas W. Lewis | 1,307 | 33.25 | |
Conservative | Charles I. Jobling | 1,240 | ||
Conservative | Joseph A.J. Roderick | 1,232 | ||
Green | Brett Stacey | 462 | 12.19 | |
Registered electors | 8,535 | |||
Turnout | 4,289 | 50.25 | ||
Rejected ballots | 13 | 0.30 | ||
Labour hold | ||||
Labour hold | ||||
Labour hold | ||||
Party | Candidate | Votes | % | |
---|---|---|---|---|
Labour | Judy Atkinson | 2,131 | 44.57 | |
Labour | Peter G. Dodkins | 1,972 | ||
Labour | Antony Louki | 1,927 | ||
Conservative | Diane H. Cunningham | 1,754 | 37.67 | |
Conservative | Kevin J. Edwards | 1,672 | ||
Conservative | Christopher J. Gray | 1,670 | ||
Green | Lindsay Cooke | 581 | 12.88 | |
Independent | Alan J. Minchan | 220 | 4.88 | |
Registered electors | 8,077 | |||
Turnout | 4,284 | 53.04 | ||
Rejected ballots | 10 | 0.23 | ||
Labour hold | ||||
Labour hold | ||||
Labour hold | ||||
Party | Candidate | Votes | % | |
---|---|---|---|---|
Labour | Vanessa K. Smith† [n 4] | 1,694 | 35.81 | |
Labour | Peter Caldwell | 1,639 | ||
Labour | Pamela Wharfe | 1,398 | ||
Conservative | Cole D. Manson | 1,075 | 23.18 | |
Conservative | Peter A. Ross | 1,025 | ||
Conservative | Venugopal Nair | 963 | ||
Green | Judy S. M. Maciejowska | 605 | 13.74 | |
Independent Labour | William H. Raymond | 562 | 12.76 | |
Isleworth South Community Group | Thomas Reader | 398 | 9.04 | |
Liberal Democrats | Julie V. Thomas | 267 | 5.47 | |
Liberal Democrats | Anthony J. Fenelly | 241 | ||
Liberal Democrats | Andrew M.G. Thompson | 216 | ||
Registered electors | 7,771 | |||
Turnout | 3,698 | 47.59 | ||
Rejected ballots | 6 | 0.16 | ||
Labour hold | ||||
Labour hold | ||||
Labour hold | ||||
Party | Candidate | Votes | % | |
---|---|---|---|---|
Conservative | Barbara A. Reid* | 2,113 | 47.36 | |
Conservative | Peter F. de Vic Carey* | 2,043 | ||
Conservative | Robert E. Stratton | 1,971 | ||
Labour | Rosemary H. McManus | 1,430 | 31.21 | |
Labour | Barry Wilson | 1,345 | ||
Labour | Shivcharn S. Gill | 1,262 | ||
Green | Diana Z. Borodzicz | 552 | 12.80 | |
Liberal Democrats | Ivan K.S. Berti | 381 | 8.63 | |
Liberal Democrats | Moira L. Broom | 362 | ||
Registered electors | 8,423 | |||
Turnout | 4,150 | 49.27 | ||
Rejected ballots | 11 | 0.27 | ||
Conservative hold | ||||
Party | Candidate | Votes | % | |
---|---|---|---|---|
Conservative | Timothy J.A. Frost | 1,475 | 42.16 | |
Conservative | Alison A. Rankin | 1,437 | ||
Conservative | Wlodzimierz Diemko* | 1,404 | ||
Labour | John Bentley | 1,247 | 35.80 | |
Labour | Caroline S.M. Gibbon | 1,225 | ||
Labour | Susan P. Mockeridge | 1,195 | ||
Green | Timothy H. Jorgensen | 411 | 12.04 | |
Liberal Democrats | John D. Parker | 364 | 9.99 | |
Liberal Democrats | Trevor J. Law | 346 | ||
Liberal Democrats | Margaret A. Ahmed | 314 | ||
Registered electors | 6,557 | |||
Turnout | 3,325 | 50.71 | ||
Rejected ballots | 5 | 0.15 | ||
Conservative hold | ||||
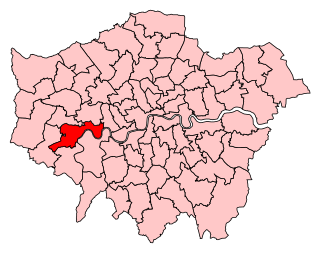
Brentford and Isleworth is a constituency represented in the House of Commons of the UK Parliament. It forms the eastern part of the London Borough of Hounslow. Since 2015, it has been represented by Ruth Cadbury of the Labour Party.
Hounslow Council in London, England is elected every four years. 60 councillors are elected from 20 wards, with by-elections held to fill any vacancies between elections.
Elections to Southwark Council were held in May 1990. The whole council was up for election. Turnout was 40.54%.
The 1990 Newham London Borough Council election to the Newham London Borough Council was held on 3 May 1990. The whole council was up for election. turnout no change was 33.0%. Labour maintained its overwhelming majority.
Elections to Tower Hamlets London Borough Council were held on 3 May 1990. The whole council was up for election. Turnout was 42.9%.
The 1964 Hounslow Council election took place on 7 May 1964 to elect members of Hounslow London Borough Council in London, England. The whole council was up for election and the Labour party gained control of the council.
The 1990 Bexley Council election took place on 3 May 1990 to elect members of Bexley London Borough Council in London, England. The whole council was up for election and the Conservative Party stayed in overall control of the council.
The 1990 Brent Council election took place on 3 May 1990 to elect members of Brent London Borough Council in London, England. The whole council was up for election and the council went in no overall control.
The 1990 Bromley Council election took place on 3 May 1990 to elect members of Bromley London Borough Council in London, England. The whole council was up for election and the Conservative party stayed in overall control of the council.
The 1990 Ealing Council election took place on 3 May 1990 to elect members of Ealing London Borough Council in London, England. The whole council was up for election and the Conservative party gained overall control of the council.
The 1990 Enfield Council election took place on 3 May 1990 to elect members of Enfield London Borough Council in London, England. The whole council was up for election and the Conservative party stayed in overall con89trol of the council.
The 1990 Greenwich Council election took place on 3 May 1990 to elect members of Greenwich London Borough Council in London, England. The whole council was up for election and the Labour party stayed in overall control of the council.
The 1990 Harrow Council election took place on 3 May 1990 to elect members of Harrow London Borough Council in London, England. The whole council was up for election and the Conservative party stayed in overall control of the council.
The 1990 Kingston upon Thames Council election took place on 3 May 1990 to elect members of Kingston upon Thames London Borough Council in London, England. The whole council was up for election and the council stayed in no overall control.
Elections for the London Borough of Merton were held on 3 May 1990 to elect members of Merton London Borough Council in London, England. This was on the same day as other local elections in England and Scotland.
The 1990 Richmond upon Thames Borough Council election took place on 3 May 1990 to elect members of Richmond upon Thames London Borough Council in London, England. The whole council was up for election and the Liberal Democrats stayed in overall control of the council.
The 1990 Sutton Council election took place on 3 May 1990 to elect members of Sutton London Borough Council in London, England. The whole council was up for election and the Liberal Democrats kept overall control of the council.
The 1990 Waltham Forest Council election took place on 3 May 1990 to elect members of Waltham Forest London Borough Council in London, England. The whole council was up for election and the Labour party stayed in overall control of the council.
The 1990 Wandsworth Council election took place on 3 May 1990 to elect members of Wandsworth London Borough Council in London, England. The whole council was up for election and the Conservative Party stayed in overall control of the council.
The 1990 Westminster Council election took place on 3 May 1990 to elect members of Westminster City Council in London, England. The whole council was up for election and the Conservative Party stayed in overall control of the council.