|
The 1994 Barking and Dagenham Borough Council election took place on 5 May 1994 to elect members of Barking and Dagenham London Borough Council in London, England. The whole council was up for election and the Labour Party stayed in overall control of the council. [1]
117 candidates nominated in total. Labour again ran a full slate (48) and was the only party to do so, whilst the Liberal Democrats ran 47. By contrast the Conservative Party ran only 12 candidates.
Labour continued to win a large majority of seats - 44 out of 48. The Residents Association held their 3 seats. The Liberal Democrats won 1 seat.
Party | Candidate | Votes | % | ±% | |
---|---|---|---|---|---|
Labour | Jeannette Alexander | 1,601 | 61.3 | -4.5 | |
Labour | Graham Bramley | 1,562 | |||
Labour | Mohammed Fani | 1,403 | |||
Independent | Narain Kaul | 476 | 18.2 | N/A | |
Liberal Democrats | Claire Stepton | 317 | 12.1 | -4.3 | |
Liberal Democrats | Anthony Stepton | 310 | |||
Liberal Democrats | Margaret Tester | 273 | |||
Conservative | John Stavers | 217 | 8.3 | -9.5 | |
Conservative | Danielle Whitton | 202 | |||
Conservative | Robert Whitton | 183 | |||
Turnout | 2,662 | 39.7 | +4.5 | ||
Registered electors | 6,700 | ||||
Labour hold | Swing | ||||
Party | Candidate | Votes | % | ±% | |
---|---|---|---|---|---|
Labour | Terence Wade | 1,208 | 84.4 | +5.3 | |
Labour | Ernest White | 1,189 | |||
Liberal Democrats | Joan Cooper | 224 | 15.6 | +7.8 | |
Liberal Democrats | Linda Luby | 203 | |||
Turnout | 1,569 | 36.9 | -0.6 | ||
Registered electors | 4,252 | ||||
Labour hold | Swing | ||||
Party | Candidate | Votes | % | ±% | |
---|---|---|---|---|---|
Labour | Edith Bradley | 1,354 | 81.2 | N/A | |
Labour | John Wainwright | 1,292 | |||
Liberal Democrats | Clifford Evans | 313 | 18.8 | N/A | |
Liberal Democrats | Linda McGuinness | 294 | |||
Turnout | 1,760 | 33.9 | N/A | ||
Registered electors | 5,183 | ||||
Labour win (new seat) | |||||
Labour win (new seat) |
Party | Candidate | Votes | % | ±% | |
---|---|---|---|---|---|
Labour | Mabel Arnold | 1,896 | 83.1 | -1.8 | |
Labour | Joan Rawlinson | 1,839 | |||
Labour | June van Roten | 1,742 | |||
Liberal Democrats | Heather Boorman | 385 | 16.9 | N/A | |
Liberal Democrats | David Boorman | 369 | |||
Liberal Democrats | Elizabeth Durrant | 322 | |||
Turnout | 2,561 | 38.3 | +1.5 | ||
Registered electors | 6,683 | ||||
Labour hold | Swing | ||||
Party | Candidate | Votes | % | ±% | |
---|---|---|---|---|---|
Residents | Albert Gibbs | 1,362 | 48.5 | -1.2 | |
Residents | Ronald Curtis | 1,359 | |||
Residents | Robert Jeyes | 1,269 | |||
Labour | Violet Gasson | 1,089 | 38.7 | -0.5 | |
Labour | Vera Cridland | 1,071 | |||
Labour | Malcolm Murchie | 956 | |||
Conservative | Mark Gilding | 193 | 6.9 | -5.2 | |
Conservative | John Graham | 183 | |||
Liberal Democrats | Anil Fernando | 167 | 5.9 | N/A | |
Conservative | Sharon Keefe | 143 | |||
Turnout | 2,776 | 40.6 | -1.7 | ||
Registered electors | 6,835 | ||||
Residents hold | Swing | ||||
Party | Candidate | Votes | % | ±% | |
---|---|---|---|---|---|
Labour | Richard Blackburn | 1,788 | 82.1 | +2.8 | |
Labour | Frederick Tibble | 1,739 | |||
Labour | Lawrence Bunn | 1,682 | |||
Liberal Democrats | Angela Lambart | 390 | 17.9 | N/A | |
Liberal Democrats | Donna Lewis | 328 | |||
Liberal Democrats | Jacqueline Williams | 317 | |||
Turnout | 2,399 | 35.1 | -0.5 | ||
Registered electors | 6,837 | ||||
Labour hold | Swing | ||||
Party | Candidate | Votes | % | ±% | |
---|---|---|---|---|---|
Labour | Patrick Manley | 1,188 | 50.0 | -1.9 | |
Liberal Democrats | Stephen Churchman | 1,186 | 50.0 | +11.4 | |
Liberal Democrats | Deborah Richardson | 1,086 | |||
Labour | Gordon Mayor | 1,013 | |||
Turnout | 2,456 | 56.1 | +5.5 | ||
Registered electors | 4,375 | ||||
Labour hold | Swing | ||||
Liberal Democrats gain from Labour | Swing | ||||
Party | Candidate | Votes | % | ±% | |
---|---|---|---|---|---|
Labour | Frederick Jones | 1,788 | 82.9 | -2.2 | |
Labour | Raymond Parkin | 1,696 | |||
Labour | John Thomas | 1,569 | |||
Liberal Democrats | Margaret Deller | 368 | 17.1 | N/A | |
Liberal Democrats | Timothy Williams | 350 | |||
Turnout | 2,383 | 36.8 | +0.8 | ||
Registered electors | 6,367 | ||||
Labour hold | Swing | ||||
Party | Candidate | Votes | % | ±% | |
---|---|---|---|---|---|
Labour | Kathleen Flint | 1,214 | 61.5 | +10.8 | |
Labour | Suzanne Kelly | 1,147 | |||
Labour | Valerie Rush | 1,107 | |||
Liberal Democrats | Alan Copper | 760 | 38.5 | -10.8 | |
Liberal Democrats | David Oram | 732 | |||
Liberal Democrats | Richard Colclough | 700 | |||
Turnout | 2,054 | 34.5 | -3.0 | ||
Registered electors | 5,955 | ||||
Labour hold | Swing | ||||
Labour gain from Liberal Democrats | Swing | ||||
Labour hold | Swing | ||||
Party | Candidate | Votes | % | ±% | |
---|---|---|---|---|---|
Labour | Terence Power | 1,608 | 83.8 | +5.5 | |
Labour | Alan Thomas | 1,566 | |||
Liberal Democrats | Peter Downs | 310 | 16.2 | +5.9 | |
Liberal Democrats | Hayley Downs | 306 | |||
Turnout | 2,057 | 38.3 | +0.5 | ||
Registered electors | 5,364 | ||||
Labour hold | Swing | ||||
Party | Candidate | Votes | % | ±% | |
---|---|---|---|---|---|
Labour | Charles Fairbrass | 1,907 | 90.3 | +10.1 | |
Labour | Sidney Kallar | 1,801 | |||
Labour | John Lawrence | 1,762 | |||
Liberal Democrats | Sylivia Eddy | 205 | 9.7 | N/A | |
Liberal Democrats | Steven Payne | 192 | |||
Liberal Democrats | Jean Kemnitz | 166 | |||
Turnout | 2,491 | 36.8 | +0.7 | ||
Registered electors | 6,765 | ||||
Labour hold | Swing | ||||
Party | Candidate | Votes | % | ±% | |
---|---|---|---|---|---|
Labour | David Sterry | 1,442 | 49.0 | +5.7 | |
Labour | Dennis Bomberg | 1,376 | |||
Labour | Nirmal Gill | 1,325 | |||
Liberal Democrats | Brian Beadle | 752 | 25.5 | +17.3 | |
Conservative | Brian Cook | 750 | 25.5 | -13.6 | |
Conservative | Peter Burch | 741 | |||
Conservative | Valerie Burch | 712 | |||
Liberal Democrats | Daniel Felton | 613 | |||
Liberal Democrats | Nigel Meyer | 583 | |||
Turnout | 3,031 | 45.3 | -1.5 | ||
Registered electors | 6,688 | ||||
Labour hold | Swing | ||||
Party | Candidate | Votes | % | ±% | |
---|---|---|---|---|---|
Labour | Alastair Hannah-Rogers | 1,401 | 80.7 | +0.3 | |
Labour | Rita Hannah-Rogers | 1,364 | |||
Liberal Democrats | Roy Gregory | 335 | 19.3 | +7.3 | |
Liberal Democrats | Mildred Kenworthy | 283 | |||
Turnout | 1,779 | 38.3 | -2.2 | ||
Registered electors | 4,650 | ||||
Labour hold | Swing | ||||
Party | Candidate | Votes | % | ±% | |
---|---|---|---|---|---|
Labour | Maureen Worby | 921 | 78.0 | -5.3 | |
Labour | Peter Melia | 845 | |||
Liberal Democrats | Winifred Chapman | 260 | 22.0 | N/A | |
Liberal Democrats | Roger Miller | 248 | |||
Turnout | 1,322 | 37.4 | -7.4 | ||
Registered electors | 3,539 | ||||
Labour hold | Swing | ||||
Labour win (new seat) |
Party | Candidate | Votes | % | ±% | |
---|---|---|---|---|---|
Labour | Joseph Butler | 1,000 | 49.1 | -23.4 | |
Labour | Brian Walker | 947 | |||
Independent Labour | John Dias-Broughton | 753 | 37.0 | N/A | |
Liberal Democrats | Wendy Churchman | 282 | 13.9 | +2.0 | |
Liberal Democrats | John Richardson | 252 | |||
Turnout | 1,890 | 38.8 | +0.2 | ||
Registered electors | 4,865 | ||||
Labour hold | Swing | ||||
Party | Candidate | Votes | % | ±% | |
---|---|---|---|---|---|
Labour | Patricia Twomey | 1,200 | 78.3 | -2.2 | |
Labour | Inder Jamu | 1,064 | |||
Liberal Democrats | Robert Mansfield | 332 | 21.7 | N/A | |
Liberal Democrats | Leonard McGuinness | 239 | |||
Turnout | 1,624 | 33.6 | +1.1 | ||
Registered electors | 4,828 | ||||
Labour hold | Swing | ||||
Party | Candidate | Votes | % | ±% | |
---|---|---|---|---|---|
Labour | George Shaw | 1,517 | 76.9 | -13.0 | |
Labour | Royston Patient | 1,476 | |||
BNP | Gary Hewiit | 252 | 12.8 | N/A | |
Liberal Democrats | Catherine Kelly | 204 | 10.3 | +0.2 | |
Liberal Democrats | John Kelly | 191 | |||
Turnout | 1,999 | 46.5 | +4.6 | ||
Registered electors | 4,300 | ||||
Labour hold | Swing | ||||
Party | Candidate | Votes | % | ±% | |
---|---|---|---|---|---|
Labour | George Brooker | 1,804 | 83.3 | +9.9 | |
Labour | John Davis | 1,749 | |||
Labour | Cameron Geddes | 1,560 | |||
Liberal Democrats | Kenneth Barker | 362 | 16.7 | +5.9 | |
Liberal Democrats | June Griffin | 327 | |||
Liberal Democrats | Anthony Walker | 322 | |||
Turnout | 2,371 | 35.8 | -2.9 | ||
Registered electors | 6,628 | ||||
Labour hold | Swing | ||||
Party | Candidate | Votes | % | ±% | |
---|---|---|---|---|---|
Labour | Jean Bruce | 1,840 | 80.5 | N/A | |
Labour | Leonard Collins | 1,758 | |||
Labour | Bryan Osborn | 1,753 | |||
Liberal Democrats | Irene Hilton | 445 | 19.5 | N/A | |
Liberal Democrats | Bryan Tester | 339 | |||
Turnout | 2,497 | 38.4 | N/A | ||
Registered electors | 6,502 | ||||
Labour hold | Swing | ||||
Party | Candidate | Votes | % | ±% | |
---|---|---|---|---|---|
Labour | Katherine Golden | 1,968 | 78.9 | +4.7 | |
Labour | Darrin Best | 1,872 | |||
Labour | William Dale | 1,849 | |||
Liberal Democrats | Peter Lepley | 276 | 11.1 | +2.6 | |
Liberal Democrats | Linda Holmes | 264 | |||
Conservative | Kenneth Coombs | 250 | 10.0 | -7.3 | |
Liberal Democrats | Samuel Hodge | 248 | |||
Conservative | Terence Mallindine | 205 | |||
Conservative | William Preston | 195 | |||
Turnout | 2,630 | 36.9 | +1.3 | ||
Registered electors | 7,134 | ||||
Labour hold | Swing | ||||
Party | Candidate | Votes | % | ±% | |
---|---|---|---|---|---|
Labour | June Conyard | 657 | 86.7 | +6.0 | |
Liberal Democrats | David Oram | 101 | 13.3 | -6.0 | |
Majority | 556 | 73.4 | N/A | ||
Turnout | 16.6 | -21.7 | |||
Registered electors | |||||
Labour hold | Swing | ||||
The by-election was called following the resignation of Cllr. Alastair Hannah-Rogers.
Party | Candidate | Votes | % | ±% | |
---|---|---|---|---|---|
Labour | Steven Gill | 604 | 57.1 | +8.0 | |
Independent Labour | John Broughton | 360 | 34.1 | -2.9 | |
Liberal Democrats | Alan Cooper | 93 | 8.8 | -5.1 | |
Majority | 244 | 23.0 | N/A | ||
Turnout | 22.3 | -16.5 | |||
Registered electors | |||||
Labour hold | Swing | ||||
The by-election was called following the death of Cllr. Joseph A. Butler.
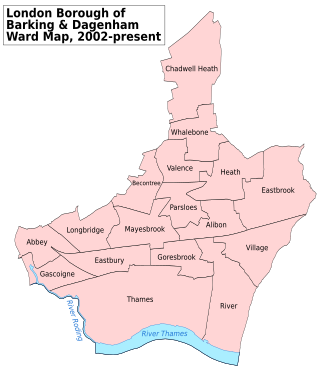
Barking and Dagenham London Borough Council in London, England is elected every four years. Since the last boundary changes in 2022 the council has comprised 51 councillors representing 19 wards, with each ward electing two or three councillors. Elections are held every four years.
The 1998 Barking and Dagenham London Borough Council election took place on 7 May 1998 to elect members of Barking and Dagenham London Borough Council in London, England. The whole council was up for election and the Labour Party stayed in overall control of the council.
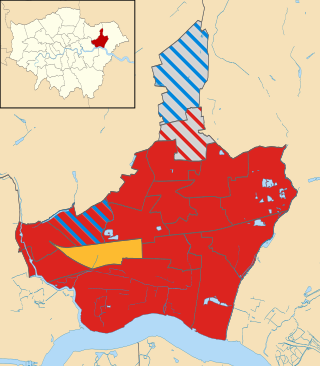
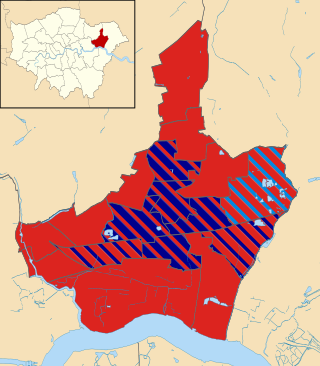
Elections for Barking and Dagenham London Borough Council, UK were held on 2 May 2002 to elect members to the council. All seats were up for election following boundary changes since the last election in 1998. The Labour Party kept overall control of the council, but lost 5 seats. Overall turnout was 22.76%.
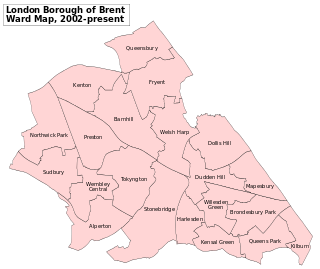
Brent London Borough Council in London, England is elected every four years. Since the last boundary changes in 2022 the council has comprised 57 councillors representing 22 wards, with each ward electing two or three councillors.
Elections for Barking and Dagenham London Borough Council were held on Thursday 4 May 2006. The whole council was up for election. Barking and Dagenham is split up into 17 wards, each electing 3 councillors, so a total of 51 seats were up for election.
The 2010 Barking and Dagenham Council election took place on 6 May 2010 to elect members of Barking and Dagenham London Borough Council in London, England.
Elections to Newham London Borough Council in London, England were held on 4 May 2006. The whole council, including the directly elected mayor, was up for election for the first time since the 2002 election. The Labour Party maintained control of the council.
The 1986 Newham London Borough Council election for the Newham London Borough Council was held on 8 May 1986. The whole council was up for election. Turnout was 30.7%. Labour, for the first time, won all 60 seats.
The 1982 Newham London Borough Council election for the Newham London Borough Council was held on 6 May 1982. The whole council was up for election. Turnout was 27.0%. The Labour Party held onto its overwhelming majority.
The 1978 Newham London Borough Council election for the Newham London Borough Council was held on 4 May 1978. The whole council was up for election. Turnout was 26.8%. The Liberal Party didn't stand in the elections. The Labour Party held onto its overwhelming majority.
The 1994 Newham London Borough Council election to the Newham London Borough Council was held on 5 May 1994. The whole council was up for election. Turnout was 37.2%. Labour maintained its overwhelming majority.
The 1998 Newham London Borough election for the Newham London Borough Council was held on 7 May 1998. The whole council was up for election. Turnout was 28.4%. Labour won every seat for the second time since the councils formation.
The 1974 Barking Borough Council election took place on 2 May 1974 to elect members of Barking London Borough Council in London, England. The whole council was up for election and the Labour Party stayed in overall control of the council.
The 1978 Barking Borough Council election took place on 4 May 1978 to elect members of Barking London Borough Council in London, England. The whole council was up for election and the Labour Party stayed in overall control of the council.
The 1982 Barking and Dagenham Borough Council election took place on 6 May 1982 to elect members of Barking and Dagenham London Borough Council in London, England. The whole council was up for election and the Labour Party stayed in overall control of the council.
The 1986 Barking and Dagenham Borough Council election took place on 8 May 1986 to elect members of Barking and Dagenham London Borough Council in London, England. The whole council was up for election and the Labour Party stayed in overall control of the council.
The 1990 Barking and Dagenham Borough Council election took place on 3 May 1990 to elect members of Barking and Dagenham London Borough Council in London, England. The whole council was up for election and the Labour Party stayed overwhelmingly in overall control of the council.
The 2018 Newham London Borough Council election was held on 3 May 2018 to elect members of Newham London Borough Council in England. This was on the same day as other local elections.
The 2018 Barking and Dagenham Council election took place on 3 May 2018 to elect members of Barking and Dagenham Council in London. This was on the same day as other local elections. The Labour Party won every available council seat for the third election in a row, winning 74% of the popular vote. The Conservatives saw their vote share rise by 13 percentage points, but failed to win any seats.