2006 Liverpool City Council election

Last updated

2006 Liverpool City Council election
Coat of arms of Liverpool City Council.svg
  2004 4 May 2006 (2006-05-04) 2007  

30 of 90 seats (one-third)
to Liverpool City Council
46 seats needed for a majority
 First partySecond party
 
Joe Anderson (crop).jpg
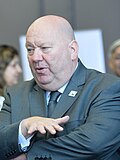
Leader Warren Bradley Joe Anderson
Party Liberal Democrats Labour
Leader's seat Wavertree Riverside
Seats before6027
Seats after5730
Seat change-3+3
Popular vote34,79432,273
Percentage40.5%37.6%
Swing-12.4%+4.4%

 Third partyFourth party
 
Cllr Steve Radford.png
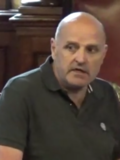
Leader Steve Radford
Party Liberal Green
Leader's seat Tuebrook
and
Stoneycroft
Seats before31
Seats after31
Seat change00
Popular vote6,4325,112
Percentage7.5%5.9%
Swing+1.7%+3.0%

Liverpool wards 2006.png
Map showing the results of the 2006 Liverpool City Council election

Control of Council before election


Liberal Democrats

Elected Control of Council


Liberal Democrats

Elections to Liverpool City Council were held on 4 May 2006. One third of the council was up for election and the Liberal Democrat party kept overall control of the council. Overall turnout was 25%.

Contents

After the election, the composition of the council was

PartySeats  ±  
Liberal Democrat 56-3
Labour 30+3
Liberal Party 30
Green 10

Election result

Liverpool Local Election Result 2006
PartySeatsGainsLossesNet gain/lossSeats %Votes %Votes+/−
  Liberal Democrats 1703-356.740.534,794-12.4%
  Labour 1230+340.037.632,273+4.4%
  Liberal 10003.37.56,432+1.7%
  Conservative 000006.75,766+3.5%
  Green 000005.95,112+3.0%
  BNP 000000.5417+0.4%
  UKIP 000000.4332+0.3%
  Respect 000000.3281+0.3%
  Independent 000000.3274+0.0%
  United Socialist 000000.2132+0.2%
  Socialist Labour 000000.2130-0.1%

Ward results

Allerton and Hunts Cross

Allerton and Hunts Cross
PartyCandidateVotes%±%
Liberal Democrats Vera Best1,61949.6%
Labour Daniel Hughes68721.0
Conservative Brenda Coppell55617.0
Green Margaret Williams2116.5
Liberal Christopher Hulme1945.9
Majority93228.6
Registered electors 10,883
Turnout 3,26730
Rejected ballots5
Liberal Democrats hold Swing

[1]

Anfield

Anfield
PartyCandidateVotes%±%
Liberal Democrats Andrew Tremarco1,10142.3%
Labour Brian Dowling82431.7
Liberal Michael Butler44817.2
Green Shane Delaney1335.1
Conservative Allen Epsley953.7
Majority17710.6
Registered electors 11,166
Turnout 2,60123
Rejected ballots11
Liberal Democrats hold Swing

[2]

Belle Vale

Belle Vale
PartyCandidateVotes%±%
Labour Pauline Walton1,90351.7%
Liberal Democrats Peter Rainford1,55642.2
Liberal Deborah Mayes1313.6
Conservative Norman Coppell942.6
Majority3479.5
Registered electors 11,385
Turnout 3,68432
Rejected ballots12
Labour hold Swing

[3]

Central

Central
PartyCandidateVotes%±%
Labour Nick Small71953.3%
Liberal Democrats Paul Twigger39529.3
Green Peter Cranie1047.7
Conservative Mark Cottrell1027.6
Liberal Karl Prescott292.1
Majority32424.0
Registered electors 11,240
Turnout 1,34912
Rejected ballots7
Labour hold Swing

[4]

Childwall

Childwall
PartyCandidateVotes%±%
Liberal Democrats Trevor Jones2,08461.9%
Labour Janet Kent66119.6
Conservative June Brandwood2948.7
Green Faye Griffiths2427.2
Liberal Francis Porter872.6
Majority1,42342.3
Registered electors 11,320
Turnout 3,36830
Rejected ballots14
Liberal Democrats hold Swing

[5]

Church

Church
PartyCandidateVotes%±%
Liberal Democrats Colin Eldridge2,30660.2%
Labour Timothy Beaumont50113.1
Green Eleanor Martin3358.7
Conservative Graham Jones2917.6
Independent Jeffrey Berman2747.2
Liberal James MacGregor1223.2
Majority1,80547.1
Registered electors 11,148
Turnout 3,82934
Rejected ballots7
Liberal Democrats hold Swing

[6]

Clubmoor

Clubmoor
PartyCandidateVotes%±%
Labour Roz Gladden1,44048.6%
Liberal David Maher79126.7
Liberal Democrats James Gaskell41013.8
Conservative Gwynneth Hicklin1324.5
Green Andrew Hoban1204.0
Socialist Labour Kai Anderson712.4
Majority649
Registered electors 11,794
Turnout 2,96425
Rejected ballots7
Labour hold Swing

[7]

County

County
PartyCandidateVotes%±%
Liberal Democrats Paul Clark1,38052.7%
Labour Patrick Delahunty1,08041.3
Liberal Roger Webb843.2
Conservative Francis Stevens732.8
Majority30011.4
Registered electors 10,874
Turnout 2,61724
Rejected ballots9
Liberal Democrats hold Swing

[8]

Cressington

Cressington
PartyCandidateVotes%±%
Liberal Democrats Richard Oglethorpe1,85652.5%
Labour Catherine Dooley77822.0
Conservative Emlyn Williams38110.8
Green Richard De Pesando2928.3
Liberal John Moore2276.4
Majority1,07830.5
Registered electors 11,251
Turnout 3,53431
Rejected ballots7
Liberal Democrats hold Swing

[9]

Croxteth

Croxteth
PartyCandidateVotes%±%
Labour Nadia Stewart1,80461.5%
Liberal Democrats Patrick Moloney90230.7
Green Anne Graham1515.1
Liberal Mary-Jane Canning772.6
Majority90230.8
Registered electors 10,560
Turnout 2,93428
Rejected ballots9
Labour hold Swing

[10]

Everton

Everton
PartyCandidateVotes%±%
Labour John McIntosh1,51968.8%
Liberal Democrats Craig Crennell29613.4
Conservative Matthew Sephton1406.3
Green Adam Howarth1376.2
Liberal David Wood1175.3
Majority1,22355.4
Registered electors 11,143
Turnout 2,20920
Rejected ballots10
Labour hold Swing

[11]

Fazakerley

Fazakerley
PartyCandidateVotes%±%
Labour Dave Hanratty1,45048.1%
Liberal Democrats Graham Seddon1,33344.2
Liberal Charles Mayes1214.0
Conservative Myra Fitzsimmons1133.7
Majority1173.9
Registered electors 11,821
Turnout 3,01726
Rejected ballots24
Labour hold Swing

[12]

Greenbank

Greenbank
PartyCandidateVotes%±%
Liberal Democrats Linda-Jane Buckle1,02540.8%
Labour Christopher Helm62725.0
Green Louise McVey48519.3
Conservative Giselle McDonald2469.8
Liberal David O'Brien1305.2
Majority39815.8
Registered electors 10,921
Turnout 2,51323
Rejected ballots12
Liberal Democrats hold Swing

[13]

Kensington and Fairfield

Kensington and Fairfield
PartyCandidateVotes%±%
Labour Louise Baldock 1,12745.0%
Liberal Democrats James Kendrick95538.2
Liberal Elizabeth Pascoe1807.2
Green Paula Rice1526.1
Conservative Francis Dunne883.5
Majority1726.8
Registered electors 10,355
Turnout 2,50224
Rejected ballots8
Labour gain from Liberal Democrats Swing

[14]

Kirkdale

Kirkdale
PartyCandidateVotes%±%
Labour Malcolm Kennedy1,95878.2%
Liberal Democrats Francis O'Donoghue2329.3
UKIP Joseph Moran1827.3
Conservative Thomas O'Brien692.8
Green Alexander Taylor642.6
Majority1,72668.9
Registered electors 11,828
Turnout 2,50521
Rejected ballots8
Labour hold Swing

[15]

Knotty Ash

Knotty Ash
PartyCandidateVotes%±%
Liberal Democrats Josie Mullen1,27544.1%
Labour Anthony Concepcion1,17540.7
Liberal Andrew Donaldson2408.3
Conservative Michael Lind1996.9
Majority1003.4
Registered electors 10,482
Turnout 2,88928
Rejected ballots14
Liberal Democrats hold Swing

[16]

Mossley Hill

Mossley Hill
PartyCandidateVotes%±%
Liberal Democrats Tina Gould1,90655.5%
Labour Josephine Lazzari61718.0
Conservative Ann Nugent38211.1
Green Vicki Anderson36710.7
Liberal Patricia Elmour1604.7
Majority1,28937.5
Registered electors 10,660
Turnout 3,43232
Rejected ballots19
Liberal Democrats hold Swing

[17]

Norris Green

Norris Green
PartyCandidateVotes%±%
Labour Violet Bebb1,38759.2%
BNP John Edgar41717.8
Liberal Democrats Christine Doyle2329.9
Green Eric Cartmel1114.7
Liberal Vera Phillips994.2
Conservative Jonathan Kearney954.1
Majority97041.4
Registered electors 11,099
Turnout 2,34121
Rejected ballots3
Labour hold Swing

[18]

Old Swan

Old Swan
PartyCandidateVotes%±%
Liberal Democrats Keith Turner1,43648.4%
Labour Wendy Simon85929.0
Liberal Edith Bamford1725.8
UKIP Mark Bill1505.1
Conservative Pauline Dougherty1485.0
Green Paul Grimes1344.5
United Socialist Paul Filby682.3
Majority57719.4
Registered electors 12,260
Turnout 2,96724
Rejected ballots13
Liberal Democrats hold Swing

[19]

Picton

Picton
PartyCandidateVotes%±%
Liberal Democrats Laurence Sidorczuk1,25349.5%
Labour Angela Glanville87934.8
Liberal Griffith Parry2178.6
Green Nilesh Chauhan1807.1
Majority37414.7
Registered electors 11,958
Turnout 2,52921
Rejected ballots16
Liberal Democrats hold Swing

[20]

Princes Park

Princes Park
PartyCandidateVotes%±%
Labour Anna Rothery1,18444.5%
Liberal Democrats Mohamed Ali64524.2%
Respect Paul Desson28110.6
Green Sophy Hansford2469.2
Liberal Nina Edge2107.9
Conservative Alma McGing963.6
Majority53920.3
Registered electors 11,015
Turnout 2,66224
Rejected ballots22
Labour gain from Liberal Democrats Swing

[21]

Riverside

Riverside
PartyCandidateVotes%±%
Labour Joe Anderson 1,56266.0%
Liberal Democrats Gabriel Muies26711.3
Conservative Richard Perkins2058.7
Green Jonathan Clatworthy1807.6
Liberal Irene Mayes903.8
United Socialist Cecilia Ralph642.7
Majority1,29554.7
Registered electors 11,174
Turnout 2,36821
Rejected ballots12
Labour hold Swing

[22]

St Michaels

St Michaels
PartyCandidateVotes%±%
Liberal Democrats Peter Allen1,11241.5%
Green Jean Hill67525.2
Labour Jack Johnson67025.0
Conservative David Patmore2258.4
Majority43716.3
Registered electors 10,288
Turnout 2,68226
Rejected ballots16
Liberal Democrats hold Swing

[23]

Speke-Garston

Speke-Garston
PartyCandidateVotes%±%
Labour Doreen Knight2,14159.3%
Liberal Democrats Francis Roderick1,13831.5
Green Cherry Fitzsimmons1413.9
Conservative Denise Nuttall1073.0
Liberal Michael Williams842.3
Majority1,00327.8
Registered electors 13,220
Turnout 3,61127
Rejected ballots17
Labour gain from Liberal Democrats Swing

[24]

Tuebrook and Stoneycroft

Tuebrook and Stoneycroft
PartyCandidateVotes%±%
Liberal Chris Lenton1,58760.6%
Labour Allen Hammond62824.0
Liberal Democrats Richard Williams30811.8
Conservative Damian Fisher963.7
Majority95936.6
Registered electors 11,743
Turnout 2,61922
Rejected ballots17
Liberal hold Swing

[25]

Warbreck

Warbreck
PartyCandidateVotes%±%
Liberal Democrats Jean Seddon1,38045.2%
Labour Ann-Marie O'Bryne1,35344.3
Liberal Linda Roberts1856.1
Conservative Paul Barber1354.4
Majority270.9
Registered electors 11,199
Turnout 3,05327
Rejected ballots33
Liberal Democrats hold Swing

[26]

Wavertree

Wavertree
PartyCandidateVotes%±%
Liberal Democrats Steve Hurst1,92864.5%
Labour Claire Wilner55318.5
Green Julie Birch-Holt2608.7
Conservative David Grundy1424.7
Liberal Susan O'Brien1073.6
Majority1,37546.0
Registered electors 10,782
Turnout 2,99028
Rejected ballots11
Liberal Democrats hold Swing

[27]

West Derby

West Derby
PartyCandidateVotes%±%
Liberal Democrats Stuart Monkcom1,41649.5%
Labour Ronald Foy65222.8
Conservative Geoffrey Brandwood30810.8
Liberal Stephen Houghland2227.8
Green Ian Graham2047.1
Socialist Labour Stephen Hill592.1
Majority76426.7
Registered electors 11,345
Turnout 2,86125
Rejected ballots7
Liberal Democrats hold Swing

[28]

Woolton

Woolton
PartyCandidateVotes%±%
Liberal Democrats Malcolm Kelly1,95956.3%
Conservative Stephen Fitzsimmons 75221.6
Labour Laurence Freeman45913.2
Green Alexander Rudkin1885.4
Liberal Maria Langley1243.6
Majority1,20734.7
Registered electors 10,548
Turnout 3,48233
Rejected ballots10
Liberal Democrats hold Swing

[29]

Yew Tree

Yew Tree
PartyCandidateVotes%±%
Liberal Democrats Roger Johnston1,08942.4%
Labour Barbara Murray1,07641.9
Conservative Brian Jones2027.9
Liberal Tracey Hawksford1977.7
Majority130.5
Registered electors 11,290
Turnout 2,56723
Rejected ballots9
Liberal Democrats hold Swing

[30]

By Elections

Speke-Garston 8 March 2007

Speke-Garston By-Election 8 March 2007 [31]
PartyCandidateVotes%±%
Labour Colin Strickland1,98454%-5.0
Liberal Democrats Lynnie Williams1,21833.3+1.8
BNP Steven Greenhalgh2817.7+7.7
Green Cherry Fitzsimmons681.9-2.0
Conservative Brenda Coppell541.5-1.5
UKIP Mark Bill491.3+1.3
Majority76621.0
Registered electors
Turnout 3,65428.7
Rejected ballots
Labour gain from Liberal Democrats Swing

Related Research Articles

<span class="mw-page-title-main">Liverpool City Council</span> Local government body in England

Liverpool City Council is the governing body for the city of Liverpool in Merseyside, England. It consists of 85 councillors, for the city's 64 wards. Following a review by the Local Government Boundary Commission the number of wards increased to 64 at the elections on Thursday 4th May 2023. Three wards elect 3 councillors each, fifteen wards elect 2 councillors each and the remaining 46 wards each elect a single councillor, which brought down the total number of councillors to 85.

<span class="mw-page-title-main">City of Liverpool (New South Wales)</span> Local government area in New South Wales, Australia

The City of Liverpool is a local government area, administered by Liverpool City Council, located in the south-west of Sydney, in the state of New South Wales, Australia. The area encompasses 305.5 square kilometres (118.0 sq mi) and its administrative centre is located in the suburb of Liverpool.

<span class="mw-page-title-main">2006 West Lancashire District Council election</span>

The 2006 West Lancashire District Council election took place on 4 May 2006 to elect members of West Lancashire District Council in Lancashire, England. One third of the council was up for election and the Conservative party stayed in overall control of the council.

<span class="mw-page-title-main">Greenbank (ward)</span> Former ward of Liverpool City Council (UK)

Greenbank was an electoral district of Liverpool City Council between 2004 and 2023.

<span class="mw-page-title-main">2007 Liverpool City Council election</span> 2007 UK local government election

Elections to Liverpool City Council were held on 3 May 2007. One third of the council was up for election and the Liberal Democrat party kept overall control of the council. Overall turnout was 27.5%

<span class="mw-page-title-main">2008 Liverpool City Council election</span>

Elections to Liverpool City Council were held on 1 May 2008. One third of the council was up for election.

The 2002 Halton Borough Council election took place on 2 May 2002 to elect members of Halton Unitary Council in Cheshire, England. One third of the council was up for election and the Labour Party stayed in overall control of the council.

The 2006 Halton Borough Council election took place on 4 May 2006 to elect members of Halton Unitary Council in Cheshire, England. One third of the council was up for election and the Labour party stayed in overall control of the council.

<span class="mw-page-title-main">2010 Liverpool City Council election</span>

Elections to Liverpool City Council were held on 6 May 2010. One third of the council was up for election.

<span class="mw-page-title-main">2012 United Kingdom local elections</span> Elections that were held across England, Scotland and Wales

The 2012 United Kingdom local elections were held across England, Scotland and Wales on 3 May 2012. Elections were held in 128 English local authorities, all 32 Scottish local authorities and 21 of the 22 Welsh unitary authorities, alongside three mayoral elections including the London mayoralty and the London Assembly. Referendums were also held in 11 English cities to determine whether or not to introduce directly elected mayors.

<span class="mw-page-title-main">Wirral Council</span> Local authority in England

Wirral Council is the local authority of the Metropolitan Borough of Wirral in Merseyside, England. Wirral is a metropolitan borough, one of five in Merseyside, and provides the majority of local government services in Wirral. The council is a constituent member of the Liverpool City Region Combined Authority.
<span class="mw-page-title-main">Marie Rimmer</span> British Labour politician

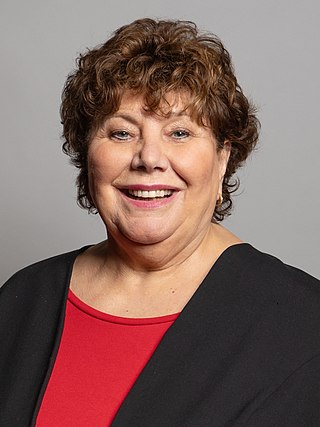
Marie Elizabeth Rimmer, is a British Labour Party politician. She has previously been a local councillor for St Helens Metropolitan Borough Council in Merseyside, England, and has served as Labour leader of the council three times between 1978 and 2014. She has recently been the Member of Parliament (MP) for St Helens South and Whiston since 2015.

Elections to Liverpool City Council were held on 1 November 1933. One third of the council seats were up for election, the term of office of each councillor being three years.

Elections to Liverpool City Council were held on 1 November 1926.

Elections to Liverpool City Council were held on 1 November 1920.

Elections to Liverpool City Council were held on 1 November 1910.

Elections to Liverpool City Council were held on 1 November 1904.

Elections to Liverpool City Council were held on Saturday 1 November 1902.

Elections to Liverpool City Council were held on Thursday 1 November 1898. One third of the council seats were up for election, the term of office of each councillor being three years.

Elections to Liverpool City Council were due to be held on 2 November 1914.

References

  1. "Allerton and Hunts Cross". Liverpool City Council elections 2006. Retrieved 18 April 2017.
  2. "Anfield". Liverpool City Council elections 2006. Retrieved 18 April 2017.
  3. "Belle Vale". Liverpool City Council elections 2006. Retrieved 18 April 2017.
  4. "Central". Liverpool City Council elections 2006. Retrieved 18 April 2017.
  5. "Childwall". Liverpool City Council elections 2006. Retrieved 18 April 2017.
  6. "Church". Liverpool City Council elections 2006. Retrieved 18 April 2017.
  7. "Clubmoor". Liverpool City Council elections 2006. Retrieved 18 April 2017.
  8. "County". Liverpool City Council elections 2006. Retrieved 18 April 2017.
  9. "Cressington". Liverpool City Council elections 2006. Retrieved 18 April 2017.
  10. "Croxteth". Liverpool City Council elections 2006. Retrieved 18 April 2017.
  11. "Everton". Liverpool City Council elections 2006. Retrieved 18 April 2017.
  12. "Fazakerley". Liverpool City Council elections 2006. Retrieved 18 April 2017.
  13. "Greenbank". Liverpool City Council elections 2006. Retrieved 18 April 2017.
  14. "Kensington and Fairfield". Liverpool City Council elections 2006. Retrieved 18 April 2017.
  15. "Kirkdale". Liverpool City Council elections 2006. Retrieved 18 April 2017.
  16. "Knotty Ash". Liverpool City Council elections 2006. Retrieved 18 April 2017.
  17. "Mossley Hill". Liverpool City Council elections 2006. Retrieved 18 April 2017.
  18. "Norris Green". Liverpool City Council elections 2006. Retrieved 18 April 2017.
  19. "Old Swan". Liverpool City Council elections 2006. Retrieved 18 April 2017.
  20. "Picton". Liverpool City Council elections 2006. Retrieved 18 April 2017.
  21. "Princes Park". Liverpool City Council elections 2006. Retrieved 18 April 2017.
  22. "Riverside". Liverpool City Council elections 2006. Retrieved 18 April 2017.
  23. "St Michaels". Liverpool City Council elections 2006. Retrieved 18 April 2017.
  24. "Speke-Garston". Liverpool City Council elections 2006. Retrieved 18 April 2017.
  25. "Tuebrook and Stoneycroft". Liverpool City Council elections 2006. Retrieved 18 April 2017.
  26. "Warbreck". Liverpool City Council elections 2006. Retrieved 18 April 2017.
  27. "Wavertree". Liverpool City Council elections 2006. Retrieved 18 April 2017.
  28. "West Derby". Liverpool City Council elections 2006. Retrieved 18 April 2017.
  29. "Woolton". Liverpool City Council elections 2006. Retrieved 18 April 2017.
  30. "Yew Tree". Liverpool City Council elections 2006. Retrieved 18 April 2017.
  31. "Labour snatch seat from Lib-Dems". Liverpool Daily Post. 9 March 2007. p. 2.