2004 Wigan Metropolitan Borough Council election

Last updated

Map of the results of the 2004 Wigan council election. Labour in red, Community Action Party in green, Liberal Democrats in yellow and Conservatives in blue. Wigan UK local election 2004 map.svg
Map of the results of the 2004 Wigan council election. Labour in red, Community Action Party in green, Liberal Democrats in yellow and Conservatives in blue.

Elections to Wigan Council were held on 10 June 2004. The whole council was up for election with boundary changes since the last election in 2003 increasing the number of councillors by three. [1] The Labour Party kept overall control of the council. [2] [3] [4]

Contents

Election result

Wigan Local Election Result 2004
PartySeatsGainsLossesNet gain/lossSeats %Votes %Votes+/−
  Labour 4200056.041.635,360-8.1%
  Community Action 1800024.024.420,761+10.5%
  Liberal Democrats 800010.710.48,805-3.7%
  Conservative 70009.317.314,686+0.3%
  BNP 00000.02.21,831+0.4%
  Independent 00000.01.71,457+1.7%
  Green 00000.01.41,180+1.4%

This result had the following consequences for the total number of seats on the Council after the elections:

PartyPrevious councilNew council
Labour6042
Community Action518
Liberal Democrat48
Conservative37
BNP00
Independent00
Green00
Total7275
Working majority 48  9 

Ward results

Abram [2] [3] [4]
PartyCandidateVotes%±%
Labour Audrey Bennett 1,809 58.1 N/A
Labour Eunice Smethurst 1,686
Labour Carl Sweeney 1,629
BNP Dennis Shambley64720.8N/A
Conservative Marion Green62520.1N/A
Rejected ballots311.0N/A
Majority98237.3N/A
Turnout 3,11231.7N/A
Labour win (new seat)
Ashton [2] [3] [4]
PartyCandidateVotes%±%
Community Action Paul Tushingham 2,366 57.8 N/A
Community Action Walter Carney 2,302
Community Action Claire Daington 2,229
Labour Nigel Ash1,30231.8N/A
Labour Barry Hampson1,029
Labour Frederick Lever1,012
Conservative Marie Winstanley4029.8N/A
Rejected ballots220.5N/A
Majority92726.0N/A
Turnout 4,09244.6N/A
Community Action win (new seat)
Aspull, New Springs, Whelley [2] [3] [4]
PartyCandidateVotes%±%
Labour John Hilton 1,758 52.2 N/A
Labour Christopher Ready 1,744
Liberal Democrats Jean Beswick 1,528 45.3 N/A
Labour James Roberts1,519
Liberal Democrats Alan Robinson1,134
Liberal Democrats Christopher Thomas1,030
Rejected ballots842.5N/A
Majority96.8N/A
Turnout 3,37034.6N/A
Labour win (new seat)
Liberal Democrats win (new seat)
Astley Mosley Common [2] [3] [4]
PartyCandidateVotes%±%
Labour Brian Wilson 1,501 39.8 N/A
Liberal Democrats Glynnis Hogg 1,367 36.2 N/A
Liberal Democrats Joseph Haley 1,259
Liberal Democrats John Stackhouse1,173
Labour John Lea1,122
Labour Alan Stephenson1,095
Green Ian Davies87023.0N/A
Rejected ballots371.0N/A
Majority1373.5N/A
Turnout 3,77539.6N/A
Labour win (new seat)
Liberal Democrats win (new seat)
Atherleigh [2] [3] [4]
PartyCandidateVotes%±%
Labour Susan Loudon 1,219 48.4 N/A
Labour Mark Aldred 1,214
Labour Anne Turnock 1,207
Community Action Francis Myler68327.1N/A
Community Action Patricia Myler680
Conservative Ann Davies58423.2N/A
Community Action Gladys Wilkes442
Rejected ballots331.3N/A
Majority52421.3N/A
Turnout 2,51933.7N/A
Labour win (new seat)
Atherton [2] [3] [4]
PartyCandidateVotes%±%
Liberal Democrats Robert Splaine 1,705 42.9 N/A
Liberal Democrats David Higginbottom 1,525
Labour Karen Aldred 1,487 37.5 N/A
Liberal Democrats Andrew Moore1,414
Labour Philip Loudon1,320
Labour Reginald Holmes1,292
Conservative Malcolm Parr44911.3N/A
Green Nicholas Redmond3107.8N/A
Rejected ballots190.5N/A
Majority735.5N/A
Turnout 3,97036.3N/A
Liberal Democrats win (new seat)
Labour win (new seat)
Bryn [2] [3] [4]
PartyCandidateVotes%±%
Community Action John Hodgkinson 2,370 60.2 N/A
Community Action Gary Wilkes 2,297
Community Action Brian Merry 2,239
Labour Mildred Millington1,23331.3N/A
Labour Alan Melling1,183
Labour William Evans986
Conservative William Winstanley3238.2N/A
Rejected ballots110.3N/A
Majority1,00628.9N/A
Turnout 3,93742.3N/A
Community Action win (new seat)
Douglas [2] [3] [4]
PartyCandidateVotes%±%
Labour Joy Birch 1,427 51.3 N/A
Labour Christine Hitchen 1,347
Labour Margaret Coghlin 1,318
Community Action Lucy Beale1,29646.6N/A
Community Action Robert Beale1,287
Community Action Janette Thomas1,223
Rejected ballots612.2N/A
Majority1314.7N/A
Turnout 2,78430.2N/A
Labour win (new seat)
Golborne and Lowton West [2] [3] [4]
PartyCandidateVotes%±%
Community Action Peter Franzen 1,639 49.4 N/A
Community Action Kevin Williams 1,414
Community Action Peter Solinas 1,413
Labour David Kelly1,29839.1N/A
Labour Martin King1,258
Labour Gerard Bretherton1,216
Conservative Rosina Oxley35510.7N/A
Rejected ballots240.7N/A
Majority11510.3N/A
Turnout 3,31638.3N/A
Community Action win (new seat)
Hindley [2] [3] [4]
PartyCandidateVotes%±%
Labour Alfred Robinson 1,578 39.1 N/A
Community Action James Ellis 1,153 28.6 N/A
Community Action Dorothy Grace 1,134
Labour John Holland1,041
Labour Stephen Murphy1,024
Independent David Culshaw87421.7N/A
Community Action Edward Houlton614
Conservative Dorothy Angell40310.0N/A
Rejected ballots250.6N/A
Majority9310.5N/A
Turnout 4,03345.1N/A
Labour win (new seat)
Community Action win (new seat)
Hindley Green [2] [3] [4]
PartyCandidateVotes%±%
Labour William Simmons 1,272 35.0 N/A
Community Action Robert Brierley 1,264 34.8 N/A
Community Action Barry Fagan 1,231
Labour Gordon Jackson898
Labour John Phillips895
Community Action Adele Wilkes750
Independent John Vickers58316.0N/A
Conservative Andre Walker48913.5N/A
Rejected ballots250.7N/A
Majority3330.2N/A
Turnout 3,63342.0N/A
Labour win (new seat)
Community Action win (new seat)
Ince [2] [3] [4]
PartyCandidateVotes%±%
Labour David Molyneux 1,494 66.5 N/A
Labour Joan Hurst 1,368
Labour James Moodie 1,132
Community Action Constantine Winstanley69430.9N/A
Community Action Robert Hall667
Community Action David Hall651
Rejected ballots592.6N/A
Majority43835.6N/A
Turnout 2,24726.3N/A
Labour win (new seat)
Leigh East [2] [3] [4]
PartyCandidateVotes%±%
Labour Keith Cunliffe 1,407 46.5 N/A
Labour Brian Jarvis 1,299
Labour Frederick Walker 1,081
Community Action Stuart Winstanley94331.2N/A
Community Action Peter O'Connell843
Conservative Derek Davies64421.3N/A
Community Action Natalie Franzen595
Rejected ballots301.0N/A
Majority13815.3N/A
Turnout 3,02434.1N/A
Labour win (new seat)
Leigh South [2] [3] [4]
PartyCandidateVotes%±%
Labour Keith Anderson 1,547 40.6 N/A
Labour John O'Brien 1,465
Labour Charles Rigby 1,429
Community Action Stephen Ellison1,17530.9N/A
Community Action Janice Solinas1,094
Community Action Irene Franzen1,041
Conservative Andrew Oxley1,03027.1N/A
Rejected ballots541.4N/A
Majority2549.8N/A
Turnout 3,80637.2N/A
Labour win (new seat)
Leigh West [2] [3] [4]
PartyCandidateVotes%±%
Labour Barbara Jarvis 1,708 58.1 N/A
Labour Myra Whiteside 1,624
Labour Peter Smith 1,506
Community Action Daniel Burrows66922.7N/A
Community Action Yvonne Lavelle549
BNP Richard Close51317.4N/A
Community Action Ian Franzen508
Rejected ballots511.7N/A
Majority83735.3N/A
Turnout 2,94127.7N/A
Labour win (new seat)
Lowton East [2] [3] [4]
PartyCandidateVotes%±%
Community Action Ian Franzen 1,793 44.6 N/A
Community Action Jonathan Miller 1,730
Community Action James Lavelle 1,516
Labour Lynne Liptrot1,28932.0N/A
Labour Eric Waterworth1,179
Labour Christine Cottam1,062
Conservative James Grundy87921.8N/A
Conservative Jeanette Leigh792
Conservative Alan Lowe647
Rejected ballots631.6N/A
Majority22712.5N/A
Turnout 4,02440.9N/A
Community Action win (new seat)
Orrell [2] [3] [4]
PartyCandidateVotes%±%
Conservative Richard Clayton 1,747 39.4 N/A
Conservative Michael Winstanley 1,520
Labour Ernest Swift 1,402 31.6 N/A
Labour Michael Barnes1,381
Labour Rodney Stockwell1,313
Conservative Hazel Shields1,285
BNP Charles Mather67115.1N/A
Community Action Alan Freeman59513.4N/A
Community Action Tracy Lavelle420
Community Action Sean Ashdown395
Rejected ballots190.4N/A
Majority1177.8N/A
Turnout 4,43449.5N/A
Conservative win (new seat)
Labour win (new seat)
Pemberton [2] [3] [4]
PartyCandidateVotes%±%
Labour Jeanette Prescott 1,419 46.7 N/A
Labour Barbara Bourne 1,381
Labour Paul Prescott 1,314
Community Action Margaret Crank1,14037.5N/A
Community Action William Burrows1,096
Community Action John Hulme1,025
Conservative Jonathan Cartwright43914.5N/A
Rejected ballots381.3N/A
Majority1749.2N/A
Turnout 3,03631.1N/A
Labour win (new seat)
Shevington with Lower Ground [2] [3] [4]
PartyCandidateVotes%±%
Labour John O'Neill 1,843 45.3 N/A
Labour David Brown 1,468
Labour Michael Crosby 1,461
Conservative Elizabeth Beasleigh1,45635.8N/A
Conservative Deborah Fairhurst1,288
Conservative Barry Alder1,191
Liberal Democrats Martin Sutton73918.2N/A
Liberal Democrats Freda Graham664
Liberal Democrats Solveiq Gaber607
Rejected ballots310.8N/A
Majority59.5N/A
Turnout 4,06944.0N/A
Labour win (new seat)
Standish with Langtree [2] [3] [4]
PartyCandidateVotes%±%
Labour George Davies 1,383 34.7 N/A
Conservative George Fairhurst 1,325 33.2 N/A
Conservative Jessica Downer 1,278
Liberal Democrats Raymond Murphy1,25431.4N/A
Liberal Democrats Trevor Beswick1,202
Labour Thomas Morris1,197
Conservative Barry Woolley1,185
Liberal Democrats Maureen Garner1,066
Labour Michael McLoughlin953
Rejected ballots290.7N/A
Majority241.5N/A
Turnout 3,99142.5N/A
Labour win (new seat)
Conservative win (new seat)
Tyldesley [2] [3] [4]
PartyCandidateVotes%±%
Liberal Democrats Neil Hogg 2,212 54.7 N/A
Liberal Democrats Keith McManus 1,976
Liberal Democrats Richard Derricutt 1,768
Labour Stephen Hellier1,35033.4N/A
Labour David Boydell1,212
Labour Richard Evans1,027
Conservative Deborah Woodcock45711.3N/A
Rejected ballots230.6N/A
Majority41821.3N/A
Turnout 4,04240.1N/A
Liberal Democrats win (new seat)
Wigan Central [2] [3] [4]
PartyCandidateVotes%±%
Conservative Henry Cadman 2,130 54.1 N/A
Conservative James Davies 2,089
Conservative Gareth Fairhurst 1,961
Labour Richard Walsh1,69443.0N/A
Labour Susan Turner1,668
Labour John Ball1,502
Rejected ballots1162.9N/A
Majority26711.1N/A
Turnout 3,94043.2N/A
Conservative win (new seat)
Wigan West [2] [3] [4]
PartyCandidateVotes%±%
Labour Terence Halliwell Uncontested N/AN/A
Labour Joe Shaw Uncontested N/AN/A
Labour David Willis Uncontested N/AN/A
Labour win (new seat)
Winstanley [2] [3] [4]
PartyCandidateVotes%±%
Community Action Stanley Barnes 1,810 48.3 N/A
Labour Rona Winkworth 1,393 37.2 N/A
Community Action William Wilkes 1,330
Community Action Ronald Barnes1,299
Labour Philip Kelly1,000
Labour Robin Atkinson993
Conservative Matthew Sephton52514.0N/A
Rejected ballots160.4N/A
Majority33011.1N/A
Turnout 3,74442.6N/A
Community Action win (new seat)
Labour win (new seat)
Community Action win (new seat)
Worsley Mesnes [2] [3] [4]
PartyCandidateVotes%±%
Labour Joseph Baldwin 1,547 48.9 N/A
Labour William Rotherham 1,540
Labour Wilfred Brogan 1,498
Community Action Susan Barnes1,17137.0N/A
Community Action William Barnes1,115
Community Action Stephen Wilkes966
Conservative Thomas Sutton42413.4N/A
Rejected ballots240.8N/A
Majority32711.9N/A
Turnout 3,16636.0N/A
Labour win (new seat)

By-elections between 2004 and 2006

Douglas By-Election 16 June 2005 [5] [6]
PartyCandidateVotes%±%
Labour Michael Dewhurst91648.5-2.8
Community Action Robert Beale78841.8-4.8
Conservative Jean Peet1015.4+5.4
BNP Dennis Shambley472.5+2.5
UKIP Gregory Atherton351.9+1.9
Majority1286.7+2.0
Turnout 1,88720.4-9.8
Labour hold Swing +1.0

Related Research Articles

Dacorum Borough Council in Hertfordshire, England is elected every four years. Since the last boundary changes in 2007, 51 councillors have been elected from 25 wards.

Cornwall Council in England, UK, was established in 2009 and is elected every four years. From 1973 to 2005 elections were for Cornwall County Council, with the first election for the new unitary Cornwall Council held in June 2009. This election saw 123 members elected, replacing the previous 82 councillors on Cornwall County Council and the 249 on the six district and borough councils. In June 2013 the Local Government Boundary Commission for England announced a public consultation on its proposal that Cornwall Council should have 87 councillors in future.

One third of Crawley Borough Council in West Sussex, England is elected each year, followed by one year without election. Since the last boundary changes in 2019, 36 councillors have been elected from 13 wards.

<span class="mw-page-title-main">1998 Wigan Metropolitan Borough Council election</span> 1998 UK local government election

Elections to Wigan Council were held on 7 May 1998. One third of the council was up for election. Following the previous election there had been three by-elections held—in Aspull-Standish, Ince and Hope Carr—with all three successfully defended by Labour.

<span class="mw-page-title-main">1999 Wigan Metropolitan Borough Council election</span> 1999 UK local government election

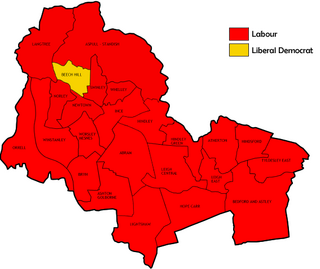
Elections to Wigan Council were held on 6 May 1999. One-third of the council was up for election. Prior to the election, the Liberal Democrats had gained the seat being fought in Beech Hill from Labour in a by-election, and long-time Labour councillor for Atherton, Jack Sumner, had defected to independent.

<span class="mw-page-title-main">2000 Wigan Metropolitan Borough Council election</span> 2000 UK local government election

Elections to Wigan Borough Council were held on 4 May 2000. One-third of the council was up for election, as well as an extra vacancy in Norley - both of which were uncontested. Since the election, there had been a by-election in which the Liberal Democrats gained the seat being fought in Hindsford from Labour.

<span class="mw-page-title-main">2002 Wigan Metropolitan Borough Council election</span> 2002 UK local government election

Elections to Wigan Council were held on 2 May 2002, with one-third of the council to be re-elected. There had been a number of by-elections in the gap year, with a Labour gain from the Liberal Democrats in Hindsford, effectively cancelling out an earlier loss to them in Atherton. A Labour hold in Hope Carr in-between left both parties unchanged going into the election.

<span class="mw-page-title-main">2003 Wigan Metropolitan Borough Council election</span> 2003 UK local government election

Elections to Wigan Borough Council were held on 1 May 2003 with one-third of the council was up for election. Prior to the election, there had been two vacancies in Leigh Central, with Labour winning a by-election in June and the seat being fought in this election filled unopposed by Barbara Jarvis.

South Oxfordshire District Council, a non-metropolitan district council in Oxfordshire, England is elected every four years.

<span class="mw-page-title-main">2006 Wigan Metropolitan Borough Council election</span> 2006 UK local government election

Elections to Wigan Council were held on 4 May 2006. One-third of the council was up for election and the Labour party kept overall control of the council. Overall turnout was 29.2%.

<span class="mw-page-title-main">Enfield London Borough Council elections</span> UK local elections

Enfield London Borough Council in London, England is elected every four years. Since the last boundary changes in 2022, 63 councillors have been elected from 25 wards.

Elections to Maidstone Borough Council in Kent, United Kingdom are held each year to elect one-third of its members, followed by one year without election. Since the last boundary changes in 2002, 55 councillors have been elected from 26 wards. From 2023 onwards, the format of elections will change, with all 55 councillors being elected once every 4 years.

<span class="mw-page-title-main">2008 Wigan Metropolitan Borough Council election</span> 2008 UK local government election

Elections to Wigan Council were held on 1 May 2008. One-third of the council was up for election.

Erewash Borough Council elections are held every four years. Erewash Borough Council is the local authority for the non-metropolitan district of Erewash in Derbyshire, England. Since the last boundary changes in 2015, 47 councillors are elected from 19 wards.

<span class="mw-page-title-main">2007 Wigan Metropolitan Borough Council election</span>

Elections to Wigan Council were held on 3 May 2007 with one third of the seats up for election.

<span class="mw-page-title-main">2010 Wigan Metropolitan Borough Council election</span> 2010 UK local government election

Elections to Wigan Council were held on 6 May 2010. One-third of the council was up for election.

<span class="mw-page-title-main">1996 Wigan Metropolitan Borough Council election</span>

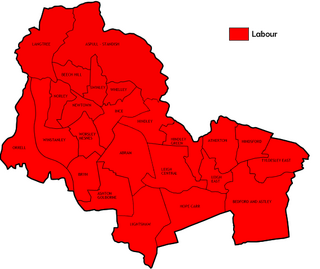
Elections to Wigan council were held on Thursday, 2 May 1996, with an extra vacancy in Abram to be filled. Going into the election there were noticeably fewer candidates than usual, with the total candidate number and the five uncontested wards only narrowly lower than the all-time lows set at the 1990 election. This was mainly caused by the lack of any minor party candidates, and the Liberal Democrat slate dropping by half upon the previous election, to seven - their scarcest outing since their lowest ebb throughout their merger in 1990, but more reminiscent of their patchy participation of the seventies. Turnout had been consistently poor in recent elections, and this election continued the downward trend, dropping below a quarter of the electorate for the second time to 24.2%.

<span class="mw-page-title-main">2004 Leeds City Council election</span>

The 2004 Leeds City Council election took place on 10 June 2004 to elect members of City of Leeds Metropolitan Borough Council in England.

<span class="mw-page-title-main">2003 City of Bradford Metropolitan District Council election</span> 2003 UK local government election

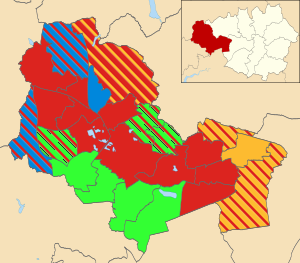
Elections to City of Bradford Metropolitan District Council were held on 1 May 2003. Before the election, Wibsey Labour councillor, Keith Thomson, had defected to Independent. One third of the council was up for election, and it remained under no overall control.

<span class="mw-page-title-main">2004 City of Bradford Metropolitan District Council election</span>

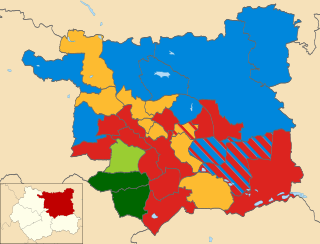
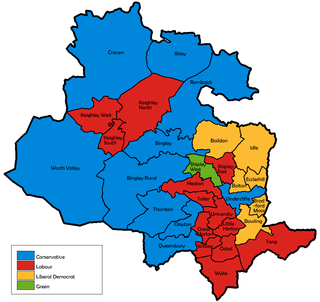
Elections to City of Bradford Metropolitan District Council were held on 10 June 2004. The whole council was up for election following boundary changes. The council stayed under no overall control.

References

  1. "Wigan council". BBC News Online . Retrieved 17 December 2009.
  2. 1 2 3 4 5 6 7 8 9 10 11 12 13 14 15 16 17 18 19 20 21 22 23 24 25 26 "Wigan Council results from 1973 to 2008" (PDF). wigan.gov.uk. Archived from the original (PDF) on 20 November 2011. Retrieved 30 January 2012.
  3. 1 2 3 4 5 6 7 8 9 10 11 12 13 14 15 16 17 18 19 20 21 22 23 24 25 26 "Local Election Results 10 June 2004". wiganmbc.gov.uk. Retrieved 28 June 2012.
  4. 1 2 3 4 5 6 7 8 9 10 11 12 13 14 15 16 17 18 19 20 21 22 23 24 25 26 "Local Elections Archive Project: 2004 - Wigan". andrewteale.me.uk. Retrieved 28 June 2012.
  5. "Labour lead narrows in London byelections". The Guardian . 17 June 2005. Retrieved 14 March 2010.
  6. "Local Authority Byelection Results". gwydir.demon.co.uk. Archived from the original on 29 March 2010. Retrieved 13 June 2012.