| |||||||||||||||||||||||||||||||||||||||||
16 out of 48 seats to Preston City Council 25 seats needed for a majority | |||||||||||||||||||||||||||||||||||||||||
---|---|---|---|---|---|---|---|---|---|---|---|---|---|---|---|---|---|---|---|---|---|---|---|---|---|---|---|---|---|---|---|---|---|---|---|---|---|---|---|---|---|
Turnout | 107,500, 25.9% [1] | ||||||||||||||||||||||||||||||||||||||||
| |||||||||||||||||||||||||||||||||||||||||
|
The 2024 Preston City Council election took place on 2 May 2024 to elect members of Preston City Council in Lancashire, England. [2] This was on the same day as other local elections across England, and Lancashire's Police and Crime Commissioner election.
As is typical for Preston's council elections, sixteen seats of the forty-eight total were contested. [3] Labour have had majority control of the council for most of the council's existence, including from 2011 following a period of no overall control, and remained with a comfortable majority when the results were announced. However, the Liberal Democrats enjoyed a successful election, nearly doubling their seat count after taking several seats from the Conservatives [4] and becoming the main opposition in Preston City Council. In addition, in a shock result the Liberal Democrats took a seat from Labour in the Lea and Larches ward, unseating then-cabinet member for health and wellbeing (and acting county council Labour opposition group leader) Jennifer Mein by a mere 13 votes following a recount. [5]
The majority of contested seats were fought only by Labour, the Conservatives and the Liberal Democrats; however in five wards, independent runners or the parities Reform UK and the Trade Unionist and Socialist Coalition also stood although none of these were successful in gaining a seat. Unlike last year, the Green Party did not stand in any seats.
Following the election the leader of the Preston Conservatives Sue Whittam announced her resignation as leader. [6]
2024 Preston City Council election | ||||||||||
---|---|---|---|---|---|---|---|---|---|---|
Party | This election | Full council | This election | |||||||
Seats | Net | Seats % | Other | Total | Total % | Votes | Votes % | +/− | ||
Labour | 9 | 1 | 56.25 | 21 | 30 | 62.5 | ||||
Liberal Democrats | 6 | 5 | 37.50 | 6 | 12 | 25.0 | ||||
Conservative | 1 | 4 | 6.25 | 5 | 6 | 12.5 | ||||
Independent | 0 | 0 | 0.0 | 0 | 0 | 0.0 | ||||
Reform UK | 0 | 0 | 0.0 | 0 | 0 | 0.0 | ||||
TUSC | 0 | 0 | 0.0 | 0 | 0 | 0.0 | ||||
The Statements of Persons Nominated was released by Preston Council on 8 April 2024 following the close of nominations. [2] The results were announced a day after the election. [1] Incumbent councillors that stood for re-election are marked with an asterisk (*).
Party | Candidate | Votes | % | ±% | |
---|---|---|---|---|---|
Labour | James Hull* | 1,012 | 58.8 | -4.0 | |
Liberal Democrats | Rebecca Potter | 369 | 21.5 | +9.8 | |
Conservative | Daniel Duckworth | 339 | 19.7 | -1.5 | |
Rejected ballots | 41 | 2.3 | |||
Majority | |||||
Turnout | 1,762 | 27.20 | |||
Labour hold | Swing | ||||
Party | Candidate | Votes | % | ±% | |
---|---|---|---|---|---|
Labour | Sara Holmes | 673 | 66.5 | -5.1 | |
Liberal Democrats | Edward Craven | 198 | 19.6 | +10.9 | |
Conservative | Al-Yasa Khan | 141 | 13.9 | -5.2 | |
Rejected ballots | 55 | 5.1 | |||
Majority | |||||
Turnout | 1,070 | 18.81 | |||
Labour hold | Swing | ||||
Party | Candidate | Votes | % | ±% | |
---|---|---|---|---|---|
Liberal Democrats | Julie van Mierlo | 908 | 48.3 | -7.2 | |
Labour | Jono Grisdale | 497 | 26.4 | -1.0 | |
Conservative | Sarah Hart | 319 | 17.0 | ±0.0 | |
Independent | Paul Balshaw | 156 | 8.3 | N/A | |
Rejected ballots | 26 | 1.4 | |||
Majority | |||||
Turnout | 1,906 | 29.75 | |||
Liberal Democrats hold | Swing | ||||
Party | Candidate | Votes | % | ±% | |
---|---|---|---|---|---|
Labour Co-op | Salim Desai* | 880 | 58.4 | -8.1 | |
Conservative | Andy Pratt | 318 | 21.1 | +5.6 | |
Liberal Democrats | Peter Lawrence | 308 | 20.5 | +11.1 | |
Rejected ballots | 110 | 6.8 | |||
Majority | |||||
Turnout | 1,616 | 18.95 | |||
Labour Co-op hold | Swing | ||||
Party | Candidate | Votes | % | ±% | |
---|---|---|---|---|---|
Labour | Siraz Natha* | 849 | 50.9 | -35.4 | |
TUSC | Hasan Tunay | 522 | 31.3 | N/A | |
Liberal Democrats | Jurgen Voges | 176 | 10.6 | +4.0 | |
Conservative | Nilli Williamson | 120 | 7.2 | +1.1 | |
Rejected ballots | 195 | 10.5 | |||
Majority | |||||
Turnout | 1,863 | 28.13 | |||
Labour hold | Swing | ||||
Party | Candidate | Votes | % | ±% | |
---|---|---|---|---|---|
Labour Co-op | Martyn Rawlinson* | 924 | 61.1 | -10.7 | |
Liberal Democrats | Alana Mullen | 387 | 25.6 | +19.9 | |
Conservative | Ishaq Vaez | 201 | 13.3 | -9.2 | |
Rejected ballots | 151 | 9.1 | |||
Majority | |||||
Turnout | 1,663 | 27.54 | |||
Labour Co-op hold | Swing | ||||
Party | Candidate | Votes | % | ±% | |
---|---|---|---|---|---|
Labour | Peter Kelly* | 967 | 53.8 | -7.8 | |
Liberal Democrats | Claire Craven | 465 | 25.9 | +10.8 | |
Conservative | Lakwinder Singh | 365 | 20.3 | -2.4 | |
Rejected ballots | 190 | 9.6 | |||
Majority | |||||
Turnout | 1,986 | 30.02 | |||
Labour hold | Swing | ||||
Party | Candidate | Votes | % | ±% | |
---|---|---|---|---|---|
Liberal Democrats | Michael Peak | 1,029 | 47.4 | -1.0 | |
Conservative | Dave Leme Da Silva | 624 | 28.7 | +2.4 | |
Labour | Avery Greatorex | 519 | 23.9 | -1.1 | |
Rejected ballots | 85 | 3.8 | |||
Majority | |||||
Turnout | 2,257 | 35.73 | |||
Liberal Democrats gain from Conservative | Swing | ||||
Party | Candidate | Votes | % | ±% | |
---|---|---|---|---|---|
Liberal Democrats | Ben Ward | 861 | 43.7 | -5.0 | |
Conservative | Trevor Hart* | 550 | 27.9 | -3.1 | |
Labour | Adam Malik | 354 | 18.0 | -1.3 | |
Reform UK | David Preston | 204 | 10.4 | N/A | |
Rejected ballots | 10 | 0.5 | |||
Majority | |||||
Turnout | 1,979 | 26.30 | |||
Liberal Democrats gain from Conservative | Swing | ||||
Party | Candidate | Votes | % | ±% | |
---|---|---|---|---|---|
Liberal Democrats | Mark Jewell | 578 | 36.2 | +16.1 | |
Labour | Jenny Mein* | 565 | 35.4 | -28.8 | |
Independent | Ann Cowell | 305 | 19.1 | N/A | |
Conservative | Tracy Slater | 147 | 9.2 | -5.1 | |
Rejected ballots | 8 | 0.5 | |||
Majority | |||||
Turnout | 1,603 | 25.03 | |||
Liberal Democrats gain from Labour | Swing | ||||
Party | Candidate | Votes | % | ±% | |
---|---|---|---|---|---|
Labour | Nweeda Khan* | 838 | 62.1 | -14.0 | |
Conservative | Martin McKeever | 203 | 15.0 | +0.4 | |
Liberal Democrats | Cristina Mylroie | 172 | 12.7 | +4.4 | |
TUSC | Joel Patton | 137 | 10.1 | N/A | |
Rejected ballots | 41 | 2.9 | |||
Majority | |||||
Turnout | 1,391 | 17.28 | |||
Labour hold | Swing | ||||
Party | Candidate | Votes | % | ±% | |
---|---|---|---|---|---|
Conservative | Mark Bell* | 1,056 | 48.5 | -2.2 | |
Labour | Victoria Blundell | 698 | 32.0 | +2.8 | |
Liberal Democrats | Joanne Joyner | 425 | 19.5 | +1.1 | |
Rejected ballots | 36 | 1.6 | |||
Majority | |||||
Turnout | 2,215 | 28.01 | |||
Conservative hold | Swing | ||||
Party | Candidate | Votes | % | ±% | |
---|---|---|---|---|---|
Liberal Democrats | Daniel Guise | 869 | 47.9 | +9.7 | |
Conservative | Keith Middlebrough* | 640 | 35.3 | -8.3 | |
Labour | Taylor Donoughue-Smith | 304 | 16.8 | -2.8 | |
Rejected ballots | 22 | 1.2 | |||
Majority | |||||
Turnout | 1,835 | 27.48 | |||
Liberal Democrats gain from Conservative | Swing | ||||
Party | Candidate | Votes | % | ±% | |
---|---|---|---|---|---|
Labour Co-op | Anna Hindle* | 595 | 65.2 | -7.7 | |
Conservative | Mary Kennedy | 163 | 17.9 | +0.1 | |
Liberal Democrats | Kate Bosman | 155 | 17.0 | +7.7 | |
Rejected ballots | 28 | 3.0 | |||
Majority | |||||
Turnout | 941 | 16.45 | |||
Labour Co-op hold | Swing | ||||
Party | Candidate | Votes | % | ±% | |
---|---|---|---|---|---|
Liberal Democrats | George Kulbacki | 1,050 | 43.6 | +8.9 | |
Labour | Mark Routledge | 833 | 34.6 | -4.8 | |
Conservative | David Walker* | 523 | 21.7 | -3.8 | |
Rejected ballots | 76 | 3.1 | |||
Majority | 217 | ||||
Turnout | 2,482 | 39.32 | |||
Liberal Democrats gain from Conservative | Swing | ||||
Party | Candidate | Votes | % | ±% | |
---|---|---|---|---|---|
Labour Co-op | Suleman Sarwar* | 714 | 64.3 | -16.1 | |
Liberal Democrats | Rene van Mierlo | 244 | 22.0 | +14.1 | |
Conservative | Sohaib Ashraf | 152 | 13.7 | +2.6 | |
Rejected ballots | 146 | 11.6 | |||
Majority | |||||
Turnout | 1,256 | 20.24 | |||
Labour Co-op hold | Swing | ||||
The For Darwen Party was a local political party in Darwen, south of Blackburn, England, with a platform that Darweners were not properly represented on Blackburn with Darwen Borough Council.
The 2002 Redditch Borough Council election of 2 May 2002 elected members of Redditch Borough Council in the West Midlands region, England. One third of the council stood for re-election and the Labour Party lost overall control of the council to no overall control for the first time in many years.
The 2008 Solihull Metropolitan Borough Council election took place on 1 May 2008 to elect members of Solihull Metropolitan Borough Council in the West Midlands, England. One third of the council was up for election and the Conservative Party gained overall control of the council from no overall control.
The 2004 St Albans City and District Council election took place on 10 June 2004 to elect members of St Albans District Council in Hertfordshire, England. One third of the council was up for election and the council stayed under no overall control.
The 2006 St Albans City and District Council election took place on 4 May 2006 to elect members of St Albans District Council in Hertfordshire, England. One third of the council was up for election and the Liberal Democrats gained overall control of the council from no overall control.
The 1999 Pendle Borough Council election took place on 6 May 1999 to elect members of Pendle Borough Council in Lancashire, England. One third of the council was up for election and the Liberal Democrats lost overall control of the council to no overall control.
The 2002 Pendle Borough Council election took place on 2 May 2002 to elect members of Pendle Borough Council in Lancashire, England. The whole council was up for election with boundary changes since the last election in 2000 reducing the number of seats by 2. The council stayed under no overall control.
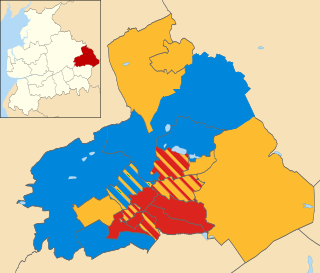
The 2006 Pendle Borough Council election took place on 4 May 2006 to elect members of Pendle Borough Council in Lancashire, England. One third of the council was up for election and the Liberal Democrats stayed in overall control of the council.
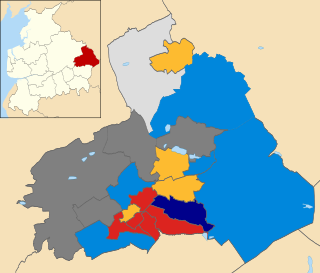
The 2008 Pendle Borough Council election took place on 1 May 2008 to elect members of Pendle Borough Council in Lancashire, England. One third of the council was up for election and the Liberal Democrats lost overall control of the council to no overall control.
Elections to Preston City Council took place on 3 May 2012, the same day as other 2012 United Kingdom local elections.
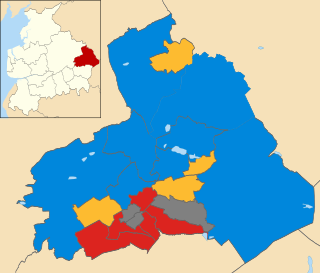
The 2011 Pendle Borough Council election took place on 5 May 2011 to elect members of Pendle Borough Council in Lancashire, England. One third of the council was up for election and the council stayed under no overall control.
The 2012 Pendle Borough Council election took place on 3 May 2012 to elect members of Pendle Borough Council in Lancashire, England. One third of the council was up for election and the council stayed under no overall control.
The 2014 Pendle Borough Council election took place on 22 May 2014 to elect members of Pendle Borough Council in Lancashire, England. One third of the council was up for election and the council stayed under no overall control.
The 2014 Brent London Borough Council election took place on 22 May 2014 to elect members of Brent London Borough Council in London, England. The whole council was up for election and the Labour Party stayed in overall control of the council.
The 2017 election to Ceredigion County Council was held on 4 May 2017 when local elections took place across Wales. It was preceded by the 2012 election and followed by the 2022 election.
Elections to Manchester City Council were held on 3 May 2018, as part of the 2018 United Kingdom local elections. Although the council is normally elected in thirds, all 96 council seats were up for election due to boundary changes. Labour retained its near-complete dominance of the council. The sole change was that the Liberal Democrats gained a second seat in Didsbury West.
The 2018 Lambeth London Borough Council election took place on 3 May 2018 alongside other local elections in London, to elect members of Lambeth London Borough Council in England. The election saw Labour remain in control of Lambeth Council with a slightly reduced majority, winning over 90% of the seats. The Green Party achieved its best-ever result in the borough, winning five seats and becoming the official opposition and the largest Green group in London.
The 2019 Guildford Borough Council election were held on 2 May 2019, to elect all 48 seats to the Guildford Borough Council in Surrey, England as part of the 2019 local elections.
Elections to Welwyn Hatfield Borough Council took place on 6 May 2021. This was on the same day as other local elections across the United Kingdom.
Elections to Colchester Borough Council took place on 5 May 2022. Eighteen members of the council were elected: one from 16 of the 17 wards, and two councillors from New Town & Christ Church ward, following the death of incumbent councillor Nick Cope, elected in 2019 and due to serve until 2023.