| |||||||||||||||||||||||||||||||||||||||||||||||||||||||||||||||||||||||||||
All 49 seats to Maidstone Borough Council 25 seats needed for a majority | |||||||||||||||||||||||||||||||||||||||||||||||||||||||||||||||||||||||||||
---|---|---|---|---|---|---|---|---|---|---|---|---|---|---|---|---|---|---|---|---|---|---|---|---|---|---|---|---|---|---|---|---|---|---|---|---|---|---|---|---|---|---|---|---|---|---|---|---|---|---|---|---|---|---|---|---|---|---|---|---|---|---|---|---|---|---|---|---|---|---|---|---|---|---|---|
| |||||||||||||||||||||||||||||||||||||||||||||||||||||||||||||||||||||||||||
Winner of each seat at the 2024 Maidstone Borough Council election | |||||||||||||||||||||||||||||||||||||||||||||||||||||||||||||||||||||||||||
|
The 2024 Maidstone Borough Council election took place on Thursday 2 May 2024, alongside the other local elections in the United Kingdom being held on the same day. All 49 members of Maidstone Borough Council in Kent were elected following boundary changes. [1]
Maidstone has spent most of its existence under no overall control. The Conservatives controlled the council until 1983, but remained the largest party until 1985 when they were overtaken by the Liberal Democrats. [2] Following the 1996 election, both Labour and the Liberal Democrats overtook the Conservatives on seats; the Conservatives regained control of the council in 2008.
The council fell into no overall control again in 2022. [3] In the most recent election, the Conservatives lost 4 seats with 32.7% of the vote, the Liberal Democrats lost 1 with 22.9%, Labour gained 1 seat with 15.6%, the Green Party gained 2 with 16.8%, and independents gained 2 with 11.3%. Following this election, the Conservatives governed as a minority with independent support. [4]
Maidstone usually elects its councillors in thirds, on a 4-year cycle. However, following boundary changes, all councillors will be elected to the new wards. [5] The change reduces the number of councillors by 6.
Old wards [6] | No. of seats | New wards | No. of seats |
---|---|---|---|
Allington | 3 | Allington and Bridge | 2 |
Barming | 1 | Barming Heath and Teston | 2 |
Bearsted | 3 | Bearsted and Downswood | 3 |
Boughton Monchelsea and Chart Sutton | 1 | Boughton Monchelsea and Chart Sutton | 1 |
Boxley | 3 | Boxley Downs | 2 |
Bridge | 2 | Coxheath and Farleigh | 2 |
Coxheath and Hunton | 3 | Fant and Oakwood | 3 |
Detling and Thurnham | 1 | Grove Green and Vinters Park | 3 |
Downswood and Otham | 1 | Harrietsham, Lenham and North Downs | 3 |
East | 3 | Headcorn and Sutton Valence | 2 |
Fant | 3 | High Street | 3 |
Harrietsham and Lenham | 2 | Leeds and Langley | 2 |
Headcorn | 2 | Loose and Linton | 2 |
Heath | 2 | Marden and Yalding | 3 |
High Street | 3 | Palace Wood | 2 |
Leeds | 1 | Park Wood and Mangravet | 2 |
Loose | 1 | Penenden Heath | 3 |
Marden and Yalding | 3 | Ringlestone | 1 |
North | 3 | Senacre | 1 |
North Downs | 1 | Shepway | 3 |
Park Wood | 2 | Staplehurst | 2 |
Shepway North | 3 | Tovil | 2 |
Shepway North | 3 | ||
Shepway South | 2 | ||
South | 3 | ||
Staplehurst | 2 | ||
Sutton Valence and Langley | 1 |
After 2023 election | Before 2024 election [7] | After 2024 election | ||||||
---|---|---|---|---|---|---|---|---|
Party | Seats | Party | Seats | Party | Seats | |||
Conservative | 24 | Conservative | 25 | Conservative | 13 | |||
Liberal Democrats | 12 | Liberal Democrats | 12 | Liberal Democrats | 12 | |||
Labour | 6 | Labour | 4 | Labour | 6 | |||
Green | 3 | Green | 3 | Green | 10 | |||
Fant & Oakwood Independents | Didn't exist | Fant & Oakwood Independents | 2 | Fant & Oakwood Independents | ||||
Independent | 10 | Independent | 9 | Independent |
Changes:
2024 Maidstone Borough Council election | ||||||||||
---|---|---|---|---|---|---|---|---|---|---|
Party | Candidates | Seats | Gains | Losses | Net gain/loss | Seats % | Votes % | Votes | +/− | |
Conservative | 49 | 13 | 0 | 0 | 12 | 26.5 | 31.9 | 26,353 | –0.8 | |
Liberal Democrats | 29 | 12 | 0 | 0 | 24.5 | 20.1 | 16,639 | –2.8 | ||
Green | 35 | 10 | 0 | 0 | 7 | 20.4 | 22.3 | 18,470 | +5.5 | |
Independent | 10 | 8 | 0 | 0 | 3 | 16.3 | 9.7 | 8,016 | –1.6 | |
Labour | 28 | 6 | 0 | 0 | 2 | 15.6 | 12.6 | 10,415 | –3.0 | |
Reform UK | 8 | 0 | 0 | 0 | 0.0 | 2.7 | 2,264 | +2.3 | ||
British Democratic | 1 | 0 | 0 | 0 | 0.0 | 0.5 | 452 | N/A | ||
Heritage | 1 | 0 | 0 | 0 | 0.0 | 0.1 | 107 | –0.2 |
An asterisk denotes an incumbent councillor seeking re-election.
Party | Candidate | Votes | % | ±% | |
---|---|---|---|---|---|
Green | Stuart Jeffery* | 914 | 60.0 | ||
Green | Rachel Rodwell | 822 | 54.0 | ||
Conservative | Mitu Chowdhury | 385 | 25.3 | ||
Conservative | Rita Gintautaite | 263 | 17.3 | ||
Liberal Democrats | Michelle Englar | 257 | 16.9 | ||
Labour | Marianna Poliszczuk | 203 | 13.3 | ||
Liberal Democrats | Benjamin Webster-Whiting | 202 | 13.3 | ||
Turnout | 1,659 | ||||
Green win (new seat) | |||||
Green win (new seat) |
Party | Candidate | Votes | % | ±% | |
---|---|---|---|---|---|
Independent | Fay Gooch* | 765 | 37.8 | ||
Green | Allison Sweetman | 712 | 35.2 | ||
Liberal Democrats | Chris Passmore | 707 | 34.9 | ||
Green | Keira Stuart Smith | 618 | 30.5 | ||
Liberal Democrats | Bryan Vizzard | 409 | 20.2 | ||
Conservative | Reiss Cordrey | 376 | 18.6 | ||
Labour | Mary Shaw | 280 | 13.8 | ||
Conservative | Arek Zurawinski | 182 | 9.0 | ||
Turnout | 2,213 | ||||
Independent win (new seat) | |||||
Green win (new seat) |
Party | Candidate | Votes | % | ±% | |
---|---|---|---|---|---|
Conservative | Val Springett* | 1,200 | 48.6 | ||
Conservative | Denis Spooner* | 1,021 | 41.3 | ||
Green | Ciaran Oliver | 1,013 | 41.0 | ||
Conservative | Paul Cooper* | 984 | 39.8 | ||
Green | Lee Garrett | 796 | 32.2 | ||
Green | Edward Wallace | 659 | 26.7 | ||
Reform UK | David Cockerham | 481 | 19.5 | ||
Independent | Gordon Newton* | 409 | 16.6 | ||
Liberal Democrats | Ian Chittenden | 398 | 16.1 | ||
Labour | Theresa Lyons | 343 | 13.9 | ||
Heritage | Sean Turner | 107 | 4.3 | ||
Turnout | 2,848 | ||||
Conservative win (new seat) | |||||
Green win (new seat) |
Party | Candidate | Votes | % | ±% | |
---|---|---|---|---|---|
Independent | Anne Dawes | 599 | 63.1 | +10.3 | |
Conservative | George Burr | 216 | 22.8 | –5.2 | |
Labour | Peter Oliver | 134 | 14.1 | +9.7 | |
Turnout | 958 | ||||
Independent hold | Swing | 7.8 | |||
Party | Candidate | Votes | % | ±% | |
---|---|---|---|---|---|
Independent | Vanessa Jones* | 1,026 | 65.0 | ||
Green | Stephen Thompson* | 810 | 51.3 | ||
Conservative | Heidi Bryant* | 414 | 26.2 | ||
Conservative | Stephen Banks | 379 | 24.0 | ||
Labour | Michael Beckwith | 279 | 17.7 | ||
Reform UK | Mike Wardle | 250 | 15.8 | ||
Turnout | 1,838 | ||||
Independent win (new seat) | |||||
Green win (new seat) |
Party | Candidate | Votes | % | ±% | |
---|---|---|---|---|---|
Green | Claire Kehily | 781 | 53.2 | ||
Conservative | Lottie Parfitt-Reid* | 666 | 45.3 | ||
Conservative | John Wilson | 581 | 39.6 | ||
Green | Caroline Richer | 547 | 37.2 | ||
Labour | John Randall | 192 | 13.1 | ||
Liberal Democrats | Alan Cocks | 171 | 11.6 | ||
Turnout | 1,717 | ||||
Green win (new seat) | |||||
Conservative win (new seat) |
Party | Candidate | Votes | % | ±% | |
---|---|---|---|---|---|
Independent | Paul Harper* | 1,285 | 59.5 | ||
Independent | Patrick Coates* | 1,149 | 53.2 | ||
Green | Kimberley Milham | 909 | 42.1 | ||
Labour | Valerie Jacobs | 447 | 20.7 | ||
Labour | Dennis Luchmun | 410 | 19.0 | ||
Liberal Democrats | Rojo Kurien | 384 | 17.8 | ||
Labour | Margaret Rose* | 379 | 17.5 | ||
Liberal Democrats | Lee Blake | 316 | 14.6 | ||
Liberal Democrats | Lorraine Humm | 290 | 13.4 | ||
Conservative | Will Dinley | 278 | 12.9 | ||
Reform UK | Susan Delamere | 247 | 11.4 | ||
Conservative | Ramakrishna Peeta | 202 | 9.3 | ||
Conservative | Mudiwa Musindo | 186 | 8.6 | ||
Turnout | 2,472 | ||||
Independent win (new seat) | |||||
Green win (new seat) |
Patrick Coates and Paul Harper were originally elected as Labour Party candidates, but stood under the descriptions of "Fant and Oakwood Independents" at this election.
Party | Candidate | Votes | % | ±% | |
---|---|---|---|---|---|
Liberal Democrats | Rob Field | 939 | 40.8 | ||
Liberal Democrats | Mark Naghi | 897 | 39.0 | ||
Conservative | Ronald Burke | 834 | 36.3 | ||
Conservative | Michelle Hastie* | 830 | 36.1 | ||
Independent | Martin Cox* | 666 | 29.0 | ||
Liberal Democrats | Jeeva Sampangi | 661 | 28.7 | ||
Conservative | Jaison Musindo | 654 | 28.4 | ||
Green | Steven Cheeseman | 450 | 19.6 | ||
Labour | Mark Tickner | 343 | 14.9 | ||
Green | Susan Parr | 331 | 14.4 | ||
Green | Anna Winterbottom | 294 | 12.8 | ||
Turnout | 2,618 | ||||
Liberal Democrats win (new seat) | |||||
Conservative win (new seat) |
Michelle Hastie was originally elected as an Liberal Democrat.
Party | Candidate | Votes | % | ±% | |
---|---|---|---|---|---|
Independent | Janetta Sams* | 1,515 | 79.8 | ||
Independent | Tom Sams* | 1,455 | 76.7 | ||
Independent | Kathy Cox | 923 | 48.6 | ||
Conservative | Julie-Anne Clancy | 435 | 22.9 | ||
Conservative | Emily Hudson | 396 | 20.9 | ||
Labour | Ryan Slaughter | 364 | 19.2 | ||
Reform UK | Ian Stevens | 305 | 16.1 | ||
Conservative | Onyekachukwu Chukwuma | 301 | 15.9 | ||
Turnout | 2,251 | ||||
Independent win (new seat) | |||||
Independent win (new seat) |
Party | Candidate | Votes | % | ±% | |
---|---|---|---|---|---|
Conservative | Martin Round* | 975 | 50.1 | ||
Conservative | Ziggy Trzebinski* | 903 | 46.4 | ||
Green | Derek Eagle* | 820 | 42.1 | ||
Green | Thomas Dawber | 725 | 37.3 | ||
Labour | Henry Morgan | 280 | 14.4 | ||
Liberal Democrats | Martin Richards | 189 | 9.7 | ||
Turnout | 2,177 | ||||
Conservative win (new seat) | |||||
Conservative win (new seat) |
Party | Candidate | Votes | % | ±% | |
---|---|---|---|---|---|
Liberal Democrats | Clive English* | 742 | 46.8 | ||
Liberal Democrats | Dinesh Khadka* | 654 | 41.3 | ||
Green | Donna Greenan | 514 | 32.4 | ||
Green | Saf Buxy | 513 | 32.4 | ||
Liberal Democrats | Ashleigh Kimmance* | 444 | 28.0 | ||
Labour | David Collier | 401 | 25.3 | ||
Green | Farris Willson | 358 | 22.6 | ||
Independent | Denise Joy* | 341 | 21.5 | ||
Conservative | Oliver Bradshaw | 314 | 19.8 | ||
Conservative | Alan Chell | 270 | 17.0 | ||
Conservative | Dylan Jeffrey | 202 | 12.7 | ||
Turnout | 1,809 | ||||
Liberal Democrats hold | |||||
Green gain from Independent |
Party | Candidate | Votes | % | ±% | |
---|---|---|---|---|---|
Conservative | Gill Fort* | 600 | 55.3 | ||
Conservative | Gary Cooke* | 559 | 51.5 | ||
Labour | Joan Langrick | 310 | 28.6 | ||
Green | Simon Easton | 275 | 25.4 | ||
Green | Matthew White | 216 | 19.9 | ||
Reform UK | Maxwell Harrison | 209 | 19.3 | ||
Turnout | 1,259 | ||||
Conservative win (new seat) | |||||
Conservative win (new seat) |
Party | Candidate | Votes | % | ±% | |
---|---|---|---|---|---|
Liberal Democrats | Brian Clark* | 1,307 | 70.0 | ||
Liberal Democrats | Simon Wales | 931 | 49.9 | ||
Conservative | Kenneth Amakye | 423 | 22.7 | ||
Conservative | James Reid* | 326 | 17.5 | ||
Reform UK | Bryan Hillman | 265 | 14.2 | ||
Green | Nicola Dawber | 215 | 11.5 | ||
Labour | Alan le Grys | 149 | 8.0 | ||
Green | Matthew Fraser | 119 | 6.4 | ||
Turnout | 2,099 | ||||
Liberal Democrats win (new seat) | |||||
Liberal Democrats win (new seat) |
Party | Candidate | Votes | % | ±% | |
---|---|---|---|---|---|
Conservative | Claudine Russell* | 1,123 | 47.6 | ||
Green | Michael Summersgill | 1,120 | 47.5 | ||
Green | Grace Couch | 1,089 | 46.2 | ||
Conservative | Annabelle Blackmore* | 1,043 | 44.2 | ||
Conservative | Tristan Russell | 953 | 40.4 | ||
Green | Kelly Rigden | 772 | 32.7 | ||
Labour | Maria Kelly | 389 | 16.5 | ||
Reform UK | Teresa Seamer | 298 | 12.6 | ||
Liberal Democrats | William Wilby | 287 | 12.2 | ||
Turnout | 2,704 | ||||
Conservative hold | |||||
Green gain from Conservative | |||||
Green gain from Conservative |
Party | Candidate | Votes | % | ±% | |
---|---|---|---|---|---|
Conservative | Stan Forecast* | 1,066 | 50.5 | ||
Conservative | Tom Cannon* | 816 | 38.6 | ||
Liberal Democrats | Cynthia Robertson* | 724 | 34.3 | ||
Liberal Democrats | Diana Lewins | 704 | 33.3 | ||
Green | Ian McDonald | 403 | 19.1 | ||
Green | Stephen Muggeridge | 286 | 13.5 | ||
Labour | Wendy Hollands | 225 | 10.7 | ||
Turnout | 2,313 | ||||
Conservative win (new seat) | |||||
Conservative win (new seat) |
Party | Candidate | Votes | % | ±% | |
---|---|---|---|---|---|
Labour | Hilary Jenkins-Baldock | 512 | 69.0 | ||
Labour | Daniel Wilkinson* | 492 | 66.3 | ||
Conservative | Joyce Gadd | 241 | 32.5 | ||
Conservative | Lewis McKenna* | 240 | 32.3 | ||
Turnout | 841 | ||||
Labour win (new seat) | |||||
Labour win (new seat) |
Party | Candidate | Votes | % | ±% | |
---|---|---|---|---|---|
Liberal Democrats | Tony Harwood* | 1,155 | 61.5 | ||
Liberal Democrats | Richard Conyard* | 1,086 | 57.9 | ||
Liberal Democrats | David Naghi* | 1,034 | 55.1 | ||
Conservative | Derek Nicholson | 402 | 21.4 | ||
Conservative | Jeff Tree | 396 | 21.1 | ||
Conservative | Andrew Bradford | 370 | 19.7 | ||
Labour | Rachel Slaughter | 356 | 19.0 | ||
Green | Phoebe Frewer | 353 | 18.8 | ||
Green | Andrew Reilly | 246 | 13.1 | ||
Green | Daniel Thompson | 233 | 12.4 | ||
Turnout | 2,098 | ||||
Liberal Democrats win (new seat) | |||||
Liberal Democrats win (new seat) |
Party | Candidate | Votes | % | ±% | |
---|---|---|---|---|---|
Liberal Democrats | Mike Thompson* | 325 | 52.0 | ||
Conservative | Scott Hahnefeld | 126 | 20.2 | ||
Labour | Stella Randall | 116 | 18.6 | ||
Green | Gareth Henry | 58 | 9.3 | ||
Turnout | 630 | ||||
Liberal Democrats win (new seat) |
Party | Candidate | Votes | % | ±% | |
---|---|---|---|---|---|
Labour | Malcolm McKay | 257 | 51.8 | ||
Conservative | Patrik Garten* | 239 | 48.2 | ||
Turnout | 509 | ||||
Labour win (new seat) |
Party | Candidate | Votes | % | ±% | |
---|---|---|---|---|---|
Labour | Joanna Wilkinson* | 747 | 42.5 | ||
Labour | Maureen Cleator* | 728 | 41.4 | ||
Labour | Sarah Barwick | 725 | 41.2 | ||
Conservative | Christopher Garland | 665 | 37.8 | ||
Conservative | Alan Bartlett* | 643 | 36.6 | ||
Conservative | Louise Bartlett | 637 | 36.2 | ||
British Democratic | Lawrence Rustem | 452 | 25.7 | ||
Liberal Democrats | Geoffrey Samme | 360 | 20.5 | ||
Independent | Gary Butler | 317 | 18.0 | ||
Turnout | 2,031 | ||||
Labour win (new seat) | |||||
Labour win (new seat) |
Party | Candidate | Votes | % | ±% | |
---|---|---|---|---|---|
Conservative | Paddy Riordan* | 967 | 57.3 | ||
Conservative | John Perry* | 764 | 45.3 | ||
Labour | Rory Silkin | 598 | 35.4 | ||
Labour | Julie Skinner | 511 | 30.3 | ||
Liberal Democrats | Thomas Burnham | 296 | 17.5 | ||
Green | Stewart Lane | 239 | 14.2 | ||
Turnout | 1,848 | ||||
Conservative hold | |||||
Party | Candidate | Votes | % | ±% | |
---|---|---|---|---|---|
Liberal Democrats | Paul Wilby* | 393 | 43.9 | ||
Liberal Democrats | Joe Higson | 377 | 42.1 | ||
Labour | Ian Cleator | 245 | 27.4 | ||
Reform UK | Paul Thomas | 209 | 23.3 | ||
Conservative | Rebecca Bruneau | 177 | 19.8 | ||
Green | Simon Milham | 137 | 15.3 | ||
Conservative | Benjamin Reid | 130 | 14.5 | ||
Green | Rosemary Riepma | 123 | 13.7 | ||
Turnout | 1,041 | ||||
Liberal Democrats win (new seat) | |||||
Liberal Democrats win (new seat) |
The Borough of Maidstone is a local government district with borough status in Kent, England. Its administrative centre is Maidstone, the county town of Kent.
The 2003 Maidstone Borough Council election took place on 1 May 2003 to elect members of Maidstone Borough Council in Kent, England. One third of the council was up for election and the council stayed under no overall control.
The 2004 Maidstone Borough Council election took place on 10 June 2004 to elect members of Maidstone Borough Council in Kent, England. One third of the council was up for election and the council stayed under no overall control.
The 2006 Maidstone Borough Council election took place on 4 May 2006 to elect members of Maidstone Borough Council in Kent, England. One third of the council was up for election and the council stayed under no overall control.
The 2007 Maidstone Borough Council election took place on 3 May 2007 to elect members of Maidstone Borough Council in Kent, England. One third of the council was up for election and the council stayed under no overall control.
The 2008 Maidstone Borough Council election took place on 1 May 2008 to elect members of Maidstone Borough Council in Kent, England. One third of the council was up for election and the Conservative Party gained overall control of the council from no overall control.
The Kent County Council election, 2013 was an election to all 84 seats on Kent County Council held on Thursday 2 May as part of the 2013 United Kingdom local elections. 84 councillors were elected from 72 electoral divisions, which returned either one or two county councillors each by first-past-the-post voting for a four-year term of office. The electoral divisions were the same as those used at the previous election in 2009. No elections were held in Medway, which is a unitary authority outside the area covered by the County Council. The election saw the Conservative Party narrowly retain overall control of the council.
The 2015 Colchester Borough Council election took place on 7 May 2015 to elect one third of the members of Colchester Borough Council in England. This was the same day as other local elections and as the General Election. Colchester Borough Council is made up of 60 councillors: 20 councillors were up for election.
The 2016 Calderdale Metropolitan Borough Council election took place on 5 May 2016 to elect members of Calderdale Metropolitan Borough Council in England. This was on the same day as other local elections. One councillor was elected in each ward for a four-year term so the councillors elected in 2016 last stood for election in 2012. Each ward is represented by three councillors, the election of which is staggered, so only one third of the councillors was elected in this election. Before the election there was no overall control with a minority Labour administration. After the election there was still no overall control so the minority Labour administration continued.
Elections to Basingstoke and Deane Borough Council took place on 6 May 2021 as part of the 2021 United Kingdom local elections. They took place at the same time as the elections for Hampshire County Council and the Hampshire Police and Crime Commissioner.
The 2022 Bromley London Borough Council election took place on 5 May 2022. All 58 members of Bromley London Borough Council were elected. The elections took place alongside local elections in the other London boroughs and elections to local authorities across the United Kingdom.
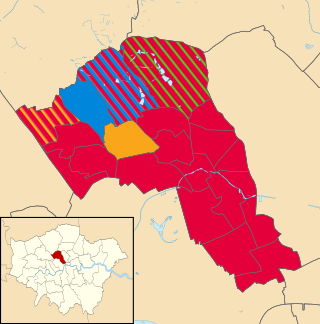
The 2022 Camden London Borough Council election took place on 5 May 2022. All 55 members of Camden London Borough Council were elected. The elections took place alongside local elections in the other London boroughs and elections to local authorities across the United Kingdom.
The 2022 Watford Borough Council election took place on 5 May 2022. One third (12) of the 36 members of Watford Borough Council were elected. The elections took place alongside elections to local authorities across the United Kingdom, and an election for the Mayor of Watford.
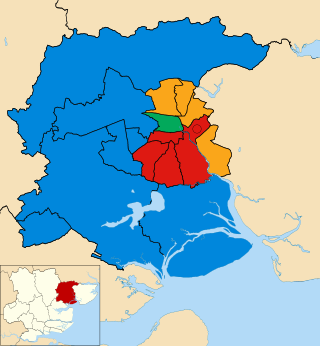
Elections to Colchester Borough Council took place on 5 May 2022. Eighteen members of the council were elected: one from 16 of the 17 wards, and two councillors from New Town & Christ Church ward, following the death of incumbent councillor Nick Cope, elected in 2019 and due to serve until 2023.
The 2023 Colchester City Council election took place on 4 May 2023 to elect members of Colchester City Council in Essex, England. This was on the same day as other local elections across England. There were 17 of the 51 seats on the council up for election, being the usual third of the council, with one seat available for each ward. This set of seats were last contested at the 2019 election.
The 2024 Colchester City Council election took place on 2 May 2024 alongside other local elections across England. Eighteen members of the council were elected, one from each of the wards, with an additonal by-election in Greenstead ward.
The 2023 Broxtowe Borough Council election took place on 4 May 2023, to elect all 44 members of Broxtowe Borough Council in England. This took place as part of the 2023 United Kingdom local elections.
The 2023 Rushcliffe Borough Council election took place on 4 May 2023, to elect all 44 members of Rushcliffe Borough Council in Nottinghamshire, England. This was on the same day as other local elections across England.
The 2023 Basingstoke and Deane Borough Council election took place on 4 May 2023 to elect members of Basingstoke and Deane Borough Council in Hampshire, England. This was on the same day as other local elections in England.
The 2024 Burnley Borough Council election is scheduled to be held on Thursday 2 May 2024, alongside the other local elections in the United Kingdom being held on the same day. One-third of the 45 members of Burnley Borough Council in Lancashire will be elected.