This article needs to be updated. The reason given is: Full results out.(May 2024) |
| |||||||||||||||||||||||||||||||||||||||||||||||||||||
All 51 seats to Stroud District Council 26 seats needed for a majority | |||||||||||||||||||||||||||||||||||||||||||||||||||||
---|---|---|---|---|---|---|---|---|---|---|---|---|---|---|---|---|---|---|---|---|---|---|---|---|---|---|---|---|---|---|---|---|---|---|---|---|---|---|---|---|---|---|---|---|---|---|---|---|---|---|---|---|---|
| |||||||||||||||||||||||||||||||||||||||||||||||||||||
Map showing the results of the 2024 Stroud District Council election | |||||||||||||||||||||||||||||||||||||||||||||||||||||
|
The 2024 Stroud District Council election is scheduled to be held on Thursday 2 May 2024, alongside the other local elections in the United Kingdom being held on the same day. All 51 members of Stroud District Council in Gloucestershire will be elected. Due to the previous election being delayed due to the COVID-19 pandemic, councillors face re-election after a 3-year term, rather than the usual 4.
Stroud has traditionally been a Conservative council. The party held a majority on the council from 1976 to 1984, with a period of no overall control until 2002. [1] The Conservatives remained the largest group on the council, aside from a period between 1994 and 1999, when Labour overtook them. The council again fell to no overall control in 2011, [2] and no party has won a majority since then. In 2016, the council moved from electing by thirds to an all-out system, where all seats are contested every 4 years. [3]
In the most recent election, the Conservative party won 20 seats (down 3) with 39.2% of the vote, labour won 15 (down 3) with 29.4%, the Green Party won 13 (up 5) with 25.5%, and the Liberal Democrats won 3 (up 1) with 5.9%. Following the election, Doina Cornell of the Labour Party was elected council leader, with the backing of the Green Party and Liberal Democrats. [4] Labour lost their position as the largest party in the coalition in June 2022, following the resignation of Cornell and 3 others from the party. [5] Green Party councillor Catherine Braun was elected leader on 22 July 2022; [6] the council is now run by a coalition of the Green Party, the Liberal Democrats, the Community Independents group, and the Independent Left group. [7]
After 2021 election | Before 2024 election [8] | After 2024 election | ||||||
---|---|---|---|---|---|---|---|---|
Party | Seats | Party | Seats | Party | Seats | |||
Conservative | 20 | Conservative | 19 | Conservative | 7 | |||
Green | 13 | Green | 14 | Green | 22 | |||
Labour | 15 | Labour | 4 | Labour | 20 | |||
Liberal Democrats | 3 | Liberal Democrats | 3 | Liberal Democrats | 2 | |||
Independent | 0 | Independent | 10 | Independent | 0 |
Changes:
2024 Stroud District Council election | ||||||||||
---|---|---|---|---|---|---|---|---|---|---|
Party | Candidates | Seats | Gains | Losses | Net gain/loss | Seats % | Votes % | Votes | +/− | |
Conservative | 51 | 7 | 12 | |||||||
Green | 51 | 22 | 8 | |||||||
Independent | 5 | 0 | 5 | |||||||
Labour | 51 | 20 | 16 | |||||||
Liberal Democrats | 20 | 2 | 1 | |||||||
TUSC | 4 | 0 |
The Statement of Persons Nominated, which details the candidates standing in each ward, was released by Stroud District Council following the close of nominations on 5 April 2024. [16]
Party | Candidate | Votes | % | ±% | |
---|---|---|---|---|---|
Green | Sarah Canning | 420 | 47.9 | N/A | |
Labour Co-op | Lesley Williams | 267 | 30.4 | -21.2 | |
Conservative | Colin Chisholm | 190 | 21.7 | -26.7 | |
Majority | 153 | 17.5 | |||
Turnout | 884 | 50.46 | |||
Registered electors | 1,752 | ||||
Green gain from Labour | Swing | ||||
Party | Candidate | Votes | % | ±% | |
---|---|---|---|---|---|
Conservative | Lindsey Green* | 1,094 | 50.8 | -3.4 | |
Conservative | Paul Turner | 935 | 43.4 | -13.6 | |
Conservative | Charles Tuffin | 881 | 40.9 | -6.3 | |
Labour | Liz Ashton | 876 | 40.7 | +9.7 | |
Labour | Steve Lydon | 582 | 27.0 | +10.7 | |
Labour | Jo Smith | 556 | 25.8 | N/A | |
Green | Martyn Cutcher | 250 | 11.6 | -5.9 | |
Green | Susie Medley | 247 | 11.5 | N/A | |
Liberal Democrats | Nick Easby | 229 | 10.6 | -4.3 | |
Green | Bob Hilliard | 224 | 10.4 | N/A | |
Turnout | 2,169 | 36.33 | |||
Registered electors | 5,970 | ||||
Conservative hold | Swing | ||||
Party | Candidate | Votes | % | ±% | |
---|---|---|---|---|---|
Green | Martin Brown* | 546 | 62.1 | +8.5 | |
Conservative | Stephen Davies | 209 | 23.8 | -22.6 | |
Labour | Neil Hughes | 80 | 9.1 | N/A | |
Liberal Democrats | Rod Rhys Jones | 44 | 5.0 | N/A | |
Majority | 337 | 38.3 | |||
Turnout | 882 | 49.55 | |||
Registered electors | 1,780 | ||||
Green hold | Swing | ||||
Party | Candidate | Votes | % | ±% | |
---|---|---|---|---|---|
Labour | Elizabeth Stanley | 989 | 48.0 | +14.1 | |
Labour | Dave Mathews | 971 | 47.1 | +13.7 | |
Labour | Fraser Dahdouh | 954 | 46.3 | +17.8 | |
Green | Kate Crews* [lower-alpha 4] | 630 | 30.6 | +12.0 | |
Green | Alan Mossman | 428 | 20.8 | +3.5 | |
Green | Gavin McClafferty | 413 | 20.0 | +4.9 | |
Conservative | George Williams | 397 | 19.3 | -9.2 | |
Conservative | Donna Pickering | 319 | 15.5 | -14.8 | |
Conservative | Adam Whitehead | 311 | 15.1 | -5.6 | |
Independent | Charlie Mitchell | 209 | 10.1 | N/A | |
TUSC | Sue Richards | 81 | 3.9 | +2.1 | |
Turnout | 2,071 | 35.41 | |||
Registered electors | 5,848 | ||||
Labour hold | |||||
Labour hold | |||||
Labour gain from Conservative |
Party | Candidate | Votes | % | ±% | |
---|---|---|---|---|---|
Labour | Ian Hamilton | 662 | 44.9 | +17.8 | |
Labour | Milly Hill | 583 | 39.5 | +15.6 | |
Conservative | Brian Tipper* | 513 | 34.8 | -14.5 | |
Conservative | Victoria Gray* | 422 | 28.6 | -15.9 | |
Green | Anna Bonallack | 209 | 14.2 | N/A | |
Green | Steven Naumann | 132 | 8.9 | N/A | |
Liberal Democrats | Richard Wilsher | 121 | 8.2 | -9.3 | |
Turnout | 1,481 | 40.61 | |||
Registered electors | 3,647 | ||||
Labour gain from Conservative | |||||
Labour gain from Conservative |
Party | Candidate | Votes | % | ±% | |
---|---|---|---|---|---|
Labour | Chris Haynes | 590 | 46.6 | +3.1 | |
Labour | Terri Kinnison | 528 | 41.7 | +12.7 | |
Conservative | Bridget Baxter | 361 | 28.5 | -5.8 | |
Conservative | Christopher Evans* | 345 | 27.3 | -16.5 | |
Green | Ben Bywater | 238 | 18.8 | N/A | |
Green | Sally Pickering | 159 | 12.6 | N/A | |
Liberal Democrats | Rhianna Wilsher | 107 | 8.5 | -2.1 | |
Turnout | 1,274 | 33.50 | |||
Registered electors | 3,803 | ||||
Labour gain from Conservative | |||||
Labour hold | |||||
Party | Candidate | Votes | % | ±% | |
---|---|---|---|---|---|
Green | Tricia Watson* | 1,323 | 53.5 | +3.5 | |
Green | Helen Fenton* [lower-alpha 5] | 1,279 | 51.7 | +15.3 | |
Green | James Boyle | 1,192 | 48.2 | +1.2 | |
Labour | Alex Hughes | 624 | 25.2 | -11.2 | |
Labour | Jed Knight | 605 | 24.5 | N/A | |
Conservative | Gail Fearnley-Whittingstall | 559 | 22.6 | -11.7 | |
Conservative | Tim Westlake | 511 | 20.7 | -12.4 | |
Conservative | Kim Hawkins | 504 | 20.4 | -9.3 | |
Labour | Stephen Stanley | 504 | 20.4 | N/A | |
Turnout | 2,486 | 47.60 | |||
Registered electors | 5,223 | ||||
Green hold | |||||
Green hold | |||||
Green gain from Labour |
Party | Candidate | Votes | % | ±% | |
---|---|---|---|---|---|
Green | Martin Pearcy* | 584 | 59.2 | +4.1 | |
Conservative | John Stanton | 260 | 26.3 | -18.6 | |
Labour | Claire Cook | 143 | 14.5 | N/A | |
Majority | 324 | 33.1 | |||
Turnout | 998 | 50.74 | |||
Registered electors | 1,967 | ||||
Green hold | Swing | ||||
Party | Candidate | Votes | % | ±% | |
---|---|---|---|---|---|
Labour | Helen Caton Hughes | 915 | 43.2 | +0.3 | |
Labour | Terry Cook | 840 | 39.7 | -2.1 | |
Labour | Bob Hughes | 802 | 37.9 | +1.7 | |
Green | Danae Savvidou | 688 | 32.5 | -3.7 | |
Green | Tom Meadowcroft | 557 | 26.3 | +6.2 | |
Conservative | Loraine Patrick* | 549 | 25.9 | -13.7 | |
Conservative | Matt Patrick | 480 | 22.7 | -10.4 | |
Conservative | Carwyn Williams | 449 | 21.2 | -9.4 | |
Green | James Broady | 417 | 19.7 | +5.6 | |
Liberal Democrats | Ann Blacklock | 155 | 7.3 | N/A | |
TUSC | Lucia Jayaseelan | 45 | 2.1 | N/A | |
Turnout | 2,129 | 37.42 | |||
Registered electors | 5,689 | ||||
Labour hold | |||||
Labour hold | |||||
Labour gain from Conservative |
Party | Candidate | Votes | % | ±% | |
---|---|---|---|---|---|
Conservative | Gill Oxley* | 858 | 44.9 | -11.6 | |
Conservative | Demelza Turner-Wilkes | 724 | 37.9 | -7.7 | |
Conservative | Mark Ryder* | 676 | 35.4 | -4.7 | |
Labour | Simon MacGregor | 491 | 25.7 | +0.7 | |
Green | Adrian Oldman | 458 | 24.0 | -1.9 | |
Labour | Keith Terry | 420 | 22.0 | N/A | |
Labour | Thomas Williams | 415 | 21.7 | N/A | |
Green | John Robinthwaite | 380 | 19.9 | -3.4 | |
Green | John Patient | 362 | 19.0 | N/A | |
Liberal Democrats | Alexandra Owen | 263 | 13.8 | N/A | |
Turnout | 1,922 | 27.59 | |||
Registered electors | 6,967 | ||||
Conservative hold | |||||
Party | Candidate | Votes | % | ±% | |
---|---|---|---|---|---|
Liberal Democrats | Holly Simkiss | 689 | 82.0 | +23.1 | |
Conservative | Allison Long | 79 | 9.4 | -23.1 | |
Green | Hannah Lyons-Tsai | 40 | 4.8 | N/A | |
Labour | Val Randell | 32 | 3.8 | -4.8 | |
Majority | 610 | 72.6 | |||
Turnout | 843 | 45.77 | |||
Registered electors | 1,842 | ||||
Liberal Democrats hold | Swing | ||||
Party | Candidate | Votes | % | ±% | |
---|---|---|---|---|---|
Green | Chloe Turner* | 1,259 | 72.5 | +13.8 | |
Green | Gill Thomas | 960 | 55.3 | N/A | |
Conservative | Duncan Greenaway | 306 | 17.6 | -31.0 | |
Liberal Democrats | Christo Archer | 261 | 15.0 | N/A | |
Conservative | Philip Morris | 203 | 11.7 | -10.0 | |
Labour | Stephen Moore | 173 | 10.0 | -11.9 | |
Labour | David Carter | 148 | 8.5 | N/A | |
Turnout | 1,740 | 47.10 | |||
Registered electors | 3,694 | ||||
Green hold | Swing | ||||
Green gain from Conservative | Swing | ||||
Party | Candidate | Votes | % | ±% | |
---|---|---|---|---|---|
Labour Co-op | Steve Robinson* | 1,599 | 66.8 | +8.0 | |
Green | Kate Kay | 985 | 41.1 | -12.1 | |
Labour Co-op | Maggie Dutton | 942 | 39.3 | -4.0 | |
Labour Co-op | Shelley Rider | 827 | 34.5 | N/A | |
Green | Rod Nelson | 614 | 25.6 | N/A | |
Green | Rosie Thresher | 434 | 18.1 | N/A | |
Conservative | Ian Daniels | 347 | 14.5 | -12.4 | |
Conservative | Tom George | 329 | 13.7 | -11.5 | |
Conservative | Max Howells | 327 | 13.7 | -9.7 | |
Liberal Democrats | Colleen Rothwell | 185 | 7.7 | -4.2 | |
Liberal Democrats | Adam Cain | 115 | 4.8 | N/A | |
Turnout | 2,412 | 45.72 | |||
Registered electors | 5,276 | ||||
Labour Co-op hold | Swing | ||||
Green hold | Swing | ||||
Labour Co-op hold | Swing | ||||
Party | Candidate | Votes | % | ±% | |
---|---|---|---|---|---|
Green | Gary Luff* | 1,492 | 58.0 | +21.1 | |
Green | Pete Kennedy | 1,245 | 48.4 | +11.5 | |
Green | Matthew Sargeant | 1,171 | 45.5 | N/A | |
Conservative | David Castle | 849 | 33.0 | -13.1 | |
Conservative | Tim Williams | 807 | 31.4 | -10.5 | |
Conservative | David Lowin | 737 | 28.7 | -13.2 | |
Labour | Anne Snelgrove | 274 | 10.7 | -15.0 | |
Labour | Ashley Smith* [lower-alpha 6] | 245 | 9.5 | N/A | |
Liberal Democrats | Richard Osborn | 239 | 9.3 | N/A | |
Labour | Andrew Treacher | 202 | 7.9 | N/A | |
Turnout | 2,587 | 43.09 | |||
Registered electors | 6,004 | ||||
Green gain from Conservative | Swing | ||||
Party | Candidate | Votes | % | ±% | |
---|---|---|---|---|---|
Green | Jon Edmunds* | 613 | 74.0 | +2.1 | |
Conservative | Marcia Cosh | 111 | 13.4 | -14.7 | |
Labour | Paul Sztumpf | 65 | 7.9 | N/A | |
Liberal Democrats | John Holmes | 39 | 4.7 | N/A | |
Majority | 502 | 60.6 | |||
Turnout | 833 | 48.00 | |||
Registered electors | 1,737 | ||||
Green hold | Swing | ||||
Party | Candidate | Votes | % | ±% | |
---|---|---|---|---|---|
Labour | Nigel Prenter* | 602 | 34.5 | +0.6 | |
Labour | Katy Hofmann | 576 | 33.0 | -8.9 | |
Green | Liz Hillary | 539 | 30.9 | +6.7 | |
Green | Phil Blomberg | 505 | 28.9 | +3.1 | |
Independent | Robin Layfield* [lower-alpha 7] | 450 | 25.8 | -16.1 | |
Independent | Helen Elliott-Boult | 303 | 17.4 | N/A | |
Conservative | Sarah Jones | 193 | 11.1 | -11.4 | |
Conservative | Tom Whittaker | 169 | 9.7 | -8.7 | |
Turnout | 1,745 | 49.36 | |||
Registered electors | 3,535 | ||||
Labour hold | Swing | ||||
Party | Candidate | Votes | % | ±% | |
---|---|---|---|---|---|
Conservative | Robert Brown | 706 | 37.3 | -10.6 | |
Labour Co-op | Richard Maisey | 683 | 36.1 | +8.2 | |
Labour Co-op | Nathan Greenway | 648 | 34.2 | N/A | |
Conservative | Hena Mannan-Rahman | 504 | 26.6 | -19.2 | |
Green | Moya Shannon | 374 | 19.8 | -3.2 | |
Liberal Democrats | Mike Stayte | 341 | 18.0 | -1.8 | |
Green | Isa Clee | 276 | 14.6 | N/A | |
Turnout | 1,911 | 33.89 | |||
Registered electors | 5,638 | ||||
Conservative hold | Swing | ||||
Labour Co-op gain from Conservative | Swing | ||||
Party | Candidate | Votes | % | ±% | |
---|---|---|---|---|---|
Labour | John Callinan | 749 | 40.4 | +2.5 | |
Labour | John Parker | 723 | 39.0 | +4.6 | |
Green | Carol Kambites | 661 | 35.6 | +11.8 | |
Labour | Karen Linforth | 571 | 30.8 | +0.2 | |
Conservative | Nicholas Housden* | 412 | 22.2 | -13.4 | |
Green | Madelaine Maraboli-Roman | 393 | 21.2 | -0.7 | |
Conservative | Sonia Brinkworth | 361 | 19.5 | -10.1 | |
Green | Rachel Smith | 317 | 17.1 | +3.2 | |
Independent | Wendy Thomson | 310 | 16.7 | N/A | |
Conservative | Surjeet Malik | 294 | 15.8 | -9.9 | |
Liberal Democrats | Robert Jewell | 129 | 7.0 | +2.4 | |
TUSC | Adam Goulcher | 45 | 2.4 | +0.5 | |
Turnout | 1,868 | 32.01 | |||
Registered electors | 5,835 | ||||
Labour hold | Swing | ||||
Green gain from Conservative | Swing | ||||
Party | Candidate | Votes | % | ±% | |
---|---|---|---|---|---|
Labour Co-op | David Drew | 408 | 50.7 | +14.2 | |
Green | Cate James-Hodges | 326 | 40.5 | -0.7 | |
Conservative | Susan Cursham | 70 | 8.7 | -13.6 | |
Majority | 82 | 10.2 | |||
Turnout | 814 | 44.68 | |||
Registered electors | 1,822 | ||||
Labour Co-op gain from Green | Swing | ||||
Party | Candidate | Votes | % | ±% | |
---|---|---|---|---|---|
Labour | Shyama Ananthan | 388 | 48.4 | +7.8 | |
Green | Val Saunders | 309 | 38.5 | +22.5 | |
Conservative | Richard Silvey | 105 | 13.1 | -30.3 | |
Majority | 79 | 9.9 | |||
Turnout | 805 | 42.62 | |||
Registered electors | 1,889 | ||||
Labour gain from Conservative | Swing | ||||
Party | Candidate | Votes | % | ±% | |
---|---|---|---|---|---|
Green | Natalie Rothwell-Warn | 387 | 53.8 | +13.2 | |
Labour | Rachel Lyons | 230 | 31.9 | -11.1 | |
Independent | Thea Pilikian | 65 | 9.0 | N/A | |
Conservative | Anthony Malpass | 38 | 5.3 | -9.3 | |
Majority | 157 | 21.9 | |||
Turnout | 725 | 40.26 | |||
Registered electors | 1,801 | ||||
Green gain from Labour | Swing | ||||
Party | Candidate | Votes | % | ±% | |
---|---|---|---|---|---|
Green | Lucas Schoemaker* | 485 | 60.2 | +8.3 | |
Labour | Andy Theaker | 194 | 24.1 | -7.6 | |
Conservative | Sharon Sugars | 52 | 6.5 | -10.0 | |
TUSC | Chris Moore | 46 | 5.7 | N/A | |
Liberal Democrats | Philip Purves | 29 | 3.6 | N/A | |
Majority | 291 | 36.1 | |||
Turnout | 814 | 49.76 | |||
Registered electors | 1,636 | ||||
Green hold | Swing | ||||
Party | Candidate | Votes | % | ±% | |
---|---|---|---|---|---|
Labour | Cath Moore | 246 | 38.0 | -5.8 | |
Green | Sarah Dixon | 184 | 28.4 | -0.9 | |
Liberal Democrats | George James | 118 | 18.2 | +14.5 | |
Conservative | Jessica Tomblin | 100 | 15.4 | -7.0 | |
Majority | 62 | 9.6 | |||
Turnout | 657 | 39.94 | |||
Registered electors | 1,645 | ||||
Labour hold | Swing | ||||
Party | Candidate | Votes | % | ±% | |
---|---|---|---|---|---|
Green | Martin Baxendale* | 559 | 62.0 | +16.4 | |
Labour Co-op | Mick Fealty | 293 | 32.5 | -8.4 | |
Conservative | Brian Lee | 49 | 5.4 | -8.1 | |
Majority | 266 | 29.5 | |||
Turnout | 906 | 52.28 | |||
Registered electors | 1,733 | ||||
Green hold | Swing | ||||
Party | Candidate | Votes | % | ±% | |
---|---|---|---|---|---|
Green | Steve Hynd* | 907 | 56.8 | +18.1 | |
Green | Marisa Godfrey | 741 | 46.4 | N/A | |
Conservative | Nigel Studdert-Kennedy* | 437 | 27.3 | -13.8 | |
Labour | Jenny Miles | 317 | 19.8 | -8.8 | |
Conservative | David White | 226 | 14.1 | -15.4 | |
Labour | Julie Harper | 203 | 12.7 | -6.4 | |
Liberal Democrats | Elaine Jewell | 56 | 3.5 | N/A | |
Turnout | 1,608 | 42.89 | |||
Registered electors | 3,749 | ||||
Green gain from Conservative | |||||
Green hold | |||||
Party | Candidate | Votes | % | ±% | |
---|---|---|---|---|---|
Green | Beki Aldam* | 635 | 64.4 | +1.4 | |
Labour | Rod Beer | 178 | 18.1 | +7.0 | |
Conservative | Charlie Stacey | 173 | 17.5 | -8.4 | |
Majority | 457 | 46.0 | |||
Turnout | 994 | 51.53 | |||
Registered electors | 1,929 | ||||
Green hold | |||||
Party | Candidate | Votes | % | ±% | |
---|---|---|---|---|---|
Liberal Democrats | Linda Cohen | 1,185 | 48.8 | -4.8 | |
Green | Catherine Braun* | 1,090 | 44.9 | -7.7 | |
Green | Gareth Kitchen | 743 | 30.6 | N/A | |
Liberal Democrats | Mark Walter | 740 | 30.5 | -12.9 | |
Conservative | Graham Smith | 558 | 23.0 | -16.3 | |
Liberal Democrats | Lisa Carr | 541 | 22.3 | N/A | |
Green | Eleanor Meehan | 431 | 17.8 | N/A | |
Labour | Steven Mackay | 354 | 14.6 | N/A | |
Labour | Rachel Curley | 343 | 14.1 | N/A | |
Labour | John Bloxsom | 332 | 13.7 | N/A | |
Conservative | Andrew Reynolds | 316 | 13.0 | -10.7 | |
Conservative | Allan Nolan | 304 | 12.5 | -9.8 | |
Turnout | 2,432 | 43.88 | |||
Registered electors | 5,542 | ||||
Liberal Democrats hold | |||||
Green hold | |||||
Green gain from Liberal Democrats |
The Metropolitan Borough of Wirral is a metropolitan borough of Merseyside, in North West England. It has a population of 322,453 (2022), and encompasses 62 square miles (161 km2) of the northern part of the Wirral Peninsula. Major settlements include Birkenhead, Wallasey, Bebington, Heswall, Hoylake and West Kirby. Wirral is England's westernmost metropolitan borough, faced by the city of Liverpool to the northeast over the River Mersey.
Stroud District is a local government district in Gloucestershire, England. The district is named after its largest town of Stroud. The council is based at Ebley Mill in Cainscross. The district also includes the towns of Berkeley, Dursley, Nailsworth, Stonehouse and Wotton-under-Edge, along with numerous villages and surrounding rural areas. Over half of the district lies within the Cotswolds Area of Outstanding Natural Beauty.
Stockport Metropolitan Borough Council (SMBC) is the local authority for the Metropolitan Borough of Stockport, Greater Manchester, England. The council is currently run by a Liberal Democrat minority administration. At the 2023 local elections, the Liberal Democrats gained two more seats, increasing their lead over the Labour Party to six seats, and retaining minority control. This lead is now five seats after one of the Liberal Democrats’ councillors resigned the whip, days after being re-elected. The Liberal Democrats currently have 29 seats, Labour 24, and Greens and the Edgeley Community Association each hold 3. There are 4 independents, three of whom are sponsored by the Heald Green Ratepayers (not formally a political party).
Sheffield City Council is the local authority for the City of Sheffield, a metropolitan borough with city status in South Yorkshire, England. The council consists of 84 councillors, elected to represent 28 wards, each with three councillors. It is currently under no overall control, with Labour, the Liberal Democrats and the Green Party each holding chair positions in a proportionate number of committees.
Durham County Council is the local authority which governs the non-metropolitan county of County Durham in North East England. Since 2009 it has been a unitary authority, having taken over district-level functions when the county's districts were abolished. The non-metropolitan county is smaller than the ceremonial county of County Durham, which additionally includes Darlington, Hartlepool and the parts of Stockton-on-Tees north of the River Tees. The county council has its headquarters at County Hall in Durham.
Pendle is a local government district with borough status in Lancashire, England. The council is based in Nelson, the borough's largest town. The borough also includes the towns of Barnoldswick, Brierfield, Colne and Earby along with the surrounding villages and rural areas. Part of the borough lies within the Forest of Bowland Area of Outstanding Natural Beauty.
Southend-on-Sea City Council is the local authority of the Southend-on-Sea district in Essex, England. It is a unitary authority, having the powers of a non-metropolitan county and district council combined. It is a member of the East of England Local Government Association. It is based at Southend Civic Centre in Southend-on-Sea.
The 2017 Norfolk County Council election took place on 4 May 2017 as part of the 2017 local elections in the United Kingdom.
Dorset Council is a unitary local authority for the district of Dorset in England, encompassing most of the area of the county of the same name, Dorset. Created in April 2019, the council was formed when the county moved from a two-tier county council and district council system to a one-tier system, with the county divided into two districts administered by two independent unitary authorities – Dorset district and Bournemouth, Christchurch and Poole district.
The 2019 Redcar and Cleveland Borough Council election took place on 2 May 2019 to elect members of Redcar and Cleveland Borough Council in England. This was on the same day as other local elections.
The 2022 North Yorkshire Council election took place on 5 May 2022, alongside the other local elections. These were the last elections to North Yorkshire County Council, and the elected councillors would also serve as the first councillors on the North Yorkshire Council, which replaced the existing county council in April 2023.
The 2021 Oxfordshire County Council election took place on 6 May 2021 alongside the other local elections. All 63 seats of the Oxfordshire County Council were contested. The council is composed of 61 divisions, each electing either one or two councillors, all elected by FPTP.
The 2022 Bromley London Borough Council election took place on 5 May 2022. All 58 members of Bromley London Borough Council were elected. The elections took place alongside local elections in the other London boroughs and elections to local authorities across the United Kingdom.
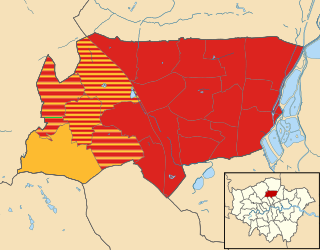
The 2022 Haringey London Borough Council election took place on 5 May 2022. All 57 members of Haringey London Borough Council were elected. The elections took place alongside local elections in the other London boroughs and elections to local authorities across the United Kingdom.
The Labour Party has been active in the Stroud constituency area since at least 1897 and the constituency has been represented in UK Parliament by two Labour MPs, Ben Parkin and David Drew. The Constituency Labour Party first purchased a building in 1930.
The 2022 Plymouth City Council election took place on 5 May 2022 to elect members of Plymouth City Council in England. It coincided with local elections across the United Kingdom. The Conservative Party made gains in the previous election in 2021, resulting in the council entering no overall control with no party holding a majority of seats. Immediately following the results of the 2022 election, the council remained in no overall control. Labour and the Conservatives gained seats from independent councillors who had left their parties and exchanged seats with each other. The election saw the elections of the city's first Green Party councillor, Ian Poyser, and first trans councillor, Dylan Tippetts of the Labour Party.
Elections to Aberdeenshire Council took place on Thursday 5 May 2022 on the same day as the 31 other Scottish local government elections. As with other Scottish council elections, it was held using single transferable vote (STV) – a form of proportional representation – in which multiple candidates are elected in each ward and voters rank candidates in order of preference.
The 2022 Wakefield Metropolitan District Council election took place on 5 May 2022 to elect members of Wakefield Council. This was on the same day as other local elections. 21 of the 63 seats were up for election.
The 2023 Colchester City Council election took place on 4 May 2023 to elect members of Colchester City Council in Essex, England. This was on the same day as other local elections across England. There were 17 of the 51 seats on the council up for election, being the usual third of the council, with one seat available for each ward. This set of seats were last contested at the 2019 election.
The 2023 Plymouth City Council election was held on 4 May 2023 to elect members of Plymouth City Council in England. It coincided with local elections across the United Kingdom.