| |||||||||||||||||||||||||||||||||||||||||
19 out of 57 seats to Milton Keynes City Council 29 seats needed for a majority | |||||||||||||||||||||||||||||||||||||||||
---|---|---|---|---|---|---|---|---|---|---|---|---|---|---|---|---|---|---|---|---|---|---|---|---|---|---|---|---|---|---|---|---|---|---|---|---|---|---|---|---|---|
Turnout | 30.3% | ||||||||||||||||||||||||||||||||||||||||
| |||||||||||||||||||||||||||||||||||||||||
Winner of each seat at the 2024 Milton Keynes City Council election | |||||||||||||||||||||||||||||||||||||||||
|
The 2024 Milton Keynes City Council elections were held on Thursday 2 May 2024, [2] alongside the other local elections in the United Kingdom that were held on the same day. One-third of the 57 members of Milton Keynes City Council in Buckinghamshire were up for election. [3]
Labour regained control of the council, gaining a majority for the first time since the 1999 elections. [4]
Milton Keynes was created as a unitary authority in 1997. [5] Labour controlled the council from its creation until 2000, with the Liberal Democrats winning the council from no overall control in 2002. [6] The Liberal Democrats lost their majority in 2006, and no party has formed a majority since.
The Conservatives became the largest party on the council in 2011, [7] but were overtaken by Labour in 2014. [8] The Conservatives were again the largest group in 2018, [9] with Labour overtaking them in 2019. [10] The Conservatives formed the largest group from 2021 to 2023; in that election, Labour gained 5 seats to become the largest group on the council, the Conservatives lost 6, and the Liberal Democrats gained 1. Labour and the Liberal Democrats formed a majority coalition following the election. [11]
The seats up for election in 2024 were last contested in 2021; because of the delay of all local elections due to the COVID-19 pandemic, the seats are up for election after 3 years rather than the usual 4. In that election, the Conservatives won 11 seats (up 6) with 42.0% of the vote, Labour won 7 (down 4) with 34.0%, and the Liberal Democrats won 3 (down 2) with 16.2%.
After 2023 election | Before 2024 election [12] | After 2024 election [13] | ||||||
---|---|---|---|---|---|---|---|---|
Party | Seats | Party | Seats | Party | Seats | |||
Labour | 25 | Labour | 27 | Labour | 30 | |||
Liberal Democrats | 15 | Liberal Democrats | 16 | Liberal Democrats | 18 | |||
Conservative | 17 | Conservative | 14 | Conservative | 9 |
Changes:
source: [20]
An asterisk indicates an incumbent.
Party | Candidate | Votes | % | ±% | |
---|---|---|---|---|---|
Labour Co-op | Ed Hume* | 1,614 | 54.6 | -2.2 | |
Conservative | James Marlow | 604 | 20.4 | -5.0 | |
Independent | Ron Haine | 316 | 10.7 | N/A | |
Green | Axel Hans Segebrecht | 228 | 7.7 | +2.1 | |
Liberal Democrats | Sean Douglas McCabe | 166 | 5.6 | -1.2 | |
Rejected ballots | 27 | 0.9 | |||
Turnout | 2955 | 22.79 | |||
Registered electors | 12,968 | ||||
Labour Co-op hold | Swing | ||||
Party | Candidate | Votes | % | ±% | |
---|---|---|---|---|---|
Labour | Ayesha Khanom | 1,532 | 45.4 | +3.9 | |
Conservative | Mo Imran* | 1171 | 34.7 | -4.8 | |
Green | Michael John Sheppard | 337 | 10.0 | +1.8 | |
Liberal Democrats | Timothy Iain Gomm | 297 | 8.8 | +2.1 | |
Rejected ballots | 36 | 1.1 | |||
Turnout | 3373 | 30.40 | |||
Registered electors | 11,094 | ||||
Labour gain from Conservative | Swing | ||||
Party | Candidate | Votes | % | ±% | |
---|---|---|---|---|---|
Labour | Hannah O`Neill | 1,492 | 48.4 | +4.4 | |
Conservative | Adam Rolfe* | 1,129 | 36.7 | -0.9 | |
Green | Marcello Bianco | 232 | 7.5 | +1.3 | |
Liberal Democrats | Benjamin John Edwards | 195 | 6.3 | -0.5 | |
Rejected ballots | 32 | 1.0 | |||
Turnout | 3080 | 30.41 | |||
Registered electors | 10,129 | ||||
Labour gain from Conservative | Swing | ||||
Party | Candidate | Votes | % | ±% | |
---|---|---|---|---|---|
Liberal Democrats | Marie Bradburn* | 1,532 | 53.5 | -3.8 | |
Labour | Mustapha Zamaan | 709 | 24.7 | -1.5 | |
Conservative | Krishna Panthula | 392 | 13.7 | -1.8 | |
Green | Lucy Rebecca Bjorck | 213 | 7.4 | N/A | |
Rejected ballots | 19 | 0.7 | |||
Turnout | 2865 | 30.07 | |||
Registered electors | 9,527 | ||||
Liberal Democrats hold | Swing | ||||
Party | Candidate | Votes | % | ±% | |
---|---|---|---|---|---|
Liberal Democrats | Uroy Clarke* | 1,652 | 45.7 | -13.1 | |
Conservative | Rishi Sharda | 938 | 25.9 | +2.9 | |
Labour | George Baldock | 767 | 21.2 | +5.4 | |
Green | James Richard Hadfield | 174 | 4.8 | N/A | |
Heritage | Alfred Saint-Clair | 64 | 1.8 | -0.6 | |
Rejected ballots | 22 | 0.6 | |||
Turnout | 3617 | 26.78 | |||
Registered electors | 13,506 | ||||
Liberal Democrats hold | Swing | ||||
Party | Candidate | Votes | % | ±% | |
---|---|---|---|---|---|
Liberal Democrats | Graham Eaton | 1,263 | 36.8 | -11.2 | |
Conservative | Charlotte Hall* | 1,107 | 32.2 | +3.0 | |
Labour | Matt Curtis | 835 | 24.3 | +6.9 | |
Green | Carol Barac | 209 | 6.1 | +0.6 | |
Rejected ballots | 21 | 0.6 | |||
Turnout | 3435 | 34.68 | |||
Registered electors | 9,905 | ||||
Liberal Democrats gain from Conservative | Swing | ||||
Party | Candidate | Votes | % | ±% | |
---|---|---|---|---|---|
Labour | Martin Ronald Petchey | 1,383 | 53.5 | +7.5 | |
Conservative | Brian Thomas Hingley | 664 | 25.7 | +0.6 | |
Liberal Democrats | Russell Frederick Houchin | 293 | 11.3 | -2.5 | |
Green | Joe French | 224 | 8.7 | -2.1 | |
Rejected ballots | 23 | 0.9 | |||
Turnout | 2587 | 23.67 | |||
Registered electors | 10,930 | ||||
Labour hold | Swing | ||||
Party | Candidate | Votes | % | ±% | |
---|---|---|---|---|---|
Conservative | Victoria Hopkins* | 1,990 | 46.8 | +9.9 | |
Labour | Rukhsana Malik | 1525 | 35.9 | -5.2 | |
Green | Peter William Skelton | 423 | 10.0 | -0.4 | |
Liberal Democrats | Edis Bevan | 272 | 6.4 | -0.7 | |
Rejected ballots | 38 | 0.9 | |||
Turnout | 4248 | 33.34 | |||
Registered electors | 12,743 | ||||
Conservative hold | Swing | ||||
Party | Candidate | Votes | % | ±% | |
---|---|---|---|---|---|
Labour | Mandy Legg | 1,457 | 44.6 | -3.9 | |
Conservative | Rajeev Sharma | 1214 | 37.2 | -1.4 | |
Liberal Democrats | Garrath Green | 251 | 7.7 | ±0.0 | |
Green | Timothy Lee | 174 | 5.3 | +0.1 | |
Independent | Ray Brady | 152 | 4.7 | N/A | |
Rejected ballots | 17 | 0.5 | |||
Turnout | 3265 | 32.74 | |||
Registered electors | 9,972 | ||||
Labour hold | Swing | ||||
Party | Candidate | Votes | % | ±% | |
---|---|---|---|---|---|
Liberal Democrats | Duncan Banks | 1,118 | 43.8 | -7.8 | |
Labour | Monica Stella Dowling | 623 | 24.4 | +5.3 | |
Conservative | Devin Hindry | 500 | 19.6 | -2.6 | |
Green | Vanessa Skelton | 185 | 7.2 | +0.1 | |
Independent | Taimyr Pouaty | 109 | 4.3 | N/A | |
Rejected ballots | 20 | 0.8 | |||
Turnout | 2555 | 27.82 | |||
Registered electors | 9,184 | ||||
Liberal Democrats hold | Swing | ||||
Party | Candidate | Votes | % | ±% | |
---|---|---|---|---|---|
Conservative | Chris Wardle* | 1,672 | 47.9 | +3.4 | |
Liberal Democrats | Scott Humphries | 796 | 22.8 | -9.0 | |
Labour | Carol Wood | 776 | 22.2 | +2.0 | |
Green | Jason Scott Down | 220 | 6.3 | N/A | |
Rejected ballots | 27 | 0.8 | |||
Turnout | 3491 | 34.58 | |||
Registered electors | 10,096 | ||||
Conservative hold | Swing | ||||
Party | Candidate | Votes | % | ±% | |
---|---|---|---|---|---|
Liberal Democrats | Tony Oyakhire* | 1,263 | 45.9 | -0.2 | |
Conservative | Jamie Lee Rossiter | 685 | 24.9 | -9.4 | |
Labour | Saskia Soden | 621 | 22.6 | +6.7 | |
Green | Conner Hughes | 162 | 5.9 | N/A | |
Rejected ballots | 21 | 0.8 | |||
Turnout | 2752 | 31.16 | |||
Registered electors | 8,833 | ||||
Liberal Democrats hold | Swing | ||||
Party | Candidate | Votes | % | ±% | |
---|---|---|---|---|---|
Conservative | Keith McLean* | 2,234 | 52.5 | +8.7 | |
Labour | Dan Rowland | 1505 | 35.4 | -9.4 | |
Green | Catherine Jean Rose | 387 | 9.1 | +3.5 | |
Liberal Democrats | Rebecca Ann Cave | 110 | 2.6 | -0.5 | |
Rejected ballots | 20 | 0.5 | |||
Turnout | 4256 | 42.43 | |||
Registered electors | 10,030 | ||||
Conservative hold | Swing | ||||
Party | Candidate | Votes | % | ±% | |
---|---|---|---|---|---|
Liberal Democrats | Saleena Raja | 1,379 | 42.9 | +4.2 | |
Conservative | Ketan Kadakia | 1013 | 31.5 | -7.1 | |
Labour | Mike Kasibo | 611 | 19.0 | +1.7 | |
Green | Dominic John Malcolm Taylor | 185 | 5.8 | +0.4 | |
Rejected ballots | 24 | 0.7 | |||
Turnout | 3212 | 34.07 | |||
Registered electors | 9,428 | ||||
Liberal Democrats gain from Conservative | Swing | ||||
Party | Candidate | Votes | % | ±% | |
---|---|---|---|---|---|
Labour | Victoria Bamisile | 1,652 | 49.2 | -1.1 | |
Conservative | Amanda Marlow | 706 | 21.0 | -11.0 | |
Reform UK | Sean Porter | 422 | 12.6 | N/A | |
Green | Gary Nicholas Lloyd | 304 | 9.0 | +0.1 | |
Liberal Democrats | Greg Duffield | 255 | 7.6 | -0.5 | |
Rejected ballots | 21 | 0.6 | |||
Turnout | 3360 | 30.30 | |||
Registered electors | 11,090 | ||||
Labour gain from Conservative | Swing | ||||
Party | Candidate | Votes | % | ±% | |
---|---|---|---|---|---|
Labour | Joe Hearnshaw* | 2,077 | 50.5 | +4.3 | |
Conservative | Denise Brunning | 1389 | 33.8 | -3.0 | |
Liberal Democrats | Richard Michael Greenwood | 323 | 7.9 | -2.1 | |
Green | Joan Christine Hughes | 293 | 7.1 | +0.2 | |
Rejected ballots | 30 | 0.7 | |||
Turnout | 4112 | 33.09 | |||
Registered electors | 12,428 | ||||
Labour hold | Swing | ||||
Party | Candidate | Votes | % | ±% | |
---|---|---|---|---|---|
Conservative | Manish Verma* | 1,566 | 48.6 | +2.9 | |
Labour | Christian Durugo | 1260 | 39.1 | -1.5 | |
Green | Geoffrey Travis Waggott | 218 | 6.8 | -0.2 | |
Liberal Democrats | Dominic Dyer | 157 | 4.9 | +0.2 | |
Rejected ballots | 18 | 0.6 | |||
Turnout | 3219 | 35.06 | |||
Registered electors | 9,182 | ||||
Conservative hold | Swing | ||||
Party | Candidate | Votes | % | ±% | |
---|---|---|---|---|---|
Labour | Ansar Hussain* | 1,748 | 56.9 | -5.3 | |
Conservative | Edith Bald | 541 | 17.6 | -1.8 | |
Green | Alan Herbert Francis | 515 | 16.8 | +5.0 | |
Liberal Democrats | Rachel Chanalaris | 251 | 8.2 | +1.6 | |
Rejected ballots | 18 | 0.6 | |||
Turnout | 3073 | 28.31 | |||
Registered electors | 10,855 | ||||
Labour hold | Swing | ||||
Party | Candidate | Votes | % | ±% | |
---|---|---|---|---|---|
Labour | Donna Juli Fuller* | 1,421 | 63.2 | -2.1 | |
Conservative | David George Caraivan | 447 | 19.9 | +1.9 | |
Green | Tony Coughlan | 217 | 9.7 | +1.8 | |
Liberal Democrats | Caroline Picking | 148 | 6.6 | -2.2 | |
Rejected ballots | 15 | 0.7 | |||
Turnout | 2248 | 19.20 | |||
Registered electors | 11,710 | ||||
Labour hold | Swing | ||||
Lewes District Council in East Sussex, England is elected every four years. Since the last boundary changes in 2019, 41 councillors are elected from 21 wards.
Hertfordshire County Council in England is elected every four years. Since the last boundary changes took effect in 2017 there have been 78 electoral divisions electing one councillor each.
Milton Keynes City Council is the local authority of the City of Milton Keynes in Buckinghamshire, England. It is a unitary authority, having the powers of a non-metropolitan county and district council combined. It has both borough status and city status. The borough, which extend beyond the ONS-defined Milton Keynes urban area and encompasses a substantial rural component, is divided into 19 wards, electing 57 councillors.
The 2006 Camden Council election took place on 4 May 2006 to elect members of Camden London Borough Council in London, England. The whole council was up for election and the Labour Party lost overall control of the council to no overall control.
Thanet District Council elections are held every four years to elect Thanet District Council in Kent, England. Since the last boundary changes in 2003 the council has comprised 56 councillors representing 23 wards.
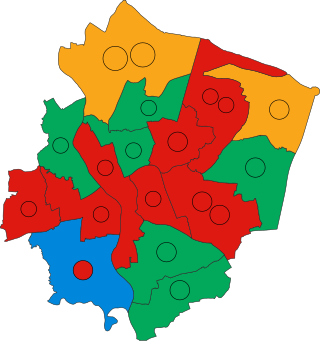
The 2000 Milton Keynes Council election took place on 4 May 2000 to elect members of Milton Keynes Council in Buckinghamshire, England. One third of the council was up for election and the council stayed under no overall control.
The 2006 Brent London Borough Council election took place on 4 May 2006 to elect members of Brent London Borough Council in London, England. The whole council was up for election and the Labour Party lost overall control of the council to no overall control.
The 2010 Brent London Borough Council election took place on 6 May 2010 to elect members of Brent London Borough Council in London, England. The whole council was up for election and the Labour Party gained overall control of the council from no overall control.
The 2014 Brent London Borough Council election took place on 22 May 2014 to elect members of Brent London Borough Council in London, England. The whole council was up for election and the Labour Party stayed in overall control of the council.
The 2015 Redcar and Cleveland Borough Council election took place on 7 May 2015 to elect members of Redcar and Cleveland Borough Council in England. This was on the same day as other local elections, as well as the 2015 General Election. One major change was that Council Leader George Dunning and many other Labour councillors resigned from the party or were deselected and ran as independent candidates. The election saw the council return to no overall control.
The 2015 Christchurch Borough Council election took place on 7 May 2015 to elect members of Christchurch Borough Council in Dorset, England. The whole council was up for election and the Conservative party stayed in overall control of the council.
The 2015 Rother District Council election took place on 7 May 2015 to elect members of Rother District Council in East Sussex, England. The whole council was up for election and the Conservative Party stayed in overall control of the council.
The 2018 United Kingdom local elections were held on Thursday 3 May 2018, with local council elections taking place in all 32 London boroughs, 34 metropolitan boroughs, 67 district and borough councils and 17 unitary authorities. There were also direct elections for the mayoralties of Hackney, Lewisham, Newham, Tower Hamlets and Watford.
The 2018 Lambeth London Borough Council election took place on 3 May 2018 alongside other local elections in London, to elect members of Lambeth London Borough Council in England. The election saw Labour remain in control of Lambeth Council with a slightly reduced majority, winning over 90% of the seats. The Green Party achieved its best-ever result in the borough, winning five seats and becoming the official opposition and the largest Green group in London.
The 2022 North Yorkshire Council election took place on 5 May 2022, alongside the other local elections. These were the last elections to North Yorkshire County Council, and the elected councillors would also serve as the first councillors on the North Yorkshire Council, which replaced the existing county council in April 2023.
The 2022 Birmingham City Council election took place on 5 May 2022, with all 101 council seats up for election across 37 single-member and 32 two-member wards. The election was held alongside other local elections across Great Britain and town council elections in Sutton Coldfield.
The 2023 Breckland District Council election took place on 4 May 2023 to elect members of Breckland District Council in England. This was on the same day as other local elections. The boundaries for this election were the same as those used in 2015 and 2019.
An election was held on 4 May 2023, to elect all 41 members of Gedling Borough Council in England. This took place as part of the 2023 United Kingdom local elections.
The 2024 Worcester City Council election was held on Thursday 2 May 2024, alongside the other local elections in the United Kingdom being held on the same day. All 35 members of Worcester City Council in Worcestershire were elected following boundary changes. The council remained under no overall control.
The 2024 Burnley Borough Council election was held on Thursday 2 May 2024, alongside the other local elections in the United Kingdom on the same day. One-third of the 45 members of Burnley Borough Council in Lancashire were elected.