| |||||||||||||||||||||||||||||||||||||||||||||||||||||||||||||||||||||||||||||||||||||
22 out of 66 seats to Sefton Metropolitan Borough Council 34 seats needed for a majority | |||||||||||||||||||||||||||||||||||||||||||||||||||||||||||||||||||||||||||||||||||||
---|---|---|---|---|---|---|---|---|---|---|---|---|---|---|---|---|---|---|---|---|---|---|---|---|---|---|---|---|---|---|---|---|---|---|---|---|---|---|---|---|---|---|---|---|---|---|---|---|---|---|---|---|---|---|---|---|---|---|---|---|---|---|---|---|---|---|---|---|---|---|---|---|---|---|---|---|---|---|---|---|---|---|---|---|---|
Turnout | TBD | ||||||||||||||||||||||||||||||||||||||||||||||||||||||||||||||||||||||||||||||||||||
| |||||||||||||||||||||||||||||||||||||||||||||||||||||||||||||||||||||||||||||||||||||
Winner of each seat at the 2024 Sefton Metropolitan Borough Council election | |||||||||||||||||||||||||||||||||||||||||||||||||||||||||||||||||||||||||||||||||||||
|
The 2024 Sefton Metropolitan Borough Council election took place on 2 May 2024 to elect members of Sefton Metropolitan Borough Council in Merseyside, England. [1] This was on the same day as other local elections across England, Liverpool's City Region mayoral election and Merseyside's Police and Crime Commissioner election.
As is typical for Sefton's local elections, twenty-two seats of the sixty-six total were contested. The Labour party have controlled the council since the 2012 elections, and prior to the election had a comfortable working majority of 13. Shortly before the election, this was reduced from their majority of 18 they had had following the previous year's election; in early March Labour Councillor Trish Hardy resigned from her Litherland ward seat leaving a vacancy, and less than a month before polling day Councillors Natasha Carlin and Sean Halsall left Labour in protest of the party's policy direction and stance on the war in Gaza. [2]
The majority of the seats contested were held by Labour, who defended fifteen of the twenty-two seats. The Liberal Democrats defended three seats, and the Conservatives defended two seats. [3] The then-vacant Litherland seat was also contested alongside two seats held by independent councillors.
Labour and the Conservatives contested all seats up for election, while the Green Party contested every seat except 1 (Linacre). As a result of administrative confusion some of the Green Party candidates had the description “Green Party” and the party’s logo (16 candidates) next to their name on the voting ballots while others only had the logo (5 candidates). Additionally the Liberal Democrats contested close to all seats, with candidates representing Reform UK, TUSC, Freedom Alliance, localist groups, also stood a small number of candidates alongside 2 independents.
Amongst other results, the Green party gained their first seat ever on the council, narrowly winning in Church ward by just over a hundred votes. [4]
After 2023 election | Before 2024 election [5] | ||||
---|---|---|---|---|---|
Party | Seats | Party | Seats | ||
Labour | 51 | Labour | 48 | ||
Liberal Democrats | 9 | Liberal Democrats | 9 | ||
Conservative | 5 | Conservative | 5 | ||
Independent | 0 | Independent | 2 | ||
Lydiate and Maghull Community Independents | 1 | Lydiate and Maghull Community Independents | 1 | ||
Vacant | 1 |
Changes:
2024 Sefton Metropolitan Borough Council election | ||||||||||
---|---|---|---|---|---|---|---|---|---|---|
Party | This election | Full council | This election | |||||||
Seats | Net | Seats % | Other | Total | Total % | Votes | Votes % | +/− | ||
Labour | 27 | |||||||||
Liberal Democrats | 6 | |||||||||
Conservative | 3 | |||||||||
Lydiate and Maghull Community Independents | 1 | |||||||||
Freedom Alliance | 0 | |||||||||
Formby Residents Action Group | 0 | |||||||||
Green | 0 | |||||||||
Reform UK | 0 | |||||||||
TUSC | 0 | |||||||||
Independent | 0 | |||||||||
The Statements of Persons Nominated, which details the candidates standing in each ward, were released by Sefton Council on 8 April 2024 following the close of nominations. [1] Councillors that were standing for re-election are marked with an asterisk (*). The results for each ward were announced the day after the election. [7]
Party | Candidate | Votes | % | ±% | |
---|---|---|---|---|---|
Liberal Democrats | Lynne Thompson* | 1,978 | 51.5 | 16.3 | |
Labour | Frank Hanley | 1,193 | 31.0 | 4.5 | |
Conservative | Ryan Abbott | 527 | 13.7 | 11.1 | |
Green | Laurence Rankin | 145 | 3.8 | 0.6 | |
Majority | 785 | 21.4 | 21.1 | ||
Registered electors | 10,061 | ||||
Turnout | 3,843 | 38.2 | |||
Rejected ballots | 27 | ||||
Liberal Democrats hold | Swing | 10.4 | |||
Party | Candidate | Votes | % | ±% | |
---|---|---|---|---|---|
Labour | Sonya Kelly* | 1,435 | 41.6 | 3.3 | |
Liberal Democrats | Erin Harvey | 1,357 | 39.3 | 1.2 | |
Conservative | Sam Harris | 489 | 14.2 | 0.1 | |
Green | Jeff Bee | 168 | 4.9 | 1.2 | |
Majority | 78 | ||||
Registered electors | 10,018 | ||||
Turnout | 3,449 | 34.4 | 1.0 | ||
Rejected ballots | 26 | ||||
Labour hold | Swing | 2.3 | |||
Party | Candidate | Votes | % | ±% | |
---|---|---|---|---|---|
Labour | Diane Roscoe* | 2,249 | 68.3 | 1.4 | |
Conservative | Katie Burgess | 548 | 16.7 | 1.9 | |
Green | Kieran Dams | 270 | 8.2 | 1.1 | |
Liberal Democrats | Brian Dunning | 224 | 6.8 | 0.6 | |
Majority | 1,701 | 51.6 | |||
Registered electors | 9,159 | ||||
Turnout | 3,291 | 35.9 | |||
Rejected ballots | 25 | ||||
Labour hold | Swing | 1.7 | |||
Party | Candidate | Votes | % | ±% | |
---|---|---|---|---|---|
Liberal Democrats | Mike Sammon | 1,161 | 36.5 | 6.2 | |
Conservative | Gary Haran Doyle | 1,002 | 31.5 | 2.6 | |
Labour | Callum Naylor | 816 | 25.6 | 6.5 | |
Green | Stephen Hesketh | 204 | 6.4 | 2.3 | |
Majority | 159 | ||||
Registered electors | 9,716 | ||||
Turnout | 3,441 | 32.8 | 2.7 | ||
Rejected ballots | 28 | ||||
Liberal Democrats gain from Conservative | Swing | 1.8 | |||
Party | Candidate | Votes | % | ±% | |
---|---|---|---|---|---|
Green | Neil Doolin | 1,412 | 50.6 | 10.6 | |
Labour Co-op | Paul Cummins* | 1,307 | 46.5 | 7.1 | |
Conservative | Dorothy Brown | 91 | 3.2 | 1.0 | |
Majority | 105 | ||||
Registered electors | 9,091 | ||||
Turnout | 2,810 | 30.9 | 0.9 | ||
Rejected ballots | 18 | ||||
Green gain from Labour | Swing | 8.9 | |||
Party | Candidate | Votes | % | ±% | |
---|---|---|---|---|---|
Labour | Maria Porter | 1,580 | 78.9 | 2.0 | |
Reform UK | Leighton Sealeaf | 122 | 6.1 | New | |
Green | Kate Robinson | 114 | 5.7 | 1.6 | |
Conservative | Iain Beckett | 91 | 4.5 | 2.3 | |
TUSC | Dean Young | 55 | 2.7 | 2.3 | |
Liberal Democrats | Rowenna Gibson | 41 | 2.0 | New | |
Majority | 1,458 | ||||
Registered electors | 9,002 | ||||
Turnout | 2,003 | 22.3 | |||
Rejected ballots | 20 | ||||
Labour hold | Swing | 4.1 | |||
Party | Candidate | Votes | % | ±% | |
---|---|---|---|---|---|
Conservative | Mike Prendergast* | 1,379 | 41.7 | 7.5 | |
Liberal Democrats | Damian Bond | 967 | 29.3 | 12.8 | |
Labour | Helen Duerden | 764 | 23.1 | 4.1 | |
Green | David Newman | 195 | 5.9 | 1.3 | |
Rejected ballots | 29 | ||||
Majority | 412 | ||||
Registered electors | 10,442 | ||||
Turnout | 31.7 | ||||
Conservative hold | Swing | 10.2 | |||
Party | Candidate | Votes | % | ±% | |
---|---|---|---|---|---|
Labour | Paulette Lappin* | 1,541 | 80.9 | 0.1 | |
Green | Lyndsey Doolin | 187 | 9.8 | 0.3 | |
Conservative | Michael Shaw | 120 | 6.3 | ||
Liberal Democrats | Adarsh Makdani | 56 | 2.9 | 0.2 | |
Rejected ballots | 17 | ||||
Majority | 1,354 | 71.8 | |||
Turnout | 1,904 | 20.6 | |||
Labour hold | Swing | 0.2 | |||
Party | Candidate | Votes | % | ±% | |
---|---|---|---|---|---|
Labour | Karen Cavanagh | ||||
Liberal Democrats | Annie Gorski | ||||
Formby Residents Action Group | Dave Irving | ||||
Conservative | Joe Riley* | ||||
Green | Michael Walsh | ||||
Rejected ballots | |||||
Majority | |||||
Turnout |
Party | Candidate | Votes | % | ±% | |
---|---|---|---|---|---|
Labour | Jen Corcoran* | 1,358 | 43.8 | 8.7 | |
Liberal Democrats | Daniel Lewis | 1,118 | 36.1 | 15.7 | |
Conservative | Owen Phillips | 440 | 14.2 | 5.3 | |
Green | Rob Wesley | 184 | 5.9 | 1.6 | |
Majority | 240 | ||||
Registered electors | 10,720 | ||||
Turnout | 3,100 | 28.9 | 0.1 | ||
Rejected ballots | 33 | ||||
Labour hold | Swing | 12.2 | |||
Party | Candidate | Votes | % | ±% | |
---|---|---|---|---|---|
Conservative | John Campbell | ||||
Liberal Democrats | David Mellalieu | ||||
Labour | Joanne Williams | ||||
Rejected ballots | |||||
Majority | |||||
Turnout |
Party | Candidate | Votes | % | ±% | |
---|---|---|---|---|---|
Conservative | Colin Appleton | ||||
Liberal Democrats | Roy Connell | ||||
Green | Amber-Page Moss | ||||
Labour | Paula Murphy | ||||
Independent | Ian Smith | ||||
Rejected ballots | |||||
Majority | |||||
Turnout |
Party | Candidate | Votes | % | ±% | |
---|---|---|---|---|---|
Conservative | Martyn Barber | ||||
Liberal Democrats | John Gibson | ||||
Labour | Dominic McNabb | ||||
Green | James O’Keeffe | ||||
Rejected ballots | |||||
Majority | |||||
Turnout |
Party | Candidate | Votes | % | ±% | |
---|---|---|---|---|---|
Liberal Democrats | John Dodd* | 1,452 | 46.3 | 1.6 | |
Labour | Steve Jowett | 863 | 27.5 | 4.0 | |
Conservative | Bob Teesdale | 613 | 19.5 | 6.7 | |
Green | Pauline Anne Hesketh | 208 | 6.6 | 1.0 | |
Majority | 589 | ||||
Registered electors | 10,016 | ||||
Turnout | 3,136 | 31.3 | 2.7 | ||
Rejected ballots | 21 | ||||
Liberal Democrats hold | Swing | 1.2 | |||
Party | Candidate | Votes | % | ±% | |
---|---|---|---|---|---|
Conservative | Marcus Bleasdale | ||||
Green | David Collins | ||||
Labour | Sam Hinde | ||||
Liberal Democrats | Paul Young | ||||
Rejected ballots | |||||
Majority | |||||
Turnout |
Party | Candidate | Votes | % | ±% | |
---|---|---|---|---|---|
Green | Simon Baron | ||||
TUSC | Owen Croft | ||||
Liberal Democrats | Vic Foulds | ||||
Conservative | Adam Marsden | ||||
Labour | Tom Spring* | ||||
Freedom Alliance | Maria Walsh | ||||
Rejected ballots | |||||
Majority | |||||
Turnout |
Party | Candidate | Votes | % | ±% | |
---|---|---|---|---|---|
Labour | Dave Neary | 1,487 | 55.3 | 4.0 | |
Conservative | Margaret Middleton | 461 | 17.2 | 1.5 | |
Liberal Democrats | Lesley Delves | 433 | 16.1 | 2.6 | |
Green | David McIntosh | 306 | 11.4 | 5.0 | |
Rejected ballots | 40 | ||||
Majority | 1,026 | ||||
Turnout | 2,687 | 26.3 | 2.7 | ||
Labour hold | Swing | 2.8 | |||
Party | Candidate | Votes | % | ±% | |
---|---|---|---|---|---|
Liberal Democrats | Keith Cawdron | ||||
Green | Roy Greason | ||||
Lydiate and Maghull Community Independents | Paul McCord | ||||
Labour | Chloe Parker | ||||
Conservative | Craig Titherington | ||||
Rejected ballots | |||||
Majority | |||||
Turnout |
Party | Candidate | Votes | % | ±% | |
---|---|---|---|---|---|
Formby Residents Action Group | Maria Bennett | ||||
Green | Alison Gibbon | ||||
Liberal Democrats | Lisa Nicolson-Smith | ||||
Labour | Catie Page* | ||||
Conservative | Angelica Sadrieva | ||||
Rejected ballots | |||||
Majority | |||||
Turnout |
Party | Candidate | Votes | % | ±% | |
---|---|---|---|---|---|
Labour | Joe Johnson | 1,270 | 78.6 | -3.5 | |
TUSC | Conor O’Neill | 127 | 7.9 | -1.2 | |
Green | Rupert Shoebridge | 119 | 7.4 | New | |
Conservative | Henry Bliss | 100 | 6.2 | -2.9 | |
Majority | 1,143 | ||||
Registered electors | 8,028 | ||||
Turnout | 1,616 | 20.1 | -0.4 | ||
Rejected ballots | 11 | ||||
Labour hold | Swing | 2.3 | |||
Party | Candidate | Votes | % | ±% | |
---|---|---|---|---|---|
Independent | Marie Blease | ||||
Green | Paul Dunbar | ||||
Labour | James Hansen* | ||||
Conservative | Daniel Kirk | ||||
Lydiate and Maghull Community Independents | Joanne McCall | ||||
Liberal Democrats | James Tattersall | ||||
Rejected ballots | |||||
Majority | |||||
Turnout |
Party | Candidate | Votes | % | ±% | |
---|---|---|---|---|---|
Labour | Michael Roche* | 2,386 | 68.7 | +7.3 | |
Liberal Democrats | Hannah Gee | 452 | 13.0 | -7.2 | |
Green | Samantha Cook | 380 | 10.9 | +1.0 | |
Conservative | Paul Barber | 253 | 7.3 | -1.3 | |
Rejected ballots | 25 | ||||
Majority | 1,934 | 55.7 | |||
Registered electors | 10,505 | ||||
Turnout | 3,471 | ||||
Labour hold | Swing | 7.25 | |||
The Metropolitan Borough of Sefton is a metropolitan borough of Merseyside, England. It was formed on 1 April 1974, by the amalgamation of the county boroughs of Bootle and Southport, the municipal borough of Crosby, the urban districts of Formby and Litherland, and part of West Lancashire Rural District. It consists of a coastal strip of land on the Irish Sea which extends from Southport in the north to Bootle in the south, and an inland part to Maghull in the south-east, bounded by the city of Liverpool to the south, the Metropolitan Borough of Knowsley to the south-east, and West Lancashire to the east.
Bootle is a constituency which has been represented in the House of Commons of the UK Parliament, since 2015 by Peter Dowd of the Labour Party.
Liverpool, Walton is a constituency represented in the House of Commons of the UK Parliament since 2017 by Dan Carden of the Labour Party. Carden won the highest percentage share of the vote in June 2017 of 650 constituencies, 85.7%. It is the safest Labour seat in the United Kingdom, and the safest seat in the country having been won by 85% of the vote in the most recent election in 2019.
Southport is a constituency in Merseyside which has been represented in the House of Commons of the UK Parliament since 2017 by Damien Moore of the Conservative Party.
Seaforth is a district in the Metropolitan Borough of Sefton, Merseyside, England. Historically in Lancashire, it is north of Liverpool, between Bootle and Waterloo.
Sefton Central is a constituency represented by Bill Esterson of the Labour Party since 2010.
Sefton Metropolitan Borough Council elections are generally held three years out of every four, with a third of the council being elected each time. Sefton Metropolitan Borough Council, generally known as Sefton Council, is the local authority for the metropolitan borough of Sefton in Merseyside, England. Since the last boundary changes in 2004, 66 councillors have been elected from 22 wards.
The 2003 West Lancashire District Council election took place on 1 May 2003 to elect members of West Lancashire District Council in Lancashire, England. One third of the council was up for election and the Conservative Party stayed in overall control of the council.
Sefton Council is the governing body for the Metropolitan Borough of Sefton in the ceremonial county of Merseyside, in North West England. The council was under no overall control from the 1980s until 2012 when the Labour Party took control. It is a constituent council of Liverpool City Region Combined Authority.
The 2008 Solihull Metropolitan Borough Council election took place on 1 May 2008 to elect members of Solihull Metropolitan Borough Council in the West Midlands, England. One third of the council was up for election and the Conservative Party gained overall control of the council from no overall control.
The 2010 West Lancashire Borough Council election took place on 6 May 2010 to elect members of West Lancashire Borough Council in Lancashire, England. One third of the council was up for election and the Conservative Party stayed in overall control of the council.
The 1999 Sandwell Metropolitan Borough Council election took place on 6 May 1999 to elect members of Sandwell Metropolitan Borough Council in the West Midlands, England. One third of the council was up for election and the Labour party stayed in overall control of the council.
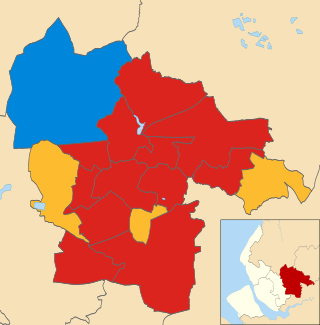
The 2012 Sefton Metropolitan Borough Council election took on 3 May 2012 to elect members of Sefton Metropolitan Borough Council in England, as part of the 2012 United Kingdom local elections. 22 seats, representing one third of the total Council membership, were up for election in single-member wards. Ten - nearly half - of the members elected were newcomers to the Council; five of these defeated sitting Councillors seeking re-election, whilst in the other five wards, the incumbent retired. Two incumbents stood under different labels to those they were elected under in 2008; both were defeated in their wards.
The Socialist Labour Party (SLP) is a socialist political party in the United Kingdom. The party was established in 1996 and is led by Arthur Scargill, a former Labour Party member and the former leader of the National Union of Mineworkers. The party's name highlights its commitment to socialism and acknowledges Clause IV of the Labour Party's former constitution, as fundamental to the party's identity.
Wirral Council is the local authority of the Metropolitan Borough of Wirral in Merseyside, England. Wirral is a metropolitan borough, one of five in Merseyside, and provides the majority of local government services in Wirral. The council is a constituent member of the Liverpool City Region Combined Authority.
The 2010 St Helens Metropolitan Borough Council election took place on 6 May 2010 to elect members of St Helens Metropolitan Borough Council in Merseyside, England. One third of the council was up for election and the Labour Party gained overall control of the council from no overall control.
The 2018 Wirral Metropolitan Borough Council election took place on 3 May 2018 to elect members of Wirral Metropolitan Borough Council in England. This election was held on the same day as other local elections.
The 2019 Wirral Metropolitan Borough Council election took place on 2 May 2019 to elect members of Wirral Metropolitan Borough Council in England. This election was held on the same day as other local elections.
The 2021 Wirral Metropolitan Borough Council election took place on 6 May 2021 to elect members of Wirral Metropolitan Borough Council in England. This election was held on the same day as other local elections. The election was originally due to take place in May 2020, but was postponed due to the COVID-19 pandemic. This delay meant those elected would serve only a three-year term.
The 2022 Sefton Metropolitan Borough Council election took place on 5 May 2022 to elect members of Sefton Council. This was on the same day as other local elections. 21 of the 66 seats were up for election, with 1 ward being uncontested.