| ||||||||||||||||||||||||||||||||||||||||||||||||||||||||||||||||||||||||||||||||||
All 39 seats on Tunbridge Wells Borough Council 20 seats needed for a majority | ||||||||||||||||||||||||||||||||||||||||||||||||||||||||||||||||||||||||||||||||||
---|---|---|---|---|---|---|---|---|---|---|---|---|---|---|---|---|---|---|---|---|---|---|---|---|---|---|---|---|---|---|---|---|---|---|---|---|---|---|---|---|---|---|---|---|---|---|---|---|---|---|---|---|---|---|---|---|---|---|---|---|---|---|---|---|---|---|---|---|---|---|---|---|---|---|---|---|---|---|---|---|---|---|
| ||||||||||||||||||||||||||||||||||||||||||||||||||||||||||||||||||||||||||||||||||
Winner of each seat at the 2024 Tunbridge Wells Borough Council election | ||||||||||||||||||||||||||||||||||||||||||||||||||||||||||||||||||||||||||||||||||
|
The 2024 Tunbridge Wells Borough Council election took place on 2 May 2024 to elect members of Tunbridge Wells Borough Council in Kent, England. [1] This was on the same day as other local elections.
Following a review of ward boundaries, the election is being contested with new electoral divisions and with a reduced number of seats, 39 down from 48. [2]
2024 Tunbridge Wells Borough Council election | ||||||||||
---|---|---|---|---|---|---|---|---|---|---|
Party | Candidates | Seats | Gains | Losses | Net gain/loss | Seats % | Votes % | Votes | +/− | |
Liberal Democrats | 39 | 22 | 3 | 0 | 5 | 56.4 | 34.2 | 28,797 | +8.9 | |
Conservative | 39 | 7 | 0 | 2 | 4 | 18.0 | 29.3 | 24,673 | –0.1 | |
Labour | 25 | 5 | 0 | 0 | 2 | 12.8 | 14.3 | 12,022 | –2.0 | |
Tunbridge Wells Alliance | 10 | 4 | 0 | 1 | 3 | 10.3 | 8.8 | 7,457 | –9.3 | |
Independent | 19 | 1 | 0 | 0 | 3 | 2.6 | 5.9 | 4,977 | +3.5 | |
Green | 18 | 0 | 0 | 0 | 0.0 | 6.5 | 5,485 | –1.7 | ||
Reform UK | 5 | 0 | 0 | 0 | 0.0 | 1.1 | 906 | +0.8 |
The Statement of Persons Nominated, which details the candidates standing in each ward, was released by Tunbridge Wells Borough Council following the close of nominations on 8 April 2024. [3]
Party | Candidate | Votes | % | ±% | |
---|---|---|---|---|---|
Conservative | Andy Fairweather* | 917 | 53.1 | ||
Alliance | Nancy Warne* | 843 | 48.8 | ||
Conservative | David Somers | 640 | 37.0 | ||
Conservative | John Austen | 547 | 31.7 | ||
Green | John Hurst | 360 | 20.8 | ||
Labour | Joel Turner | 275 | 15.9 | ||
Liberal Democrats | James Cole | 197 | 11.4 | ||
Liberal Democrats | Sally Moesgaard-Kjeldsen | 197 | 11.4 | ||
Independent | Chris Hoare | 155 | 9.0 | ||
Liberal Democrats | Brian Guinnessy | 139 | 8.0 | ||
Turnout | 1,736 | 31.3 | |||
Registered electors | 5,552 | ||||
Conservative win (new seat) | |||||
Alliance win (new seat) | |||||
Conservative win (new seat) |
Party | Candidate | Votes | % | ±% | |
---|---|---|---|---|---|
Liberal Democrats | Justine Rutland* | 1,184 | 51.1 | ||
Liberal Democrats | Martin Brice* | 1,128 | 48.6 | ||
Liberal Democrats | David Osborne* | 1,070 | 46.1 | ||
Conservative | Alex Dunn | 713 | 30.7 | ||
Conservative | David Scott | 653 | 28.2 | ||
Conservative | Victoria White* | 620 | 26.7 | ||
Green | Victoria Moll | 337 | 14.5 | ||
Labour | Martin Betts | 330 | 14.2 | ||
Labour | Greg Holder | 267 | 11.5 | ||
Independent | Sam Macdonald Walmsley | 166 | 7.2 | ||
Turnout | 2,323 | 37.6 | |||
Registered electors | 6,182 | ||||
Liberal Democrats hold | |||||
Party | Candidate | Votes | % | ±% | |
---|---|---|---|---|---|
Conservative | Tom Dawlings* | 903 | 41.1 | ||
Conservative | Beverley Palmer* | 846 | 38.5 | ||
Alliance | Ellen Neville* | 809 | 36.8 | ||
Alliance | Clare Escombe | 748 | 34.1 | ||
Conservative | Martin Taylor-Smith | 745 | 33.9 | ||
Labour | Mia Dahl | 309 | 14.1 | ||
Green | Debs Keech | 281 | 12.8 | ||
Liberal Democrats | Hazel Strouts | 267 | 12.2 | ||
Reform UK | Simon Hilton | 248 | 11.3 | ||
Liberal Democrats | Andrew Dawson | 228 | 10.4 | ||
Liberal Democrats | Vivian Widgery | 123 | 5.6 | ||
Independent | Angie Ward | 84 | 3.8 | ||
Independent | Dan Littlechild | 82 | 3.7 | ||
Turnout | 2,211 | 34.0 | |||
Registered electors | 6,497 | ||||
Conservative win (new seat) | |||||
Alliance win (new seat) |
Party | Candidate | Votes | % | ±% | |
---|---|---|---|---|---|
Labour Co-op | Dianne Hill* | 427 | 55.9 | ||
Liberal Democrats | Steve Humphreys | 130 | 17.0 | ||
Conservative | Freddie Mobbs | 82 | 10.7 | ||
Reform UK | Rick Williams | 61 | 8.0 | ||
Green | Paul Froome | 47 | 6.2 | ||
Independent | David Kain | 17 | 2.2 | ||
Turnout | 765 | 32.4 | |||
Registered electors | 2,362 | ||||
Labour Co-op win (new seat) |
Party | Candidate | Votes | % | ±% | |
---|---|---|---|---|---|
Liberal Democrats | Mark Munday* | 872 | 38.8 | ||
Liberal Democrats | Don Kent | 850 | 37.8 | ||
Liberal Democrats | Adrian Pitts | 849 | 37.8 | ||
Conservative | Ros Tucker | 777 | 34.6 | ||
Independent | Rodney Atkins* | 670 | 29.8 | ||
Conservative | Nicolas Maari | 609 | 27.1 | ||
Conservative | John Hall | 550 | 24.5 | ||
Independent | Begnat Robichaud | 370 | 16.5 | ||
Green | Trevor Bisdee | 340 | 15.1 | ||
Labour | Isobel Kerrigan | 224 | 10.0 | ||
Turnout | 2,254 | 34.4 | |||
Registered electors | 6,560 | ||||
Liberal Democrats win (new seat) | |||||
Liberal Democrats win (new seat) |
Party | Candidate | Votes | % | ±% | |
---|---|---|---|---|---|
Liberal Democrats | Jamie Johnson* | 1,185 | 47.0 | ||
Liberal Democrats | Christopher Hall* | 1,179 | 46.7 | ||
Liberal Democrats | Pamela Wilkinson* | 1,011 | 40.1 | ||
Conservative | James Allen | 685 | 27.2 | ||
Conservative | Zoe Dommett | 670 | 26.6 | ||
Conservative | David Evans | 637 | 25.2 | ||
Green | Penny Peerless | 334 | 13.2 | ||
Labour Co-op | Alan Bullion | 333 | 13.2 | ||
Green | Michael Calvert | 265 | 10.5 | ||
Green | Kate Sergeant | 240 | 9.5 | ||
Reform UK | John Spence | 209 | 8.3 | ||
Independent | Penny Kift | 180 | 7.1 | ||
Independent | Dino Myers-Lamptey | 146 | 5.8 | ||
Turnout | 2,532 | 36.9 | |||
Registered electors | 6,859 | ||||
Liberal Democrats win (new seat) | |||||
Liberal Democrats win (new seat) |
Party | Candidate | Votes | % | ±% | |
---|---|---|---|---|---|
Liberal Democrats | Matt Lowe | 1,240 | 44.5 | ||
Liberal Democrats | Corinna Keefe | 1,076 | 38.6 | ||
Liberal Democrats | Tara Matthews | 1,009 | 36.2 | ||
Alliance | Nick Pope* | 864 | 31.0 | ||
Conservative | Bob Atwood | 747 | 26.8 | ||
Conservative | Andrew Hobart | 712 | 25.5 | ||
Conservative | Sedat Zorba | 689 | 24.7 | ||
Green | Alasdair Fraser | 434 | 15.6 | ||
Labour | Sue Pound | 339 | 12.2 | ||
Labour | Jack Faulkner | 309 | 11.1 | ||
Reform UK | Michael Jerrom | 216 | 7.7 | ||
Turnout | 2,793 | 42.2 | |||
Registered electors | 6,616 | ||||
Liberal Democrats gain from Alliance | |||||
Liberal Democrats gain from Conservative | |||||
Liberal Democrats gain from Alliance |
Party | Candidate | Votes | % | ±% | |
---|---|---|---|---|---|
Liberal Democrats | Hugh Patterson* | 1,099 | 40.8 | ||
Liberal Democrats | Astra Birch | 1,032 | 38.3 | ||
Independent | David Hayward* | 989 | 36.7 | ||
Liberal Democrats | Colin Sefton | 888 | 33.0 | ||
Independent | Suzie Wakeman* | 807 | 30.0 | ||
Conservative | Paul Barrington-King* | 797 | 29.6 | ||
Conservative | Paul Roberts* | 554 | 20.6 | ||
Conservative | Vivek Gautam | 446 | 16.6 | ||
Green | Evelien Hurst-Buist | 226 | 8.4 | ||
Labour | Anne Musker | 183 | 6.8 | ||
Turnout | 2,701 | 41.5 | |||
Registered electors | 6,513 | ||||
Liberal Democrats win (new seat) | |||||
Independent win (new seat) |
Party | Candidate | Votes | % | ±% | |
---|---|---|---|---|---|
Conservative | Lynne Darrah | 1,034 | 37.7 | ||
Conservative | Thomas Mobbs | 904 | 33.0 | ||
Alliance | David Knight* | 887 | 32.3 | ||
Conservative | Jill Andrew | 863 | 31.5 | ||
Alliance | Alison Webster* | 786 | 28.7 | ||
Green | Jenny Fox | 532 | 19.4 | ||
Green | Geoff Mason | 439 | 16.0 | ||
Liberal Democrats | Quentin Rappoport | 367 | 13.4 | ||
Liberal Democrats | Gillian Douglass | 356 | 13.0 | ||
Independent | Paul Glazier | 331 | 12.1 | ||
Green | Helen Yeo | 329 | 12.0 | ||
Labour | Kevin Kerrigan | 300 | 10.9 | ||
Liberal Democrats | Michael Gill | 275 | 10.0 | ||
Labour | Andrew Scott | 254 | 9.3 | ||
Turnout | 2,751 | 35.1 | |||
Registered electors | 7,828 | ||||
Conservative win (new seat) | |||||
Alliance win (new seat) |
Party | Candidate | Votes | % | ±% | |
---|---|---|---|---|---|
Labour | Jayne Sharratt* | 1,004 | 30.9 | ||
Alliance | Matthew Sankey* | 975 | 30.0 | ||
Labour | Alex Britcher-Allan* | 886 | 27.3 | ||
Alliance | Paul Curry* | 828 | 25.5 | ||
Liberal Democrats | Rebecca Leach | 760 | 23.4 | ||
Liberal Democrats | Martin Franklin | 727 | 22.4 | ||
Liberal Democrats | John Moreland | 697 | 21.4 | ||
Labour | Phil Wheeler | 687 | 21.1 | ||
Conservative | Harry Allen* | 662 | 20.4 | ||
Conservative | Aaron Brand | 612 | 18.8 | ||
Conservative | James McInroy | 597 | 18.4 | ||
Green | Stephanie Gandon | 274 | 8.4 | ||
Reform UK | Mike Hardy | 172 | 5.3 | ||
Independent | Graham Withers | 170 | 5.2 | ||
Turnout | 3,257 | 44.3 | |||
Registered electors | 7,349 | ||||
Labour win (new seat) | |||||
Alliance win (new seat) | |||||
Labour win (new seat) |
Party | Candidate | Votes | % | ±% | |
---|---|---|---|---|---|
Labour | Hugh Pound* | 721 | 39.2 | ||
Labour | Victoria Jones | 692 | 37.6 | ||
Conservative | Christian Atwood | 681 | 37.1 | ||
Conservative | Lynne Weatherly | 671 | 36.5 | ||
Labour | Shadi Rogers* | 661 | 36.0 | ||
Conservative | Richard Harrington | 647 | 35.2 | ||
Green | Sue Lovell | 225 | 12.2 | ||
Liberal Democrats | William Healing | 213 | 11.6 | ||
Independent | Joe Dore | 200 | 10.9 | ||
Liberal Democrats | Marguerita Morton* | 188 | 10.2 | ||
Liberal Democrats | Yvonne Raptis | 175 | 9.5 | ||
Turnout | 1,844 | 29.1 | |||
Registered electors | 6,345 | ||||
Labour hold | |||||
Labour hold | |||||
Conservative hold | |||||
Party | Candidate | Votes | % | ±% | |
---|---|---|---|---|---|
Liberal Democrats | Mark Ellis* | 1,059 | 35.6 | ||
Liberal Democrats | Brandon Le Page* | 1,037 | 34.8 | ||
Liberal Democrats | Joe Opara* | 917 | 30.8 | ||
Labour | Penny Breedon | 800 | 26.9 | ||
Conservative | Sarah Bridges | 795 | 26.7 | ||
Conservative | Peter Oakford | 792 | 26.6 | ||
Conservative | Alexander Puffette | 717 | 24.1 | ||
Labour | John Francis* | 708 | 23.8 | ||
Labour | Alain Lewis* | 683 | 23.0 | ||
Alliance | Jonathan Farina | 347 | 11.7 | ||
Green | Mark McBennett | 275 | 9.2 | ||
Independent | Len Colangelo | 213 | 7.2 | ||
Turnout | 2,986 | 40.7 | |||
Registered electors | 7,330 | ||||
Liberal Democrats win (new seat) | |||||
Liberal Democrats win (new seat) |
Party | Candidate | Votes | % | ±% | |
---|---|---|---|---|---|
Liberal Democrats | Ben Chapelard* | 1,427 | 66.1 | ||
Liberal Democrats | Rob Wormington* | 1,024 | 47.4 | ||
Liberal Democrats | Courtney Souper | 957 | 44.3 | ||
Green | Maria Gavin | 423 | 19.6 | ||
Labour | Darren Moore | 408 | 18.9 | ||
Alliance | Kit Hawes-Webb | 370 | 17.1 | ||
Labour | Chris Stevenson | 357 | 16.5 | ||
Conservative | Misha Mitchem | 255 | 11.8 | ||
Conservative | Christopher Woodward | 246 | 11.4 | ||
Conservative | Jamie Tucker | 243 | 11.3 | ||
Independent | Colin Nicholson | 128 | 5.9 | ||
Independent | Liberty Richardson | 117 | 5.4 | ||
Turnout | 2,168 | 35.8 | |||
Registered electors | 6,050 | ||||
Liberal Democrats hold | |||||
Liberal Democrats win (new seat) |
Party | Candidate | Votes | % | ±% | |
---|---|---|---|---|---|
Liberal Democrats | Peter Lidstone* | 855 | 50.4 | ||
Liberal Democrats | Matt Fox | 810 | 47.7 | ||
Labour | Dariel Francis | 446 | 26.3 | ||
Labour | Maura Faulkner | 419 | 24.7 | ||
Conservative | Alexander Lewis-Gray | 221 | 13.0 | ||
Conservative | Rebecca Winter | 194 | 11.4 | ||
Green | Adrian Thorne | 124 | 7.3 | ||
Independent | Fran Colangelo | 99 | 5.8 | ||
Independent | Mark Nicholson | 53 | 3.1 | ||
Turnout | 1,700 | 40.4 | |||
Registered electors | 4,209 | ||||
Liberal Democrats hold | |||||
The Borough of Tunbridge Wells is a local government district with borough status in Kent, England. It takes its name from its main town, Royal Tunbridge Wells. The borough also contains the towns of Paddock Wood and Southborough, along with numerous villages and surrounding rural areas. Large parts of the borough fall within the High Weald Area of Outstanding Natural Beauty.
Stretford and Urmston is a constituency in Greater Manchester represented in the House of Commons of the UK Parliament since a 2022 by-election by Andrew Western, a Labour MP.
Tunbridge Wells is a constituency in Kent represented in the House of Commons of the UK Parliament since 2005 by Greg Clark, a Conservative who served as Secretary of State for Business, Energy and Industrial Strategy from 2016 to 2019 and then as Secretary of State for Levelling Up, Housing and Communities in 2022 as part of a caretaker government led by former Prime Minister Boris Johnson.
The East Riding of Yorkshire is a unitary authority in the ceremonial county of the East Riding of Yorkshire, England. It was created on 1 April 1996 replacing East Yorkshire, East Yorkshire Borough of Beverley, Holderness, part of Boothferry and Humberside County Council.
Brighton and Hove City Council is a unitary authority in East Sussex, England. It was created as Brighton and Hove Borough Council on 1 April 1997 replacing Brighton and Hove Borough Councils. It was granted city status in 2001.
Corby Borough Council was elected every four years. The council was abolished in 2021, with the area becoming part of North Northamptonshire.
One third of Tunbridge Wells Borough Council in Kent, England, is elected each year, followed by one year without election. Since the last boundary changes in 2002, 48 councillors have been elected from 20 wards.
The 2012 Tunbridge Wells Borough Council election was scheduled to take place on Thursday 3 May 2012 to elect members of Tunbridge Wells Borough Council in Kent, England. One third of the council was up for election.
Hampstead Town is a ward in the London Borough of Camden, in the United Kingdom. It covers most of Hampstead Village, the western half of Hampstead Heath, North End and the Vale of Health. The more residential Frognal ward covers much of the rest of Hampstead.
The 2014 Newham London Borough Council election took place on 22 May 2014 to elect members of Newham London Borough Council in England. This was on the same day as other local elections.
A by-thirds Hyndburn Borough Council local election, was held on Thursday 6 May 2021. Approximately one third of the local council's 35 seats fall up for election on that day.
The 2021 Tameside Metropolitan Borough Council election took place on 6 May 2021 to elect members of Tameside Metropolitan Borough Council in England. This was on the same day as other local elections. One-third of the seats were up for election.
The 2022 Bromley London Borough Council election took place on 5 May 2022. All 58 members of Bromley London Borough Council were elected. The elections took place alongside local elections in the other London boroughs and elections to local authorities across the United Kingdom.
The 2022 Camden London Borough Council election took place on 5 May 2022. All 55 members of Camden London Borough Council were elected. The elections took place alongside local elections in the other London boroughs and elections to local authorities across the United Kingdom.
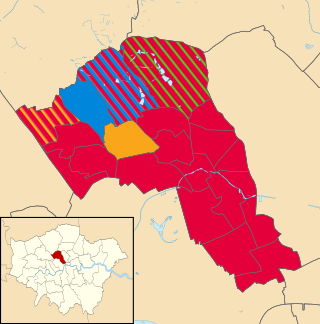
The 2022 Watford Borough Council election took place on 5 May 2022. One third (12) of the 36 members of Watford Borough Council were elected. The elections took place alongside elections to local authorities across the United Kingdom, and an election for the Mayor of Watford.
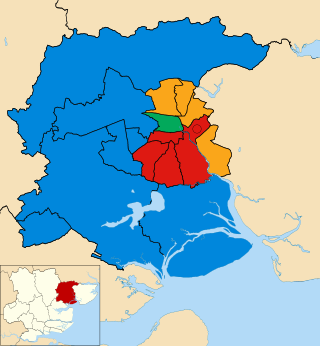
The 2024 Colchester City Council election took place on 2 May 2024 alongside other local elections across England. Eighteen members of the council were elected, one from each of the wards, with an additonal by-election in Greenstead ward.
The 2023 Broxtowe Borough Council election took place on 4 May 2023, to elect all 44 members of Broxtowe Borough Council in England. This took place as part of the 2023 United Kingdom local elections.
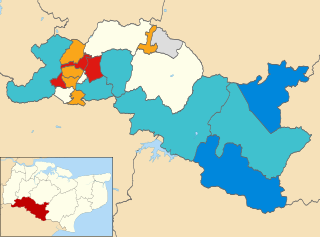
The 2023 Tunbridge Wells Borough Council election took place on 4 May 2023 to elect members of Tunbridge Wells Borough Council in Kent, England. This was on the same day as other local elections across England.
The 2024 Reading Borough Council election will take place on 2 May 2024 to elect members of Reading Borough Council in Berkshire, England. This will be on the same day as other local elections.
The 2024 Crawley Borough Council election will take place on 2 May 2024 to elect members of Crawley Borough Council in West Sussex, England. This will be on the same day as other local elections.