Results maps
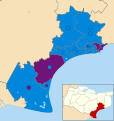 2015 results map
 2019 results map
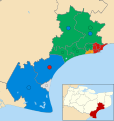 2023 results map
Folkestone and Hythe District Council is the local authority for the Folkestone and Hythe District in Kent, England. The district was called Shepway prior to 2018. The council is elected every four years. Since the last boundary changes in 2015, 30 councillors have been elected from 13 wards. [1]


| Party | Candidate | Votes | % | ±% | |
|---|---|---|---|---|---|
| Labour | 593 | 47.9 | |||
| Conservative | 429 | 34.7 | |||
| Liberal Democrats | 215 | 17.4 | |||
| Majority | 164 | 13.2 | |||
| Turnout | 1,237 | 54.8 | |||
| Labour hold | Swing | ||||
| Party | Candidate | Votes | % | ±% | |
|---|---|---|---|---|---|
| Labour | 278 | 42.2 | +12.2 | ||
| Conservative | 222 | 33.7 | +5.1 | ||
| Liberal Democrats | 158 | 24.0 | -17.1 | ||
| Majority | 56 | 8.5 | |||
| Turnout | 658 | 20.8 | |||
| Labour gain from Liberal Democrats | Swing | ||||
| Party | Candidate | Votes | % | ±% | |
|---|---|---|---|---|---|
| Liberal Democrats | 387 | 43.0 | +8.2 | ||
| Labour | 273 | 30.4 | -14.3 | ||
| Conservative | 239 | 26.6 | +6.1 | ||
| Majority | 114 | 12.6 | |||
| Turnout | 899 | 26.5 | |||
| Liberal Democrats gain from Labour | Swing | ||||
| Party | Candidate | Votes | % | ±% | |
|---|---|---|---|---|---|
| Conservative | 480 | 51.9 | -12.6 | ||
| Liberal Democrats | 369 | 39.9 | +17.0 | ||
| Labour | 75 | 8.1 | -4.5 | ||
| Majority | 111 | 12.0 | |||
| Turnout | 924 | 38.6 | |||
| Conservative hold | Swing | ||||
| Party | Candidate | Votes | % | ±% | |
|---|---|---|---|---|---|
| Liberal Democrats | Gary George | 424 | 36.3 | +0.5 | |
| Conservative | Dick Pascoe | 407 | 34.8 | +4.0 | |
| Labour | 339 | 29.0 | -4.5 | ||
| Majority | 17 | 1.5 | |||
| Turnout | 1,170 | 32.7 | |||
| Liberal Democrats gain from Labour | Swing | ||||
| Party | Candidate | Votes | % | ±% | |
|---|---|---|---|---|---|
| Liberal Democrats | Peter Smith | 598 | 57.0 | +57.0 | |
| Conservative | 451 | 43.0 | -27.8 | ||
| Majority | 147 | 14.0 | |||
| Turnout | 1,049 | 34.7 | |||
| Liberal Democrats gain from Conservative | Swing | ||||
| Party | Candidate | Votes | % | ±% | |
|---|---|---|---|---|---|
| Conservative | Hugh Barker | 358 | 61.5 | +25.7 | |
| Labour | 224 | 38.5 | +0.7 | ||
| Majority | 134 | 23.0 | |||
| Turnout | 582 | 19.6 | |||
| Conservative hold | Swing | ||||
| Party | Candidate | Votes | % | ±% | |
|---|---|---|---|---|---|
| Liberal Democrats | 1,003 | 58.3 | +14.8 | ||
| Conservative | Edwina Boyt | 653 | 37.9 | -5.6 | |
| Labour | 65 | 3.8 | -9.3 | ||
| Majority | 350 | 20.4 | |||
| Turnout | 1,721 | 36.1 | |||
| Liberal Democrats hold | Swing | ||||
| Party | Candidate | Votes | % | ±% | |
|---|---|---|---|---|---|
| Liberal Democrats | Julie White | 401 | 37.4 | +17.4 | |
| Conservative | 365 | 34.0 | -1.6 | ||
| Labour | 262 | 24.4 | +0.0 | ||
| UKIP | 44 | 4.1 | +4.1 | ||
| Majority | 36 | 3.4 | |||
| Turnout | 1,072 | 46.5 | |||
| Liberal Democrats gain from Labour | Swing | ||||
| Party | Candidate | Votes | % | ±% | |
|---|---|---|---|---|---|
| Liberal Democrats | Ann Birchmore | 550 | 48.1 | +15.4 | |
| Conservative | Derek Morgan | 502 | 43.9 | -9.5 | |
| Labour | Albert Ryder | 91 | 8.0 | -5.9 | |
| Majority | 48 | 4.2 | |||
| Turnout | 1,143 | 41.8 | |||
| Liberal Democrats gain from Conservative | Swing | ||||
| Party | Candidate | Votes | % | ±% | |
|---|---|---|---|---|---|
| Conservative | Simon Ashworth | 349 | 50.6 | -5.6 | |
| Liberal Democrats | Sylvia Oiller | 273 | 39.6 | +15.3 | |
| Labour | Adrian Cirket | 68 | 9.9 | -9.6 | |
| Majority | 76 | 11.0 | |||
| Turnout | 690 | 40.7 | |||
| Conservative hold | Swing | ||||
| Party | Candidate | Votes | % | ±% | |
|---|---|---|---|---|---|
| Conservative | 575 | 52.5 | +33.9 | ||
| Liberal Democrats | 352 | 32.1 | -30.9 | ||
| Labour | 169 | 15.4 | -3.0 | ||
| Majority | 223 | 20.4 | |||
| Turnout | 1,096 | 37.0 | |||
| Conservative gain from Liberal Democrats | Swing | ||||
| Party | Candidate | Votes | % | ±% | |
|---|---|---|---|---|---|
| Conservative | David Stephenson | 560 | 66.2 | +19.0 | |
| Labour | 175 | 20.7 | -18.1 | ||
| Liberal Democrats | 111 | 13.1 | -0.8 | ||
| Majority | 385 | 45.5 | |||
| Turnout | 846 | 33.5 | |||
| Conservative gain from Labour | Swing | ||||
| Party | Candidate | Votes | % | ±% | |
|---|---|---|---|---|---|
| Conservative | Philip Martin | 409 | 53.4 | +16.7 | |
| Labour | 237 | 30.9 | +8.5 | ||
| Liberal Democrats | 120 | 15.7 | -21.8 | ||
| Majority | 172 | 22.5 | |||
| Turnout | 766 | 23.7 | |||
| Conservative gain from Green | Swing | ||||
| Party | Candidate | Votes | % | ±% | |
|---|---|---|---|---|---|
| Liberal Democrats | Neil Matthews | 589 | 39.6 | +22.1 | |
| Conservative | Paul Peacock | 483 | 32.5 | -26.4 | |
| UKIP | Barbara Johnson | 255 | 17.2 | +5.9 | |
| BNP | Harry Williams | 94 | 6.3 | +6.3 | |
| Shepway Independents | Colin Tearle | 65 | 4.4 | +4.4 | |
| Majority | 106 | 7.1 | |||
| Turnout | 1,486 | 46.1 | |||
| Liberal Democrats gain from Conservative | Swing | ||||
| Party | Candidate | Votes | % | ±% | |
|---|---|---|---|---|---|
| Conservative | Toby Clifton-Holt | 430 | 58.7 | -10.3 | |
| Shepway Independents | Graham Snell | 121 | 16.5 | +16.5 | |
| Liberal Democrats | Sally Matthews | 114 | 15.6 | -0.9 | |
| Labour | Douglas Suckling | 68 | 9.3 | -5.3 | |
| Majority | 309 | 42.2 | |||
| Turnout | 733 | 41.0 | |||
| Conservative hold | Swing | ||||
| Party | Candidate | Votes | % | ±% | |
|---|---|---|---|---|---|
| Conservative | Shane Lawrence | 452 | 51.4 | +2.2 | |
| Liberal Democrats | Brian Wright | 333 | 37.9 | -12.9 | |
| UKIP | Wendy Nevard | 94 | 10.7 | +10.7 | |
| Majority | 119 | 13.5 | |||
| Turnout | 879 | 30.7 | |||
| Conservative hold | Swing | ||||
| Party | Candidate | Votes | % | ±% | |
|---|---|---|---|---|---|
| Conservative | Tony Hills | 591 | 49.3 | -0.8 | |
| Labour | Donald Russell | 247 | 20.6 | +20.6 | |
| Liberal Democrats | Ted Last | 184 | 15.3 | -7.7 | |
| Independent | Rochelle Saunders | 177 | 14.8 | +14.8 | |
| Majority | 344 | 28.7 | |||
| Turnout | 1,199 | ||||
| Conservative hold | Swing | ||||
| Party | Candidate | Votes | % | ±% | |
|---|---|---|---|---|---|
| Liberal Democrats | Lynne Beaumont | 461 | 36.2 | +12.2 | |
| Conservative | Leo Griggs | 320 | 25.1 | -15.7 | |
| People First Party | Patricia Copping | 200 | 15.7 | +1.5 | |
| UKIP | Hod Birkby | 153 | 12.0 | +2.8 | |
| Labour | Nicola Keen | 111 | 8.7 | +8.7 | |
| Green | Derek Moran | 29 | 2.3 | +2.3 | |
| Majority | 141 | 11.1 | |||
| Turnout | 1,274 | ||||
| Liberal Democrats gain from Conservative | Swing | ||||
| Party | Candidate | Votes | % | ±% | |
|---|---|---|---|---|---|
| UKIP | David Callahan | 287 | 27.9 | +27.9 | |
| Conservative | Rodica Wheeler | 224 | 21.7 | -17.4 | |
| Liberal Democrats | Tom McNeice | 198 | 19.2 | +2.3 | |
| Labour | Wendy Mitchell | 196 | 19.0 | -9.1 | |
| Green | David Horton | 96 | 9.3 | +9.3 | |
| TUSC | Seth Cruse | 29 | 2.8 | +2.8 | |
| Majority | 63 | 6.1 | |||
| Turnout | 1,030 | ||||
| UKIP gain from Conservative | Swing | ||||
| Party | Candidate | Votes | % | ±% | |
|---|---|---|---|---|---|
| Conservative | Helen Barker | 385 | 36.4 | -18.8 | |
| UKIP | Stephen Jardine | 293 | 27.7 | +27.7 | |
| Liberal Democrats | Hugh Robertson-Ritchie | 262 | 24.8 | +3.4 | |
| Green | Jasmine Heywood | 61 | 5.8 | +5.8 | |
| Labour | Nicola Keen | 57 | 5.4 | -18.0 | |
| Majority | 92 | 8.7 | |||
| Turnout | 1,058 | ||||
| Conservative hold | Swing | ||||
| Party | Candidate | Votes | % | ±% | |
|---|---|---|---|---|---|
| Conservative | Russell Tillson | 566 | 35.4 | +6.4 | |
| Labour | John Cramp | 523 | 32.7 | +21.7 | |
| Independent | David Wimble | 431 | 27.0 | +27.0 | |
| Liberal Democrats | Val Loseby | 77 | 4.8 | -3.7 | |
| Majority | 43 | 2.7 | |||
| Turnout | 1,597 | ||||
| Conservative hold | Swing | ||||
| Party | Candidate | Votes | % | ±% | |
|---|---|---|---|---|---|
| Conservative | Tony Hills | 375 | 24.2 | -7.4 | |
| Green | Malcolm Watkinson | 332 | 21.4 | +3.9 | |
| Labour | Chrissie Cooper | 295 | 19.0 | -4.5 | |
| Reform UK | Kim Wye | 237 | 15.3 | +15.3 | |
| Independent | Paul Peacock | 155 | 10.0 | +10.0 | |
| Independent | Dave Evans | 62 | 4.0 | +4.0 | |
| Independent | Ian Meyers | 51 | 3.3 | -18.8 | |
| No description | Dougie Young | 31 | 2.0 | -0.9 | |
| Liberal Democrats | Matt Horrox | 11 | 0.7 | -7.2 | |
| Majority | 43 | 2.8 | |||
| Turnout | 1,555 | 26.5 | -7.9 | ||
| Conservative hold | Swing | ||||
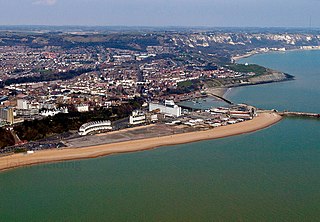
Folkestone and Hythe is a local government district in Kent, England. It lies in the south-east of the county, on the coast of the English Channel. The district was formed in 1974 and was originally named Shepway after one of the ancient lathes of Kent, which had covered a similar area. The district was renamed in 2018. The council is based in Folkestone, the district's largest town. The district also includes the towns of Hawkinge, Hythe, Lydd and New Romney, along with numerous villages and surrounding rural areas.

Folkestone and Hythe is a constituency in Kent represented in the House of Commons of the UK Parliament since 2010 by Damian Collins, a Conservative.
Elections to the Vale of White Horse District Council, the local authority for the Vale of White Horse in Oxfordshire, England take place every four years.
Forest Heath District Council in Suffolk, England was elected every four years. between the last boundary changes in 2003 and the final elections in 2015, 27 councillors were elected from 14 wards. The council was abolished in 2019, with the area becoming part of West Suffolk.
Lichfield District Council elections are held every four years. Lichfield District Council is the local authority for the non-metropolitan district of Lichfield in Staffordshire, England. Since the last boundary changes in 2015, 47 councillors have been elected from 22 wards.
Cotswold District Council in Gloucestershire, England, is elected every four years.
Blaby District Council elections are held every four years. Blaby District Council is the local authority for the non-metropolitan district of Blaby in Leicestershire, England. Since the last boundary changes in 2023 the council has comprised 36 councillors representing 17 wards, with each ward electing one, two or three councillors.
Canterbury City Council is the local authority for the City of Canterbury. The council is elected every four years.
One third of Cherwell District Council in Oxfordshire, England is elected each year, followed by one year without election. Since the last comprehensive boundary changes in 2016, 48 councillors have been elected from 16 wards.
Warwick District Council elections are held every four years. Warwick District Council is the local authority for the non-metropolitan district of Warwick in Warwickshire, England. Since the last boundary changes in 2019, 44 councillors have been elected from 17 wards.

West Lancashire Borough Council elections are generally held three years out of every four, with a third of the council elected each time. West Lancashire Borough Council is the local authority for the non-metropolitan district of West Lancashire in Lancashire, England. Since the last boundary changes in 2023 the council has comprised 45 councillors representing 15 wards, with each ward electing three councillors.
South Oxfordshire District Council, a non-metropolitan district council in Oxfordshire, England is elected every four years.
North East Derbyshire District Council elections are held every four years. North East Derbyshire District Council is the local authority for the non-metropolitan district of North East Derbyshire in Derbyshire, England. Since the last boundary changes in 2019, 53 councillors have been elected from 24 wards.
New Forest District Council elections are held every four years to elect members of New Forest District Council in Hampshire, England. Since the last boundary changes in 2023 the council has comprised 48 councillors representing 26 wards, with each ward electing one, two or three councillors.
West Devon Borough Council in Devon, England is elected every four years. Since the last boundary changes in 2015, 31 councillors have been elected from 18 wards.
One-third of Runnymede Borough Council in Surrey, England, is elected each year, followed by one year where there is an election to Surrey County Council instead. The council is divided up into 14 wards, electing 41 councillors, since the last boundary changes in 2019.
Elections to Maidstone Borough Council in Kent, United Kingdom are held each year to elect one-third of its members, followed by one year without election. Since the last boundary changes in 2002, 55 councillors have been elected from 26 wards. From 2023 onwards, the format of elections will change, with all 55 councillors being elected once every 4 years.
Rushcliffe Borough Council elections are held every four years. Rushcliffe Borough Council is the local authority for the non-metropolitan district of Rushcliffe in Nottinghamshire, England. Since the last boundary changes in 2023 the council has comprised 44 councillors representing 24 wards, with each ward electing one, two or three councillors.
Ribble Valley Borough Council elections are held every four years. Ribble Valley Borough Council is the local authority for the non-metropolitan district of Ribble Valley in Lancashire, England. Since the last boundary changes in 2019, 40 councillors have been elected from 26 wards.