| ||||||||||||||||||||||||||||||||||||||||||||||||||||||
14 out of 42 seats to Portsmouth City Council 22 seats needed for a majority | ||||||||||||||||||||||||||||||||||||||||||||||||||||||
---|---|---|---|---|---|---|---|---|---|---|---|---|---|---|---|---|---|---|---|---|---|---|---|---|---|---|---|---|---|---|---|---|---|---|---|---|---|---|---|---|---|---|---|---|---|---|---|---|---|---|---|---|---|---|
| ||||||||||||||||||||||||||||||||||||||||||||||||||||||
|
The 2024 Portsmouth City Council election took place on Thursday 2 May 2024, alongside the other local elections in the United Kingdom on the same day. 14 of the 42 members of Portsmouth City Council in Hampshire were elected.
The council remained in No overall control, being led by a Liberal Democrats minority administration. [1]
Portsmouth was created as a unitary authority in 1997. Labour controlled the council from its creation until 2000, when the council fell into no overall control. [2] The Liberal Democrats first won the council in 2010, and held a majority until 2014. [3] The Conservatives ran the council as a minority administration, with support from UKIP, [4] until 2018, when the Liberal Democrats formed a minority administration which has governed Portsmouth since. [5] In the previous election, the Liberal Democrats won 7 seats (up 1) with 29.3% of the vote, Labour won 2 with 27.5%, the Conservatives won 1 (down 5) with 19.6%, the Portsmouth Independent Party won 3 (up 3) with 16.2%, and independents won 1 (up 1) with 2.1%.
The seats up for election in 2024 were last contested in 2021; because of the delay of all local elections due to the COVID-19 pandemic, the seats are up for election after 3 years rather than the usual 4. In that election, the Conservatives gained 1 seat with 36.0% of the vote, the Liberal Democrats lost 2 with 26.6%, Labour held their 2 seats up for election with 28.0%, and independents gained 1 with 3.7%.
After 2023 election | Before 2024 election [6] | After 2024 election | ||||||
---|---|---|---|---|---|---|---|---|
Party | Seats | Party | Seats | Party | Seats | |||
Liberal Democrats | 18 | Liberal Democrats | 18 | Liberal Democrats | 19 | |||
Conservative | 8 | Conservative | 8 | Conservative | 4 | |||
Labour | 7 | Labour | 8 | Labour | 8 | |||
Portsmouth Ind. | 6 | Portsmouth Ind. | 6 | Portsmouth Ind. | 9 | |||
Independent | 3 | Independent | 2 | Independent | 2 |
Changes:
2024 Portsmouth City Council election | ||||||||||
---|---|---|---|---|---|---|---|---|---|---|
Party | This election | Full council | This election | |||||||
Seats | Net | Seats % | Other | Total | Total % | Votes | Votes % | +/− | ||
Liberal Democrats | 7 | 1 | 50.0 | 12 | 19 | 45.2 | 12,492 | 30.0 | 0.7 | |
Portsmouth Ind. | 4 | 3 | 28.6 | 5 | 9 | 21.4 | 9,578 | 23.0 | 6.8 | |
Labour | 2 | 14.3 | 6 | 8 | 19.0 | 11,556 | 27.7 | 0.2 | ||
Conservative | 1 | 4 | 7.1 | 3 | 4 | 9.5 | 6,745 | 16.2 | 3.4 | |
Independent | 0 | 0 | 2 | 2 | 4.8 | 0 | 0.0 | 2.1 | ||
Green | 0 | 0.0 | 0 | 0 | 0.0 | 2,050 | 4.5 | 0.1 | ||
Reform UK | 0 | 0.0 | 0 | 0 | 0.0 | 423 | 1.0 | 0.4 | ||
TUSC | 0 | 0.0 | 0 | 0 | 0.0 | 197 | 0.5 | 0.4 | ||
The results for each ward were: [8]
Incumbents are marked with an asterisk:*
Party | Candidate | Votes | % | ±% | |
---|---|---|---|---|---|
Liberal Democrats | Darren Sanders* | 1,595 | 50.4 | +8.2 | |
Conservative | Joseph Standen | 539 | 17.0 | -1.1 | |
Labour | Mark Andrew Farwell | 503 | 15.9 | +1.9 | |
Portsmouth Ind. | Brannen Sime | 310 | 9.8 | -11.4 | |
Green | Bob Simmonds | 173 | 5.5 | +1.2 | |
TUSC | Rachel Rebecca Nolan | 42 | 1.3 | N/A | |
Majority | 1056 | 33.4 | |||
Turnout | 3162 | 28.4 | |||
Liberal Democrats hold | Swing | ||||
Party | Candidate | Votes | % | ±% | |
---|---|---|---|---|---|
Labour | Charlotte Rachel Gerada* | 1,780 | 48.7 | +8.4 | |
Liberal Democrats | Felix Totolici | 1298 | 35.5 | -11.7 | |
Conservative | Alison Hoare | 237 | 6.5 | +0.9 | |
Green | Dillon Alexander Jarman | 208 | 5.7 | +1.1 | |
Portsmouth Ind. | Paris-Jade Wilson | 130 | 3.6 | +1.4 | |
Majority | 482 | 13.2 | |||
Turnout | 3653 | 29.7 | |||
Labour hold | Swing | ||||
Party | Candidate | Votes | % | ±% | |
---|---|---|---|---|---|
Labour | Raj Ghosh | 907 | 45.0 | +12.9 | |
Liberal Democrats | Renu Raj | 368 | 18.3 | +4.4 | |
Conservative | Thomas Gosling | 319 | 15.8 | +3.4 | |
Portsmouth Ind. | Jaime Angela Custerson | 240 | 11.9 | N/A | |
Green | Miles Plested | 109 | 5.4 | +1.1 | |
TUSC | Chris Pickett | 72 | 3.6 | N/A | |
Majority | 539 | 26.7 | |||
Turnout | 2015 | 14.8 | |||
Labour hold | Swing | ||||
Party | Candidate | Votes | % | ±% | |
---|---|---|---|---|---|
Portsmouth Ind. | Lee Matthew Tindal | 1,111 | 39.5 | -6.5 | |
Conservative | Lewis Mark David Gosling* | 740 | 26.3 | +2.3 | |
Labour | Andy Butterworth | 640 | 22.7 | +3.0 | |
Liberal Democrats | James Howitt | 190 | 6.7 | 0.0 | |
Green | Tim Sheerman-Chase | 135 | 4.8 | +1.1 | |
Majority | 371 | 13.2 | |||
Turnout | 2816 | 29.0 | |||
Portsmouth Ind. gain from Conservative | Swing | ||||
Party | Candidate | Votes | % | ±% | |
---|---|---|---|---|---|
Portsmouth Ind. | Derek James North | 1,149 | 37.8 | +30.7 | |
Labour | Amanda Martin | 1009 | 33.2 | -13.2 | |
Conservative | Matthew Atkins* | 641 | 21.1 | -15.6 | |
Liberal Democrats | Julie Ann Spurgeon | 118 | 3.9 | -2.9 | |
Green | Josie McNally | 100 | 3.3 | N/A | |
TUSC | Nikki Doyle | 20 | 0.7 | N/A | |
Majority | 140 | 4.6 | |||
Turnout | 3037 | 30.1 | |||
Portsmouth Ind. gain from Conservative | Swing | ||||
Party | Candidate | Votes | % | ±% | |
---|---|---|---|---|---|
Conservative | Spencer Roy Gardner | 1,389 | 37.8 | -9.9 | |
Portsmouth Ind. | Benjamin Simon Portet | 1267 | 34.5 | +26.4 | |
Labour | Ian Martin Ayres | 695 | 18.9 | -1.1 | |
Liberal Democrats | Claire Udy | 193 | 5.3 | -12.6 | |
Green | Paul Bleachy | 130 | 3.5 | -3.0 | |
Majority | 122 | 3.3 | |||
Turnout | 3674 | 35.1 | |||
Conservative hold | Swing | ||||
Party | Candidate | Votes | % | ±% | |
---|---|---|---|---|---|
Liberal Democrats | Nicholas Leigh Dorrington | 1,156 | 31.1 | -5.3 | |
Labour | Edward Batterbury | 1017 | 27.4 | -1.2 | |
Portsmouth Ind. | Jack Smith | 725 | 19.5 | +17.1 | |
Conservative | Terry Henderson | 604 | 16.3 | -6.9 | |
Green | Tamara Liloutee Barbara Groen | 214 | 5.8 | +0.3 | |
Majority | 139 | 3.7 | |||
Turnout | 3716 | 37.8 | |||
Liberal Democrats gain from Conservative | Swing | ||||
Party | Candidate | Votes | % | ±% | |
---|---|---|---|---|---|
Liberal Democrats | Stuart William Brown* | 824 | 31.7 | -6.4 | |
Portsmouth Ind. | Jacob Lee Short | 729 | 27.9 | +11.3 | |
Labour | Steph Richards | 728 | 27.9 | -2.5 | |
Conservative | Tim Edwards | 208 | 8.0 | -1.0 | |
Green | Samet Menguc Chering-Alves | 111 | 4.3 | -0.7 | |
Majority | 95 | 3.8 | |||
Turnout | 2600 | 24.6 | |||
Liberal Democrats hold | Swing | ||||
Party | Candidate | Votes | % | ±% | |
---|---|---|---|---|---|
Portsmouth Ind. | Matthew William Stringer Cordy | 1,493 | 54.7 | -2.6 | |
Conservative | Charles Douglas | 533 | 19.5 | -3.0 | |
Labour | Nicky Potts | 461 | 16.9 | +4.2 | |
Liberal Democrats | Peter John Williams | 148 | 5.4 | +0.9 | |
Green | Emma Louise Kimberley Murphy | 95 | 3.5 | +0.5 | |
Majority | 960 | 35.2 | |||
Turnout | 2730 | 27.0 | |||
Portsmouth Ind. gain from Conservative | Swing | ||||
Party | Candidate | Votes | % | ±% | |
---|---|---|---|---|---|
Liberal Democrats | Kimberly Emma Barrett* | 1,817 | 53.0 | +6.4 | |
Labour | Arif Hasan Choudhury | 949 | 27.7 | -9.0 | |
Green | Sarah Louise Shilling Gilbert | 231 | 6.7 | +2.3 | |
Conservative | Stephen Alexander Gorys | 220 | 6.4 | +0.1 | |
Reform UK | Rachel Faith Zimmer | 214 | 6.2 | +3.8 | |
Majority | 868 | 25.3 | |||
Turnout | 3431 | 32.5 | |||
Liberal Democrats hold | Swing | ||||
Party | Candidate | Votes | % | ±% | |
---|---|---|---|---|---|
Liberal Democrats | Richard James Adair | 903 | 37.1 | -10.7 | |
Portsmouth Ind. | Gary Richard Fyles | 687 | 28.2 | +20.4 | |
Labour | Robin Stanley Head | 505 | 20.7 | -2.3 | |
Conservative | Erin May Hunt | 223 | 9.2 | -5.7 | |
Green | Duncan Stuart Robinson | 99 | 4.1 | -1.5 | |
TUSC | Nick Doyle | 19 | 0.8 | -0.1 | |
Majority | 216 | 8.9 | |||
Turnout | 2436 | 23.8 | |||
Liberal Democrats hold | Swing | ||||
Party | Candidate | Votes | % | ±% | |
---|---|---|---|---|---|
Portsmouth Ind. | George David Madgwick* | 1,561 | 63.7 | +7.8 | |
Conservative | Thomas Christopher Hoare | 375 | 15.3 | -4.2 | |
Labour | Patrick Charles Keefe | 358 | 14.6 | -4.0 | |
Green | Ian David McCulloch | 84 | 3.4 | N/A | |
Liberal Democrats | James Campbell | 72 | 2.9 | -3.0 | |
Majority | 1186 | 48.4 | |||
Turnout | 2450 | 24.2 |
Party | Candidate | Votes | % | ±% | |
---|---|---|---|---|---|
Liberal Democrats | Hugh Laurence Mason* | 1,266 | 40.5 | +7.7 | |
Labour | Joshua Anthony Allen | 1,221 | 39.0 | -0.9 | |
Conservative | Lee Kewell | 282 | 9.0 | -3.4 | |
Green | Harry Bernard Mallinder | 184 | 5.9 | -0.3 | |
Portsmouth Ind. | John Malcolm Hill | 176 | 5.6 | -3.2 | |
Majority | 45 | 1.4 | |||
Turnout | 3129 | 33.6 | |||
Liberal Democrats hold | Swing | ||||
Party | Candidate | Votes | % | ±% | |
---|---|---|---|---|---|
Liberal Democrats | Ian Holder* | 1,199 | 42.1 | -4.8 | |
Labour | Julian Thomas Lewis | 783 | 27.5 | +3.6 | |
Conservative | David Michael Chandler | 435 | 15.3 | -4.7 | |
Reform UK | Mark Zimmer | 209 | 7.3 | N/A | |
Green | Elliot Lee | 177 | 6.2 | -0.3 | |
TUSC | John Burrows | 44 | 1.5 | N/A | |
Majority | 416 | 14.6 | |||
Turnout | 2847 | 25.2 | |||
Liberal Democrats hold | Swing | ||||
(Kingston upon) Hull City Council is the governing body for the unitary authority and city of Kingston upon Hull. It was created in 1972 as the successor to the Corporation of Hull, which was also known as the Hull Corporation and founded in 1440 by royal charter.
The city of Bristol, England, is a unitary authority, represented by four MPs representing seats wholly within the city boundaries. The overall trend of both local and national representation became left of centre during the latter 20th century. The city has a tradition of local activism, with environmental issues and sustainable transport being prominent issues in the city.
The 2004 Monmouthshire County Council election was held on 10 June 2004 to Monmouthshire County Council in southeast Wales, on the same day of the European Elections. The election was preceded by the 1999 elections and followed by the 2008 elections.
The 2008 Hull City Council election took place on 1 May 2008 to elect members of Hull City Council in England. One third of the council was up for election and the Liberal Democrats retained control of the council with an increased majority from a situation of ruling under no overall control.
The 2007 Hull City Council election took place on 3 May 2007 to elect members of Hull City Council in England. One third of the council was up for election and the Liberal Democrats gained overall control of the council from no overall control. Overall turnout was 27%.
The 2008 Wyre Forest District Council election took place on 1 May 2008 to elect members of Wyre Forest District Council in Worcestershire, England. One third of the council was up for election and the Conservative Party gained overall control of the council from no overall control.
The 2007 Winchester Council election took place on 3 May 2007 to elect members of Winchester District Council in Hampshire, England. One third of the council was up for election and the Conservative Party stayed in overall control of the council.
The 2008 Southampton Council election took place on 1 May 2008 to elect members of Southampton Unitary Council in Hampshire, England. One third of the council was up for election and the Conservative Party gained overall control of the council from no overall control.
The 2007 Carlisle City Council election took place on 3 May 2007 to elect members of Carlisle District Council in Cumbria, England. One third of the council was up for election and the council stayed under no overall control.
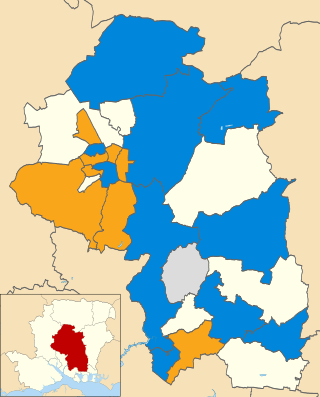
The 2011 St Albans City and District Council election took place on 5 May 2011 to elect members of St Albans District Council in Hertfordshire, England. One third of the council was up for election and the Liberal Democrats lost overall control of the council to no overall control.
The 2017 Scottish local elections were held on Thursday 4 May, in all 32 local authorities. The SNP retained its position as the largest party in terms of votes and councillors, despite suffering minor losses. The Conservatives made gains and displaced Labour as the second largest party, while the Liberal Democrats suffered a net loss of councillors despite increasing their share of the vote. Minor parties and independents polled well; and independent councillors retained majority control over the three island councils. For the first time since the local government reforms in 1995, all mainland councils fell under no overall control.
The 2016 Portsmouth City Council election took place on 5 May 2016 to elect members of Portsmouth City Council. This took place on the same day as other local elections taking place around the UK, including the London Mayoral election, Scottish Parliament and Welsh Assembly elections.
Elections to Brighton and Hove City Council election took place on 2 May 2019, electing all 54 members of the council, alongside other local elections in England and Northern Ireland.
Elections to Portsmouth City Council took place on Thursday 2 May 2019, alongside other local elections across the country. The seats contested in this election were last contested in 2015. The Conservative Party had 8 seats they were defending, the Liberal Democrats 5 and Labour 1 seat. A by-election occurred within the vacant Cosham seat from last years election, due to the sitting Conservative standing down. No party gained a majority from this election, and therefore the council remains under no overall control.
Elections to Portsmouth City Council took place on Thursday 6 May 2021, alongside other local elections across the country.
The 2023 Bournemouth, Christchurch and Poole Council election took place on 4 May, 2023, to elect all 76 members of Bournemouth, Christchurch and Poole Council in Dorset, England.
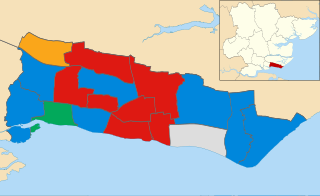
The 2023 Colchester City Council election took place on 4 May 2023 to elect members of Colchester City Council in Essex, England. This was on the same day as other local elections across England. There were 17 of the 51 seats on the council up for election, being the usual third of the council, with one seat available for each ward. This set of seats were last contested at the 2019 election.
The 2024 Southend-on-Sea City Council election was held on Thursday 2 May 2024, alongside the other local elections in the United Kingdom being held on the same day. One-third of the 51 members of Southend-on-Sea City Council in Essex were elected.
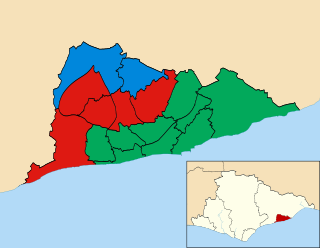
The 2024 Hastings Borough Council election was held on Thursday 2 May 2024, alongside the other local elections in the United Kingdom being held on the same day. One-half of the 32 members of Hastings Borough Council in East Sussex were elected. The election saw the Green Party make significant gains in their number of seats, becoming the largest party on the council. The Conservatives performed poorly, losing a third of their 2023 share of the vote and half their seats. Reform UK also lost their only seat, which they had gained in May 2023 following a Conservative Councillor switching parties. Due to the results, the previously minority coalition of the Green Party and the subset of the independent councillors known as the 'Hastings Independent Group' now have majority control of the council, albeit only just.
The 2024 Burnley Borough Council election was held on Thursday 2 May 2024, alongside the other local elections in the United Kingdom on the same day. One-third of the 45 members of Burnley Borough Council in Lancashire were elected.