2015 Norwich City Council election

Last updated

2015 Norwich City Council election
  2014 7 May 2015 2016  

15 of 39 seats to Norwich City Council
20 seats needed for a majority
 First partySecond partyThird party
  No image wide.svg No image wide.svg No image wide.svg
Party Labour Green Liberal Democrats
Seats before21153
Seats won1041
Seats after22143
Seat changeIncrease2.svg1Decrease2.svg1Steady2.svg
Popular vote22,75516,1066,932
Percentage34.9%24.7%10.9%
SwingDecrease2.svg1.7pp Decrease2.svg3.3pp Decrease2.svg1.6pp

Norwich wards 2015.png
Map showing the 2015 local election results in Norwich.

Council control before election

Labour Party (UK)

Council control after election

Labour Party (UK)

The 2015 Norwich City Council election took place on 7 May 2015 to elect approximately one third of the members of Norwich City Council in England. [1] This was on the same day as other local elections and the UK general election. Thirteen seats were due to be contested, with a further two seats up for election where casual vacancies had arisen. Labour won ten of the available seats, the Green Party won four, and the Liberal Democrats one. The Conservatives gained their highest ever vote in many city wards including Town Close and Thorpe Hamlet, and across Norwich came within almost 2000 votes of the Green Party, however failed to gain any seats. Just one seat changed hands - Wensum - which Labour gained from the Greens. Labour retained overall control of the council with 22 seats out of 39, the Greens continue to form the main opposition with 14 seats, and the Liberal Democrats have 3. [2]

Contents

All changes in vote share are calculated with reference to the 2011 election, the last time these seats were contested.

Overall result

Norwich City Council Election, 2015
PartySeatsGainsLossesNet gain/lossSeats %Votes %Votes+/−
  Labour 1010+166.734.922,755-1.7
  Green 401-126.724.716,302-3.3
  Conservative 0000021.313,933+0.6
  Liberal Democrats 10006.710.66,932-1.6
  UKIP 000008.15,304+5.9
  Left Unity 000000.137N/A
Total15Turnout62.065,263

Changes in vote share are relative to the last time these seats were contested in 2011.

Ward Results

Below are the ward results for Norwich's 13 wards. All the ward are elected one councillor apart from Sewell and Mile Cross ward, who both elected two councillors. Changes in vote share shown are changes from the result for these seats in the 2011 City Council election.

Bowthorpe

Bowthorpe
PartyCandidateVotes%±%
Labour Mike Sands1,95540.0-5.8
Conservative Daniel Elmer1,08722.2-12.7
UKIP Eric Masters74315.2n/a
Green Jean Bishop71014.5+1.0
Liberal Democrats Thomas Johnston3958.1+2.4
Majority86817.8
Turnout 4,89055.8
Labour hold Swing

Catton Grove

Catton Grove ward
PartyCandidateVotes%±%
Labour Paul Kendrick1,70236.5-5.0
Conservative Will Holmes1,41130.3-2.0
UKIP Michelle Ho79917.1+9.1
Green Tony Park48310.4+0.2
Liberal Democrats Leigh Tooke2695.8-1.3
Majority2916.2
Turnout 4,46456.9
Labour hold Swing

Crome

Crome ward
PartyCandidateVotes%±%
Labour Alan Walters1,82142.3-10.1
Conservative David Mackie1,13226.3+1.6
UKIP Ann Williams79318.4+10.6
Green Judith Ford3508.1-1.6
Liberal Democrats Chris Thomas1754.1-1.3
Left Unity Anthony Sweeney370.9n/a
Majority68916.0
Turnout 4,30859.0
Labour hold Swing

Eaton

Eaton ward
PartyCandidateVotes%±%
Liberal Democrats Caroline Ackroyd2,17637.1+2.9
Conservative William Robb1,59827.2-4.0
Labour Chris Elderton1,22620.9-0.9
Green Jane Saunders86914.8+2.0
Majority5789.9
Turnout 5,86677.6
Liberal Democrats hold Swing

Lakenham

Lakenham ward
PartyCandidateVotes%±%
Labour Keith Driver1,70037.8+3.8
UKIP Steve Emmens73316.3+9.6
Green Laura Middleton71816.0-2.5
Liberal Democrats David Fairbairn67415.0-6.3
Conservative Hannah Felton66914.9+3.1
Majority96721.5
Turnout 4,49462.5
Labour hold Swing

Mancroft

Mancroft ward
PartyCandidateVotes%±%
Green Martin Schmierer1,80537.0-4.5
Labour Beth Jones1,73035.4+2.0
Conservative Barry Cochrane96119.7+4.7
Liberal Democrats Melvyn Elias3867.9-2.2
Majority751.6
Turnout 4,88258.3
Green hold Swing

Mile Cross

Mile Cross ward elected two seats in this election, with each voter casting up to two votes under the plurality-at-large voting system.

Mile Cross ward
PartyCandidateVotes%±%
Labour Vaughan Thomas1,67536.6-14.4
Labour Vivien Thomas1,410
Conservative Mary Chacksfield92120.1+1.6
UKIP Steven Bradley90519.8+15.4
Green Richard Edwards80217.5+3.3
Conservative Paul Holmes653
Green Gunnar Eigener605
Liberal Democrats Sarah Cunningham2725.9-6.1
Liberal Democrats Michael Sutton-Croft204
Majority754
Majority489
Turnout 7,95553.1
Labour hold Swing
Labour hold Swing

Nelson

Nelson ward
PartyCandidateVotes%±%
Green Denise Carlo2,75050.2-4.7
Labour Hugo Malik1,68530.7+4.5
Conservative James Wight65612.0+0.7
Liberal Democrats Yan Malinowski3937.2-0.5
Majority1,06519.5
Turnout 5,48470.9
Green hold Swing

Sewell

Sewell ward elected two seats in this election, with each voter casting up to two votes under the plurality-at-large voting system.

Sewell ward
PartyCandidateVotes%±%
Labour Julie Brociek-Coulton2,01839.3-1.9
Labour Ed Coleshill1,454
Green Thomas Holloway1,05820.6-4.4
Conservative Anthony Barton1,04620.4+0.5
Conservative Evelyn Collishaw1,031
Green Matthew Townsend1,015
UKIP Glenn Tingle62812.2+6.7
Liberal Democrats Thomas Crisp3837.5-0.9
Liberal Democrats Neal Samuel205
Majority960
Majority396
Turnout 4,85261.0
Labour hold Swing
Labour hold Swing

Thorpe Hamlet

Thorpe Hamlet ward
PartyCandidateVotes%±%
Green Jo Henderson1,85133.1-7.9
Labour Eamonn Burgess1,64029.3+6.1
Conservative Jonathan Gillespie1,50726.9+5.5
Liberal Democrats Simon Nobbs60210.8-3.5
Majority2113.8
Turnout 5,60060.3
Green hold Swing

Town Close

Town Close ward
PartyCandidateVotes%±%
Green David Raby2,20535.7-10.5
Labour Jamal Sealey1,86430.2+6.2
Conservative Antony Little1,43523.2+4.8
Liberal Democrats Kirsty Webber-Walton67110.9-0.5
Majority3415.5
Turnout 6,17567.3
Green hold Swing

University

University ward
PartyCandidateVotes%±%
Labour Roger Ryan2,06848.5-8.8
Green Spinoza Pitman1,13026.5+6.8
Conservative Jessica Lancod-Frost75817.8+4.2
Liberal Democrats Peter Callf3047.1-2.3
Majority93822.0
Turnout 4,26062.9
Labour hold Swing

Wensum

Wensum ward
PartyCandidateVotes%±%
Labour Martin Peek1,67134.0-4.4
Green Ben Walker1,55531.7-12.0
Conservative Michael Lach75215.3+3.0
UKIP Dave King70314.3n/a
Liberal Democrats John Beale2324.7-0.9
Majority1162.3
Turnout 4,91356.7
Labour gain from Green Swing

Related Research Articles

<span class="mw-page-title-main">Politics of Bristol</span> Overview of the politics of Bristol

The city of Bristol, England, is a unitary authority, represented by four MPs representing seats wholly within the city boundaries. As well as these, Filton and Bradley Stoke covers the northern urban fringe in South Gloucestershire and the north eastern urban fringe is in the Kingswood constituency. The overall trend of both local and national representation became left of centre during the latter 20th century, but there was a shift to the right in the 2010 general election. The city has a tradition of local activism, with environmental issues and sustainable transport being prominent issues in the city.

<span class="mw-page-title-main">2007 St Albans City and District Council election</span>

The 2007 St Albans City and District Council election took place on 3 May 2007 to elect members of St Albans District Council in Hertfordshire, England. One third of the council was up for election and the Liberal Democrats lost overall control of the council to no overall control.

<span class="mw-page-title-main">2011 Brighton and Hove City Council election</span>

Elections to Brighton and Hove City Council were held on 5 May 2011, in line with other local elections in the United Kingdom. The whole council, a unitary authority, was up for election with 54 councillors elected from 21 wards.

<span class="mw-page-title-main">2011 South Norfolk District Council election</span>

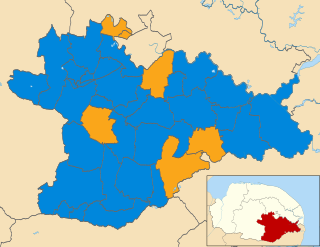
The elections to South Norfolk District Council were held on Thursday 5 May 2011 along with various other local elections around England, elections to the Scottish Parliament, National Assembly of Wales and Northern Ireland Assembly, and a referendum on whether to adopt the Alternative Vote electoral system for elections to the House of Commons. All 46 council seats were up for election. The previous council was controlled by the Conservatives, with the Liberal Democrats being the only opposition.

<span class="mw-page-title-main">2011 Norwich City Council election</span> 2011 city council election for Norwich, England

The 2011 Norwich City Council election took place on 5 May 2011 to elect members of Norwich City Council in England. One third of seats were up for election. This was on the same day as other local elections and the nationwide referendum on the Alternative Vote.

<span class="mw-page-title-main">2011 Guildford Borough Council election</span>

The 2011 council elections in Guildford saw the Conservatives retain control over Guildford Borough Council with an increased majority of 20 seats. Full results for each ward can be found at Guildford Council election, full results, 2011.

<span class="mw-page-title-main">2012 Cambridge City Council election</span>

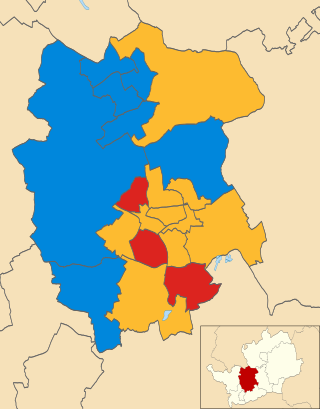
Elections for Cambridge City Council were held on Thursday 3 May 2012. One third of the council was up for election and the Liberal Democrats lost overall control of the council, to No Overall Control.

<span class="mw-page-title-main">2013 Norfolk County Council election</span>

The Norfolk County Council election took place across Norfolk on 2 May 2013, coinciding with local elections for all county councils in England. The results were announced the following day, Friday 3 May 2013. The result brought to an end 12 years of Conservative administration, who finished three seats short of a majority after losing 20 seats, leaving the Council in no overall control (NOC). UKIP and the Labour Party both made gains of 14 and 11 seats respectively. The Liberal Democrats and the Green Party both lost three seats each, whilst an independent won a single seat in North Norfolk.

<span class="mw-page-title-main">2014 St Albans City and District Council election</span>

The 2014 St Albans City and District Council election took place on 22 May 2014 to elect members of St Albans District Council in Hertfordshire, England. One third of the council was up for election and the council stayed under no overall control.

<span class="mw-page-title-main">2014 Norwich City Council election</span> 2014 city council election for Norwich, England

Council elections for the Norwich City Council were held on 22 May 2014 as part of the 2014 United Kingdom local elections. The elections were moved from earlier on in May to coincide with the East of England 2014 European Parliament election.

<span class="mw-page-title-main">2012 St Helens Metropolitan Borough Council election</span>

The 2012 St Helens Metropolitan Borough Council election took place on 3 May 2012 to elect members of St Helens Metropolitan Borough Council in Merseyside, England. One third of the council was up for election and the LabourPparty stayed in overall control of the council.

<span class="mw-page-title-main">2016 Exeter City Council election</span>

The 2016 Exeter City Council election took place on 5 May 2016, to elect members of Exeter City Council in England. Following boundary changes, the entire council was up for election, and all 13 wards were contested, each electing three councillors. The election was held concurrently with other local elections held in England on the 5 May.

<span class="mw-page-title-main">2018 Norwich City Council election</span> 2018 city council election for Norwich, England

The 2018 Norwich City Council election took on 3 May 2018 to elect members of Norwich City Council in England. This was on the same day as other local elections. 13 of 39 seats (one-third) were up for election.

<span class="mw-page-title-main">2018 Oxford City Council election</span>

The 2018 Oxford City Council election took place on 3 May 2018, to elect 24 of the 48 members of Oxford City Council in England. This was on the same day as other local elections in England. Each of Oxford's 24 wards elected one councillor, with the other seat in each ward next due for election in May 2020.

<span class="mw-page-title-main">2018 Cannock Chase District Council election</span>

Elections to Cannock Chase District Council took place on 3 May 2018 on the same day as other local elections in England. A third of the council was up for election, meaning a total of 13 councillors were elected from all but two of the council's wards.

2019 Sunderland City Council election

The 2019 Sunderland City Council election took place on 2 May 2019 to elect members of Sunderland City Council in England. The election took place on the same day as other local elections.

<span class="mw-page-title-main">2022 City of Edinburgh Council election</span> City of Edinburgh Council election

Elections to the City of Edinburgh Council took place on 5 May 2022 on the same day as the 31 other Scottish local government elections. As with other Scottish council elections, it was held using single transferable vote (STV) – a form of proportional representation – in which multiple candidates are elected in each ward and voters rank candidates in order of preference.

<span class="mw-page-title-main">2022 Aberdeenshire Council election</span> Aberdeenshire Council election

Elections to Aberdeenshire Council took place on Thursday 5 May 2022 on the same day as the 31 other Scottish local government elections. As with other Scottish council elections, it was held using single transferable vote (STV) – a form of proportional representation – in which multiple candidates are elected in each ward and voters rank candidates in order of preference.

<span class="mw-page-title-main">2022 Aberdeen City Council election</span> Aberdeen City Council election

Elections to Aberdeen City Council took place on 5 May 2022 on the same day as the 31 other Scottish local government elections. As with other Scottish council elections, it was held using single transferable vote (STV) – a form of proportional representation – in which multiple candidates are elected in each ward and voters rank candidates in order of preference.

<span class="mw-page-title-main">2023 United Kingdom local elections</span> Elections to local councils and mayoralties

The 2023 United Kingdom local elections were held on Thursday, 4 May 2023 in England and on Thursday 18 May 2023 in Northern Ireland. These included district councils, unitary authorities, and directly elected mayors in England, and included all local councils in Northern Ireland. Notably, these elections were the first to be held under the Elections Act 2022, a new voter identification law that is controversial, meaning voters were required to show photo ID when attending a polling station.

References

  1. "Upcoming elections & referendums". The Electoral Commission. Archived from the original on 15 March 2015. Retrieved 14 April 2015.
  2. "Local election results May 2015". Norwich City Council. Archived from the original on 12 May 2015. Retrieved 11 May 2015.