Related Research Articles

Oxford West and Abingdon is a constituency represented in the House of Commons of the UK Parliament since 2017 by Layla Moran, a Liberal Democrat.

Wantage is a constituency in Oxfordshire represented in the House of Commons of the Parliament of the United Kingdom by Conservative MP David Johnston.
Oxford City Council in Oxford, England is elected every two years, with half of the 48 seats in the City Council up for election on each occasion. Elections are held in even-numbered years. Until 2002 the council was elected by thirds.
One third of Cherwell District Council in Oxfordshire, England is elected each year, followed by one year without election. Since the last comprehensive boundary changes in 2016, 48 councillors have been elected from 16 wards.

West Lancashire Borough Council elections are generally held three years out of every four, with a third of the council elected each time. West Lancashire Borough Council is the local authority for the non-metropolitan district of West Lancashire in Lancashire, England. Since the last boundary changes in 2023 the council has comprised 45 councillors representing 15 wards, with each ward electing three councillors.
South Oxfordshire District Council, a non-metropolitan district council in Oxfordshire, England is elected every four years.
East Lindsey District Council in Lincolnshire, England is elected every four years. The district is divided into 37 wards, electing 55 councillors. The last ward boundary changes came into effect in 2015.
West Lindsey District Council in Lincolnshire, England is elected every four years. Prior to 2011 one third of the council was each year, except in every fourth year when there was an election to Lincolnshire County Council instead.
East Staffordshire Borough Council elections are held every four years. East Staffordshire is a non-metropolitan district with borough status in Staffordshire, England. Since the last boundary changes in 2003, 39 councillors have been elected from 21 wards. New ward boundaries have been prepared to take effect from the 2023 elections.
Dover District Council is the local authority for the Dover District in Kent, England. The council is elected every four years.
Tonbridge and Malling Borough Council is the local authority for the borough of Tonbridge and Malling in Kent, United Kingdom. The council is elected every four years. Since the last boundary changes in 2023, 44 councillors have been elected from 19 wards.
South Cambridgeshire District Council was created as part of the 1972 local government reforms. The first elections to the new authority were held in the year 1973. From 1978 until 2016, one third of the council were elected each year, followed by one year without a poll. Since 2018, all members of the council are elected at once in a so-called 'all-out' election, after a decision made in 2015.
One-third of Runnymede Borough Council in Surrey, England, is elected each year, followed by one year where there is an election to Surrey County Council instead. The council is divided up into 14 wards, electing 41 councillors, since the last boundary changes in 2019.
Elections to Maidstone Borough Council in Kent, United Kingdom are held each year to elect one-third of its members, followed by one year without election. Since the last boundary changes in 2002, 55 councillors have been elected from 26 wards. From 2023 onwards, the format of elections will change, with all 55 councillors being elected once every 4 years.
Folkestone and Hythe District Council is the local authority for the Folkestone and Hythe District in Kent, England. The district was called Shepway prior to 2018. The council is elected every four years. Since the last boundary changes in 2015, 30 councillors have been elected from 13 wards.
Spelthorne Borough Council in Surrey, England is elected every four years. Since the last boundary changes in 2003, 39 councillors are elected from 13 wards.
Malvern Hills District Council elections are held every four years. Malvern Hills District Council is the local authority for the non-metropolitan district of Malvern Hills in Worcestershire, England. Since the last boundary changes in 2003, 38 councillors have been elected from 22 wards.
Ribble Valley Borough Council elections are held every four years. Ribble Valley Borough Council is the local authority for the non-metropolitan district of Ribble Valley in Lancashire, England. Since the last boundary changes in 2019, 39 councillors have been elected from 26 wards.
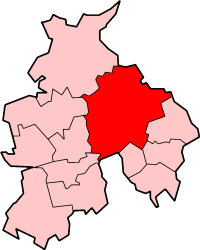
Vale of White Horse District Council is the local authority for the Vale of White Horse, a non-metropolitan district in the south-west of Oxfordshire, England, that was created on 1 April 1974.
References
- ↑ The District of Vale of White Horse (Electoral Arrangements) Order 1978
- ↑ The Oxfordshire and Wiltshire (Areas) Order 1980
- ↑ The Oxfordshire (District Boundaries) Order 1985
- ↑ legislation.gov.uk - The Oxfordshire (District Boundaries) Order 1991. Retrieved on 6 November 2015.
- ↑ "Local elections". BBC News Online . Retrieved 12 September 2009.
- ↑ legislation.gov.uk - The District of Vale of White Horse (Electoral Changes) Order 2001. Retrieved on 4 October 2015.
- ↑ legislation.gov.uk - The Vale of White Horse (Electoral Changes) Order 2014. Retrieved on 3 November 2015.
- ↑ "Tories boosted in local byelections". guardian.co.uk . 14 October 2005. Retrieved 12 September 2009.
- ↑ "Lib Dems and Labour make byelection gains". guardian.co.uk . 7 April 2006. Retrieved 12 September 2009.
- ↑ "Wantage by-election results". Vale of White Horse District Council. Retrieved 12 September 2009.
- ↑ "Abingdon Dunmore By-Election Results". Vale of White Horse District Council. 23 October 2009. Retrieved 23 October 2009.
- ↑ "Local Elections Archive Project — Sunningwell and Wootton Ward". www.andrewteale.me.uk. Retrieved 4 September 2022.
- ↑ "Local Elections Archive Project — Abingdon Peachcroft Ward". www.andrewteale.me.uk. Retrieved 4 September 2022.
- ↑ "Local Elections Archive Project — Greendown Ward". www.andrewteale.me.uk. Retrieved 4 September 2022.
- ↑ "Local Elections Archive Project — Marcham and Shippon Ward". www.andrewteale.me.uk. Retrieved 4 September 2022.
- ↑ "Local Elections Archive Project — Abingdon Fitzharris Ward". www.andrewteale.me.uk. Retrieved 4 September 2022.
- ↑ "Local Elections Archive Project — Wantage Charlton Ward". www.andrewteale.me.uk. Retrieved 4 September 2022.
- ↑ "Local Elections Archive Project — Abingdon Dunmore Ward". www.andrewteale.me.uk. Retrieved 4 September 2022.
- ↑ "Local Elections Archive Project — Grove North Ward". www.andrewteale.me.uk. Retrieved 4 September 2022.
- ↑ "Local Elections Archive Project — Steventon and the Hanneys Ward". www.andrewteale.me.uk. Retrieved 4 September 2022.
