2019 Mole Valley District Council election

Last updated

The 2019 Mole Valley District Council election took place on 2 May 2019 to elect approximately one-third of members to Mole Valley District Council in England, coinciding with other local elections held simultaneously across 248 councils in England and all 11 councils in Northern Ireland. The 2019 Mole Valley local election outcomes are outlined below in the summary results chart and the detailed results charts for each ward. The 2019 election results are compared (in terms of percentage points gained or lost) against the results when these wards were last contested four years previously, on the same day as the General Election of May 2015. The difference in the results for certain political parties is stark. This is largely influenced by an excellent result for the Conservatives on their general election winning day in May 2015, but a terrible result for the Conservatives in May 2019 when, nationally, the Government of Theresa May had failed to ‘deliver Brexit’ by the anticipated date of 29 March 2019. But even taking the national backdrops of these two very different local elections into account, it was still a spectacularly poor set of results for the Conservatives in Mole Valley in these 2019 local elections and a very good set of results for the Liberal Democrats. Some Mole Valley wards did not hold a local election in 2019, being contested instead in even-numbered years. [1]

Contents

Summary of Results

Mole Valley District Council Election, 2019
PartySeatsGainsLossesNet gain/lossSeats %Votes %Votes+/−
  Liberal Democrats 1190+978.650.49,680+21.9
  Conservative 2010-1014.324.54,697-21.8
  Green 00000.08.11,555+1.2
 Ashtead Independents110+17.16.61,277+3.0
  UKIP 00000.05.1988-6.1
  Labour 00000.03.9746+0.4
  Independent 00000.01.2234N/A
  SDP 00000.00.232N/A

Results by Ward

[2]

Ashtead Village

Ashtead Village
PartyCandidateVotes%±%
Ashtead IndependentChris Hunt1,27767.3+35.3
Liberal Democrats Rita Antonelli23612.4+7.6
Conservative Angus Fraser Gillan21911.5-40.6
Green Jacquetta Jane Fewster854.5+0.3
Labour Clive George Scott804.2-2.8
Majority1,04154.9
Turnout 40.5
Ashtead Independent gain from Conservative

Beare Green

Beare Green
PartyCandidateVotes%±%
Liberal Democrats Caroline Mary Salmon 355 51.8 +20.1
Conservative Michelle Watson22032.1-7.1
UKIP Ian Bignell689.9-12.7
Green Muriel Lily Passmore223.2-3.3
Labour Christine Mary Foster202.9N/A
Majority13519.7
Turnout 44.6
Liberal Democrats gain from Conservative Swing

Bookham North

Bookham North
PartyCandidateVotes%±%
Liberal Democrats Roger Martin Adams 1,217 67.6 +43.1
Green Richard Essex45525.3+16.3
Labour Marc Patrick Green1287.1N/A
Majority76242.3
Turnout 41.0
Liberal Democrats gain from Conservative Swing

Bookham South

Bookham South
PartyCandidateVotes%±%
Liberal Democrats Nancy Julia Goodacre 1,321 61.0 +29.8
Conservative John Frederick Chandler64829.9-21.8
Green Damian Michael McDevitt1587.3+0.1
Labour Giles Cawley401.8N/A
Majority67331.1
Turnout 49.1
Liberal Democrats gain from Conservative Swing

Box Hill & Headley

Box Hill & Headley
PartyCandidateVotes%±%
Liberal Democrats David Kennaugh Preedy 449 54.8 +14.0
Conservative Malcolm Bailey Ladell27633.7-7.4
UKIP Marion Caroline Woodville9511.6-12.8
Majority17321.1
Turnout 51.0
Liberal Democrats gain from Conservative Swing

Brockham, Betchworth and Buckland

Brockham, Betchworth and Buckland
PartyCandidateVotes%±%
Liberal Democrats Paul James Potter 787 45.8 +8.9
Conservative John Edwin Muggeridge63637.0-8.5
Green Roger Abbot26015.1+9.8
Labour Kevin Alan Stroud352.0-1.8
Majority1518.8
Turnout 48.2
Liberal Democrats gain from Conservative Swing

Capel, Leigh and Newdigate

Capel, Leigh and Newdigate
PartyCandidateVotes%±%
Liberal Democrats Lesley Jean Bushnell 835 50.9 +34.5
Conservative Corinna Osborne-Patterson58635.7-20.4
UKIP Geoff Cox1549.4-8.7
Green John Francis Roche654.0-5.3
Majority26915.2
Turnout 49.8
Liberal Democrats gain from Conservative Swing

Charlwood

Charlwood
PartyCandidateVotes%±%
Conservative Charles Iain Yarwood 282 46.4 -17.2
Green Lisa Claire Scott17128.1+21.7
UKIP Marjorie Joan Dixon8614.1-4.0
Liberal Democrats Timothy Edward Brooks6911.3-0.5
Majority11118.3
Turnout 33.4
Conservative hold Swing

Dorking South

Dorking South
PartyCandidateVotes%±%
Liberal Democrats Stephen John Cooksey 1,632 67.6 +27.9
Conservative Roger Edwin Riseley Jones45018.6-17.2
Labour James Rushcombe Stringer1727.1-0.2
UKIP Michael John Hird Foulston1596.6-1.4
Majority1,18249.0
Turnout 42.2
Liberal Democrats hold Swing

Holmwoods

Holmwoods
PartyCandidateVotes%±%
Liberal Democrats Claire Philomena Malcolmson 912 54.3 +4.1
Conservative Fiona Gail Meadows33620.0-10.7
UKIP Margaret Mary Curran19611.7-0.8
Green Tracey Harwood1207.2+0.6
Labour Laurence Paul Nasskau804.8N/A
SDP Pip English321.9N/A
Majority57634.3
Turnout 35.0
Liberal Democrats hold Swing

Leatherhead North

Leatherhead North
PartyCandidateVotes%±%
Liberal Democrats Keira Rowena Vyvyan-Robinson 726 42.6 +13.3
Conservative Paul Patrick Purcell56433.1-0.9
Labour Mark John Coote17510.3-4.3
UKIP David Gordon Payne1549.0-9.3
Green Vicki Elcoate875.1+1.2
Majority1629.5
Turnout 32.5
Liberal Democrats gain from Conservative Swing

Leith Hill

Leith Hill
PartyCandidateVotes%±%
Liberal Democrats Hazel Valerie Ann Watson 532 76.1 +32.2
Conservative David Karim Mir13819.7-27.9
Green Lucy Jane Barford294.1-0.3
Majority39456.4
Turnout 53.0
Liberal Democrats gain from Conservative Swing

Mickleham, Westhumble & Pixham

Mickleham, Westhumble & Pixham
PartyCandidateVotes%±%
Liberal Democrats Elsie Rosam 440 53.1 +13.7
Independent David Campbell Irvine23428.3-18.1
Conservative Gavin Timothy Charles Musgrave10212.3-34.1
Green Susan McGrath364.3-3.2
Labour Kim Rosslyn Coote161.9N/A
Majority20624.8
Turnout 54.7
Liberal Democrats gain from Conservative Swing

Note: David Campbell Irvine was the sitting councillor, having been elected as a Conservative in 2015.

Okewood

Okewood
PartyCandidateVotes%±%
Conservative Helyn Clack 240 43.5 -11.9
Liberal Democrats Steven Robert Round16930.6+17.7
UKIP Leigh Jones7613.8-3.8
Green Jennifer Lindsay Smith6712.1-2.1
Majority7112.9
Turnout 38.1
Conservative hold Swing

Related Research Articles

Mole Valley Non-metropolitan district in England

Mole Valley is a local government district in Surrey, England. Its council is based in Dorking.

City of Winchester Place in England

The City of Winchester is a local government district in Hampshire, England, with a city status.

2004 United Kingdom local elections Elections

The United Kingdom local elections of 2004 were held on 10 June, as part of the 2004 set of elections along with the European elections and the London mayoral and Assembly elections.

Epsom and Ewell (UK Parliament constituency) UK Parliament constituency since 1974

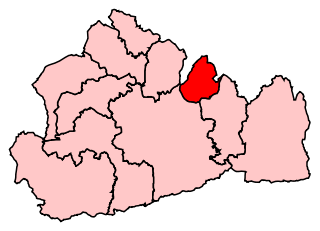
Epsom and Ewell is a constituency represented in the House of Commons of the UK Parliament since 2001 by Chris Grayling, a Conservative.

Penrith and The Border (UK Parliament constituency) Parliamentary constituency in the United Kingdom, 1950 onwards

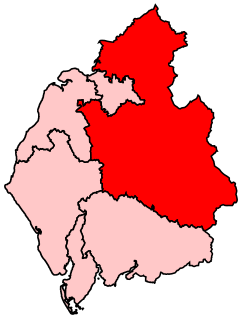
Penrith and The Border is a constituency in Cumbria represented in the House of Commons of the UK Parliament since 2019 by Neil Hudson, a Conservative.

Mole Valley (UK Parliament constituency) Parliamentary constituency in the United Kingdom, 1983 onwards

Mole Valley is a constituency represented in the House of Commons of the UK Parliament since 1997 by Sir Paul Beresford, a Conservative.

One third of Daventry District Council in Northamptonshire, England were elected each year, followed by one year when there was an election to Northamptonshire County Council instead. Since the last boundary changes in 1999, 38 councillors were elected from 24 wards. In another boundary review in 2012 the councillors were reduced to 36 councillors across 16 wards.

The 2000 Craven District Council election took place on 4 May 2000 to elect members of Craven District Council in North Yorkshire, England. One third of the council was up for election and the Conservative party stayed in overall control of the council.

2004 St Albans City and District Council election

The 2004 St Albans City and District Council election took place on 10 June 2004 to elect members of St Albans District Council in Hertfordshire, England. One third of the council was up for election and the council stayed under no overall control.

2010 Winchester City Council election

The 2010 Winchester Council election took place on 6 May 2010 to elect members of Winchester District Council in Hampshire, England. One third of the council was up for election and the Liberal Democrats gained overall control of the council from the Conservative Party.

2014 Cannock Chase District Council election

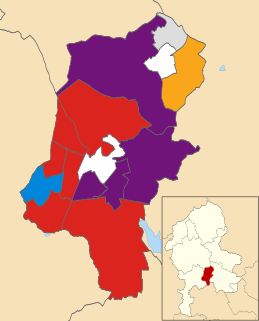
Elections to Cannock Chase District Council took place on 22 May 2014 on the same day as other local elections in England and the European Parliament elections. A third of the council was up for election, meaning a total of 13 councillors were elected from all but two of the council's wards. There were no elections held in the Hagley or Hednesford South wards as those wards elect only two councillors in the other two years of the election cycle.

2015 United Kingdom local elections Elections

The 2015 United Kingdom local elections were held on Thursday 7 May 2015, the same day as the general election for the House of Commons of the United Kingdom.

2015 Hyndburn Borough Council election

A by-thirds Hyndburn Borough Council local election took place on 7 May 2015. Approximately one third of the second tier council's 35 seats fell up for election, and the General Election was held on the same day.

The 2015 Mole Valley District Council election took place on 7 May 2015 to elect approximately one-third of members to Mole Valley District Council in England coinciding with other local elections held simultaneously with a general election which resulted in increased turnout compared to the election four years before. Some two-member wards such as Holmwoods did not hold a local election in this year, being contested in even-numbered years.

2015 West Dorset District Council election

The 2015 West Dorset District Council election was held on Thursday 7 May 2015 to elect councillors to West Dorset District Council in England. It took place on the same day as the general election other district council elections in the United Kingdom. A series of boundary changes saw the number of councillors reduced from 48 to 44.

2018 United Kingdom local elections Local elections held in the United Kingdom

Council elections in England were held on Thursday 3 May 2018. Elections were held in all 32 London boroughs, 34 metropolitan boroughs, 67 district and borough councils and 17 unitary authorities. There were also direct elections for the mayoralties of Hackney, Lewisham, Newham, Tower Hamlets and Watford.

2019 United Kingdom local elections Local elections held in the United Kingdom

Local elections in parts of the United Kingdom were held on Thursday 2 May 2019, with 248 English local councils, six directly elected mayors in England, and all 11 local councils in Northern Ireland being contested.

2018 Epping Forest District Council election

The 2018 Epping Forest District Council election took place on 3 May 2018 to elect members of Epping Forest District Council in England. This was on the same day as other local elections.

2021 Mole Valley District Council election English local election

The 2021 Mole Valley District Council election took place on 6 May 2021 to elect one-third of members to Mole Valley District Council in England. This Mole Valley local election had been postponed from 2020 because of the coronavirus pandemic, so it took place instead alongside the scheduled 2021 Surrey County Council election and all the other local elections across the United Kingdom. The 2021 election results are compared against the results when these wards were last contested five years previously, in 2016.

The 2018 Mole Valley District Council election took place on 3 May 2018 to elect approximately one-third of members to Mole Valley District Council in England, coinciding with other local elections. The Conservatives went into the elections with a majority of 1, but lost control of the council, leaving it with no overall majority. The 2018 election results are compared against the results when these wards were last contested four years previously, in 2014.

References

  1. "Mole Valley District Council". BBC. Retrieved 11 June 2019.
  2. "District Elections May 2019 - Mole Valley Results". Mole Valley District Council. Archived from the original on 26 December 2019. Retrieved 11 June 2019.