2019 Cheshire East Council election

Last updated

2019 Cheshire East Council election
Flag of Cheshire.svg
  2015 2 May 2019 (2019-05-02) 2023  

All 82 seats to Cheshire East Council
42 seats needed for a majority
 First partySecond partyThird party
  No image wide.svg No image wide.svg No image wide.svg
Party Conservative Labour Independent
Last election51 seats, 45.0%16 seats, 23.8%1 seat, 2.8%
Seats won342511
Seat changeDecrease2.svg 17Increase2.svg 9Increase2.svg 10
Popular vote60,83947,80718,951
Percentage35.5%27.9%11.1%
SwingDecrease2.svg 9.5%Increase2.svg 4.1%Increase2.svg 8.3%

 Fourth partyFifth party
  No image wide.svg No image wide.svg
Party Liberal Democrats Residents
Last election2 seats, 5.8%1 seat, 0.7%
Seats won44
Seat changeIncrease2.svg 2Increase2.svg 3
Popular vote18,8765,34
Percentage11.0%3.1%
SwingIncrease2.svg 5.2%Increase2.svg 2.4%

Cheshire East UK ward map 2019.svg
Winner of each seat at the 2019 Cheshire East Council election

Leader of the council before election

Rachel Bailey
Conservative

Leader of the council after election

Sam Corcoran
Labour

Elections to Cheshire East Council took place on Thursday 2 May 2019 in all 52 wards, with each ward returning between one and three councillors to the council. The Conservative Party lost overall control of the council, losing 17 seats; the Labour Party gained 9 seats, independents gained 6 and the Liberal Democrats gained 2. [1]

Contents

The elections were held against a background of a number of controversies, with the council facing eight criminal investigations. Multiple Conservative Cabinet members lost their seats, with Ainsley Arnold (Planning) losing out to Independents in Macclesfield Tytherington and Paul Bates (Finance) falling to fifth place in Congleton East, whilst then-Leader of the Council Rachel Bailey came within 78 votes of losing her seat to the Liberal Democrats. The biggest shocks came in Broken Cross and Upton, with Labour's Rob Vernon and James Barber becoming the first ever Labour councillors for the area and unseating the Mayor-elect, Liz Durham, and Sandbach Ettiley Heath and Wheelock, where Laura Crane achieved a huge swing to win the seat for Labour against Conservative councillor Gail Wait.

No party or grouping held a majority of the council seats, and so after a few weeks of negotiation, Labour and the Independents agreed to form a joint-Cabinet that would run the council for the following year, with a focus on changing the system of governance to abolish the Cabinet and replace it with the old committee system.

Summary

Election result

2019 Cheshire East Council election
PartyCandidatesSeatsGainsLossesNet gain/lossSeats %Votes %Votes+/−
  Conservative 8134017Decrease2.svg 1741.535.560,839–9.5
  Labour 652590Increase2.svg 930.527.947,807+4.1
  Independent 251170Increase2.svg 1013.411.118,951+8.3
  Liberal Democrats 33420Increase2.svg 24.911.018,876+5.2
  Residents 4430Increase2.svg 34.93.15,234+2.4
 Bollington First1200Increase2.svg 12.41.62,757+0.6
 Alderley Edge First1100Steady2.svg1.20.71,219+0.2
 Handforth Ratepayers2101Decrease2.svg 11.21.22,004±0.0
  Green 20000Steady2.svg0.05.59,370+1.2
  Women's Equality 1000Steady2.svg0.00.5826N/A
  Middlewich First 3003Decrease2.svg 30.01.11,961–0.8
  Animal Welfare 1000Steady2.svg0.00.3536N/A
  UKIP 2000Steady2.svg0.00.3502–9.8
  For Britain 2000Steady2.svg0.00.2402N/A

Results by ward

Alderley Edge

Alderley Edge (1 seat)
PartyCandidateVotes%
Alderley Edge First Craig Julian Browne1,219 76.86
Conservative Paul Nicholas Brearley25516.08
Green Keith Andrew Boxer1127.06
Turnout  42.79
Alderley Edge First hold

Alsager

Alsager (3 seats)
PartyCandidateVotes%
Liberal Democrats Rod Fletcher1,457 37.30
Liberal Democrats June Elizabeth Buckley 1,340 34.31
Liberal Democrats Phil Williams 1,297 33.21
Labour Jo Dale1,08227.70
Conservative Sue Helliwell1,02626.27
Conservative Martin William Deakin92023.55
Labour Julia Hawkins91923.53
Labour Michael James Unett87122.30
Conservative Paul Hugh Redstone79920.46
Green Hilary Jean Robinson54714.00
Animal Welfare PartyJane Catherine Smith53613.72
Turnout  40.69
Liberal Democrats hold
Liberal Democrats gain from Conservative

Audlem

Audlem (1 seat)
PartyCandidateVotes%
Conservative Rachel Anne Bailey746 52.76
Liberal Democrats Richard John Derricutt66847.24
Turnout  36.03
Conservative hold

Bollington

Bollington (2 seats)
PartyCandidateVotes%
Bollington First Amanda Stott1,447 52.01
Bollington First James William David Nicholas1,310 47.09
Labour John William Place70525.34
Labour Mike Hutchison63522.83
Conservative Elaine Mary Houghton48117.29
Liberal Democrats Johanna Maitland30911.11
Conservative Christopher Paul O'Leary27910.03
Turnout 40.11
Bollington First hold

Brereton Rural

Brereton Rural (1 seat)
PartyCandidateVotes%
Conservative John Valentine Wray850 52.24
Independent Mark Cameron Elves47429.13
Labour Geraint Huw Price Jones30318.62
Turnout 34.95
Conservative hold

Broken Cross and Upton

Broken Cross and Upton (2 seats)
PartyCandidateVotes%
Labour Rob Vernon 948 38.23
Labour James William Barber 889 35.85
Conservative Liz Durham76430.81
Conservative Gareth Jones65326.33
GreenDavid John Mayers40616.37
Liberal Democrats Max Muncaster39215.81
IndependentMartin Christopher Hardy 31712.78
UKIP Maddie Mitchell1957.86
Turnout 36.6
Labour gain from Conservative

Bunbury

Bunbury (1 seat)
PartyCandidateVotes%
Conservative Sarah Joanne Pochin 750 54.47
Liberal Democrats Mark Peregrine Ireland-Jones62745.53
Turnout 37.51
Conservative hold

Chelford

Chelford (1 seat)
PartyCandidateVotes%
Conservative Marc Nigel Asquith 646 51.75
Liberal Democrats Heulwen Ann Barlow33026.48
Independent Laurence Michael Hobday27021.67
Turnout 36.21
Conservative hold

Congleton East

Congleton East (3 seats)
PartyCandidateVotes%
Liberal Democrats Denis Murphy 1,041 27.66
Independent Rob Moreton 1,040 27.64
Conservative David Thomas Brown1,028 27.32
Independent Anthony Philip Bolding98926.28
Conservative Paul David Bates95025.25
Conservative Glen Samuel Williams89423.76
Women's Equality Kay Wesley82621.95
Liberal Democrats Robert Julian Douglas76520.33
Liberal Democrats James Nicholas Andrew Smith74019.67
Independent Simon Peter Clodd-Broom69918.58
Labour Peter John Ranson64917.25
Labour Ethel Mary Ranson63516.87
Turnout 34.78
Liberal Democrats gain from Conservative
Independent gain from Conservative
Conservative hold

Congleton West

Congleton West (3 seats)
PartyCandidateVotes%
Independent Suzie Akers Smith 1,195 34.03
Conservative George Patrick Hayes 1,059 30.15
Conservative Sally Ann Holland 1,009 28.73
Conservative Geoff Baggot96027.33
Liberal Democrats Suzy Firkin93326.57
Labour Heather Seddon70019.93
Labour Alfie Seddon68519.50
Liberal Democrats Paul Michael Duffy66518.94
Liberal Democrats Robert Philip Hemsley66018.79
Independent Adam Clive Scott64918.48
Independent Sharon Smith63618.11
Labour Irene Faseyi56716.14
Turnout 32.52
Independent gain from Conservative
Conservative hold
Conservative hold

Crewe Central

Crewe Central (1 seat)
PartyCandidateVotes%
Labour Anthony Jack Critchley 450 60.98
Conservative Jonathan Ford Bebbington13918.83
Liberal Democrats Gwyn Griffiths9412.74
Independent Adam Ali Mustafa557.45
Turnout 17.52
Labour hold

Crewe East

Crewe East (3 seats)
PartyCandidateVotes%
Labour Joy Bratherton1,353 52.46
Labour Suzanne Marie Brookfield1,340 51.96
Labour Hazel Faddes 1,239 48.04
Independent James Albert Connor61023.65
Conservative Peter Hargreaves56922.06
Conservative Clive Dunning Elverstone52120.20
Conservative Dominic John Bernard Wyartt48318.73
Green Melanie Ruth English47818.53
Turnout 23.69
Labour hold
Labour hold
Labour hold

Crewe North

Crewe North (1 seat)
PartyCandidateVotes%
Labour Jill Rhodes 471 48.71
For Britain Brian George Silvester29730.71
Conservative Ryan Joseph Moore19920.58
Turnout 26.90
Labour hold

Crewe South

Crewe South (2 seats)
PartyCandidateVotes%
Labour Dorothy Hilda Flude1,138 59.39
Labour Steven William Hogben1,052 54.91
Conservative Nicola Cooper47124.58
Conservative Arnob Ahmed46624.32
Liberal Democrats James Clifford Hughes24012.53
Turnout 24.95
Labour hold
Labour hold

Crewe St. Barnabas

Crewe St. Barnabas (1 seat)
PartyCandidateVotes%
Labour Sally Elizabeth Handley 426 74.48
Conservative Cherene Chantel Kefira Bracegirdle-Smith14625.52
Turnout 15.95
Labour hold

Crewe West

Crewe West (2 seats)
PartyCandidateVotes%
Labour Brian Roberts1,013 58.18
Labour Marilyn Houston 940 53.99
Independent Roy Cartlidge43424.93
Conservative Patrick James Timms40923.49
Conservative Martin Clynes34419.76
Turnout 22.97
Labour hold
Labour hold

Dane Valley

Dane Valley (2 seats)
PartyCandidateVotes%
Conservative Les Gilbert1,583 52.40
Conservative Andrew Michael James Kolker1,539 50.94
Liberal Democrats Richard James Wilson93630.98
Liberal Democrats Michelle Boath74824.76
Green Robert Michael St. John Green40213.31
Labour Willow Dale2598.57
Labour Pete Dale2307.61
Turnout 37.58
Conservative hold
Conservative hold

Disley

Disley (1 seat)
PartyCandidateVotes%
Independent Brendan Patrick Murphy 762 49.16
Labour Alison Smith39925.74
Conservative Harold Davenport38925.10
Turnout 39.32
Independent gain from Conservative

Gawsworth

Gawsworth (1 seat)
PartyCandidateVotes%
Conservative Lesley Smetham883 72.85
Labour Fiona Wilson32927.15
Turnout 37.77
Conservative hold

Handforth

Handforth (2 seats)
PartyCandidateVotes%
Independent Julie Anne Smith 1,297 52.60
Handforth Ratepayers' Association (Independent) Barry Edward Burkhill1,086 44.04
Handforth Ratepayers' Association (Independent)Susan Ann Elizabeth Bidwell91837.23
Conservative David Lonsdale59524.13
Liberal Democrats Chris Fortune38315.53
Turnout 33.67
Independent gain from Handforth Ratepayers' Association
Handforth Ratepayers' Association hold

Haslington

Haslington (2 seats)
PartyCandidateVotes%
Conservative Steven John Edgar 1,061 44.15
Conservative Mary Elizabeth Addison 1,058 44.03
Labour Pete Gubbins71629.80
Green Louise Amber Jewkes69628.96
Liberal Democrats Nick Taylor29312.19
Green Te Ata Browne28711.94
Turnout 35.03
Conservative hold
Conservative hold

High Legh

High Legh (1 seat)
PartyCandidateVotes%
Conservative Kate Parkinson 710 53.71
Green Nigel Robert Hennerley61246.29
Turnout 36.62
Conservative hold

Knutsford

Knutsford (3 seats)
PartyCandidateVotes%
Conservative Stewart Gardiner1,310 38.83
Independent Quentin Abel 1,290 38.23
Conservative Tony Dean1,243 36.84
Conservative Peter David Coan1,17434.80
Green Charlie William Abbott Booth91727.18
Liberal Democrats Christopher Avery Wetherell91227.03
Labour Joe Goddard84825.13
Independent Helen Ghislaine Rogers83024.60
Turnout 32.57
Conservative hold
Independent gain from Conservative
Conservative hold

Leighton

Leighton (1 seat)
PartyCandidateVotes%
Independent Byron Evans 608 44.74
Conservative Sean Owen Alexander Houlston42531.27
Labour Alison Joy Spiceer32623.99
Turnout 31.48
Independent gain from Conservative

Macclesfield Central

Macclesfield Central (2 seats)
PartyCandidateVotes%
Labour Liz Braithwaite 1,027 42.83
Labour Ashley Philip Kenneth Farrall 829 34.57
Green John Anthony Knight78332.65
Green Charlie Morgan Keller59424.77
Conservative Beverley Anne Dooley50521.06
Conservative David Philip Dooley43718.22
Independent Nigel Manton2169.01
For Britain Tony Myrie1054.38
Turnout 33.22
Labour hold
Labour gain from Conservative

Macclesfield East

Macclesfield East (1 seat)
PartyCandidateVotes%
Independent Mick Warren984 69.00
Labour Jan Elizabeth Baddeley20514.38
Green Lindy Brett1379.61
Conservative John Le Moignan1007.01
Turnout 39.90
Independent hold

Macclesfield Hurdsfield

Macclesfield Hurdsfield (1 seat)
PartyCandidateVotes%
Labour Stephen Frank Carter558 58.80
Conservative Alastair Crawford Kennedy20621.71
Green James Andrew Booth18519.49
Turnout 27.93
Labour hold

Macclesfield South

Macclesfield South (2 seats)
PartyCandidateVotes%
Labour Laura Jeuda1,133 62.49
Labour Brian Mark Puddicombe 1,049 57.86
Conservative Philip Bolton59933.04
Conservative John Christopher Waterhouse52829.12
Turnout 29.06
Labour hold
Labour gain from Conservative

Macclesfield Tytherington

Macclesfield Tytherington (2 seats)
PartyCandidateVotes%
Independent David Edwardes 1,288 43.57
Independent Lloyd Roberts 1,130 38.23
Conservative Ainsley William Arnold83028.08
Conservative Nick Taylor74225.10
Labour Rebecca Ann Vernon42914.51
Green Walter John Houston39413.33
Liberal Democrats Ahmad Kamal Ibrahim Arafa38212.92
Labour Victoria Amy Vernon36412.31
Turnout 40.57
Independent hold
Independent gain from Conservative

Macclesfield West and Ivy

Macclesfield West and Ivy (2 seats)
PartyCandidateVotes%
Labour Nicholas Peter Mannion1,070 56.26
Labour Alift Iris Eugenie Harewood950 49.95
Conservative Adam Francis Schofield60831.97
Conservative Abhishika Srivastav38720.35
UKIP Joseph Nicholas Foster30716.14
Turnout 30.32
Labour hold
Labour hold

Middlewich

Middlewich (3 seats)
PartyCandidateVotes%
Labour Mike Hunter 1,735 51.93
Labour Jonathan Parry 1,730 51.78
Labour Carol Bulman 1,687 50.49
Conservative Alison Roylance-White75522.60
Conservative Paul John Edwards74722.36
Middlewich First Bernice Walmsley70421.07
Middlewich First Simon Nicholas McGrory67420.17
Conservative Bill McCracken63318.95
Middlewich First William Walmsley58317.45
Turnout 29.94
Labour gain from Middlewich First

Mobberley

This ward's single seat was uncontested.

Mobberley (1 seat)
PartyCandidateVotes%
Conservative Charlotte Frances Leach 0 0.00
Turnout 0.00
Conservative hold

Nantwich North and West

Nantwich North and West (2 seats)
PartyCandidateVotes%
Independent Arthur Moran1,345 51.32
Independent Penny Butterill1,188 45.33
Conservative Vicky Higham71827.39
Conservative John Patrick Statham70026.71
Labour Joy O'Hara-Douglas53120.26
Labour Jake Lomax52019.84
Turnout 36.97
Independent hold
Independent hold

Nantwich South and Stapeley

Nantwich South and Stapeley (2 seats)
PartyCandidateVotes%
Conservative Andrew Edwin Martin1,224 46.81
Conservative Peter Graham Groves1,106 42.29
Labour Richard Alexander Banks61323.44
Labour Sinead Vera Lois Wheeler56521.61
Liberal Democrats Stephen Ford52019.89
Liberal Democrats Matthew Cameron Theobald51619.73
Independent Stuart Robert Bostock42616.29
Turnout 36.37
Conservative hold
Conservative hold

Odd Rode

Odd Rode (2 seats)
PartyCandidateVotes%
Conservative Liz Wardlaw934 45.94
Conservative Patrick Hugh Redstone 804 39.55
Labour Sam O'Bree65632.37
Labour James Longshaw64431.68
Liberal Democrats Ronald Tyson49624.40
Turnout 30.44
Conservative hold
Conservative hold

Poynton East and Pott Shrigley

Poynton East and Pott Shrigley (2 seats)
PartyCandidateVotes%
Conservative Jos Saunders1,417 57.53
Conservative Nicky Wylie 1,395 56.64
Labour Clayre Reid69328.14
Green Renaud Claire60624.60
Labour Robert William Sabin52221.19
Turnout 36.97
Conservative hold
Conservative hold

Poynton West and Adlington

Poynton West and Adlington (2 seats)
PartyCandidateVotes%
Conservative Michael Beanland1,277 51.51
Conservative Mike Sewart1,241 50.06
Green Kathleen Marjorie Booth60224.28
Labour Sarah Jill Marshall58323.52
Green Andrew Gordon Hill56322.71
Labour Ronald Geoffrey Thompson48919.73
Turnout 36.54
Conservative hold
Conservative hold

Prestbury

Prestbury (1 seat)
PartyCandidateVotes%
Conservative John Paul Findlow1,162 88.57
Labour Ted Wall15011.43
Turnout 37.13
Conservative hold

Sandbach Elworth

Sandbach Elworth (1 seat)
PartyCandidateVotes%
Labour Kathryn Anne Flavell 808 56.70
Conservative Gill Merry61743.30
Turnout 33.46
Labour gain from Conservative

Sandbach Ettiley Heath and Wheelock

Sandbach Ettiley Heath and Wheelock (1 seat)
PartyCandidateVotes%
Labour Laura Elisabeth Crane 665 53.54
Conservative Gail Wait57746.46
Turnout 29.65
Labour gain from Conservative

Sandbach Heath and East

Sandbach Heath and East (1 seat)
PartyCandidateVotes%
Labour Sam Corcoran754 60.71
Conservative Mike Muldoon37029.79
Liberal Democrats Pauline Marie Hubbard1189.50
Turnout 34.81
Labour hold

Sandbach Town

Sandbach Town (1 seat)
PartyCandidateVotes%
Conservative Mike Benson 914 59.86
Labour Paula Eaton61340.14
Turnout 37.44
Conservative hold

Shavington

Shavington (1 seat)
PartyCandidateVotes%
Conservative David Frank Marren 586 48.79
Labour Linda Jane Buchanan50842.30
Liberal Democrats John Martin Phillips1078.91
Turnout 32.10
Conservative hold

Sutton

Sutton (1 seat)
PartyCandidateVotes%
Conservative Andrew Harry Gregory 687 47.12
Green Karen Jane Downard31021.26
Labour John Reece Evans29720.37
Liberal Democrats Stephen Laurence Broadhead16411.25
Turnout 41.30
Conservative hold

Willaston and Rope

Willaston and Rope (1 seat)
PartyCandidateVotes%
Conservative Allen Gage 707 43.89
Labour Ben Wye53633.27
Green Richard John Bennett24815.39
Liberal Democrats David Joseph Parkes1207.45
Turnout 41.14
Conservative hold

Wilmslow Dean Row

Wilmslow Dean Row (1 seat)
PartyCandidateVotes%
Residents of Wilmslow Toni Fox930 69.45
Conservative Frank McCarthy40930.55
Turnout 36.13
Residents of Wilmslow hold

Wilmslow East

Wilmslow East (1 seat)
PartyCandidateVotes%
Residents of Wilmslow David Jefferay 1,076 73.30
Conservative Barry Estill39226.70
Turnout 45.50
Residents of Wilmslow gain from Conservative

Wilmslow Lacey Green

Wilmslow Lacey Green (1 seat)
PartyCandidateVotes%
Conservative Don Stockton544 42.83
Labour Ribia Nisa40832.13
Liberal Democrats Damian Peter Carr31825.04
Turnout 36.10
Conservative hold

Wilmslow West and Chorley

Wilmslow West and Chorley (2 seats)
PartyCandidateVotes%
Residents of Wilmslow Mark Goldsmith 1,758 56.73
Residents of Wilmslow Iain Macfarlane 1,470 47.43
Conservative Gary Philip Barton81926.43
Conservative Ellie Brooks81926.43
Liberal Democrats Birgitta Hoffmann53217.17
Liberal Democrats Oliver Jeremy Romain44514.36
Turnout 39.03
Residents of Wilmslow gain from Conservative

Wistaston

Wistaston (2 seats)
PartyCandidateVotes%
Conservative Margaret Joan Simon1,196 44.23
Conservative Jacquie Weatherill1,168 43.20
Labour Vicky Smith1,11841.35
Labour John Scott97536.06
Green Kim Heyes49118.16
Turnout 36.33
Conservative hold
Conservative hold

Wrenbury

Wrenbury (1 seat)
PartyCandidateVotes%
Conservative Stan Davies926 62.86
Liberal Democrats Paul James Weaver32822.27
Independent David John Bell21914.87
Turnout 34.34
Conservative hold

Wybunbury

Wybunbury (1 seat)
PartyCandidateVotes%
Conservative Janet Christine Clowes1,267 82.11
Labour Joseph Andrew Cosby27617.89
Turnout 36.02
Conservative hold

Notes

1. ^ Elected as a Conservative councillor for the same ward in 2015.

Related Research Articles

Guildford Borough Council in Surrey, England is elected every four years.

<span class="mw-page-title-main">Politics of Bristol</span> Overview of the politics of Bristol

The city of Bristol, England, is a unitary authority, represented by four MPs representing seats wholly within the city boundaries. The overall trend of both local and national representation became left of centre during the latter 20th century. The city has a tradition of local activism, with environmental issues and sustainable transport being prominent issues in the city.

<span class="mw-page-title-main">2006 St Helens Metropolitan Borough Council election</span> 2006 UK local government election

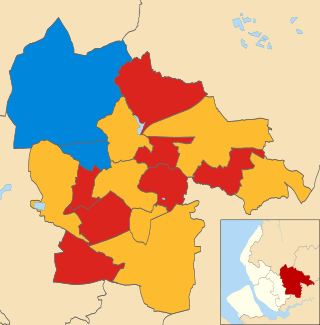
The 2006 St Helens Metropolitan Borough Council election took place on 4 May 2006 to elect members of St Helens Metropolitan Borough Council in Merseyside, England. One third of the council was up for election and the council stayed under no overall control.

<span class="mw-page-title-main">2008 St Albans City and District Council election</span> 2008 UK local government election

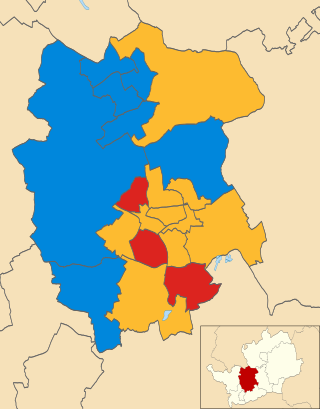
The 2008 St Albans City and District Council election took place on 1 May 2008 to elect members of St Albans District Council in Hertfordshire, England. One third of the council was up for election and the Liberal Democrats gained overall control of the council from no overall control.

The 2007 council elections in Guildford saw the Conservatives retain control over Guildford Borough Council. Full results for each ward can be found at Guildford Council election, full results, 2007.

<span class="mw-page-title-main">2008 Solihull Metropolitan Borough Council election</span> 2008 UK local government election

The 2008 Solihull Metropolitan Borough Council election took place on 1 May 2008 to elect members of Solihull Metropolitan Borough Council in the West Midlands, England. One third of the council was up for election and the Conservative Party gained overall control of the council from no overall control.

<span class="mw-page-title-main">2007 St Albans City and District Council election</span> 2007 UK local government election

The 2007 St Albans City and District Council election took place on 3 May 2007 to elect members of St Albans District Council in Hertfordshire, England. One third of the council was up for election and the Liberal Democrats lost overall control of the council to no overall control.

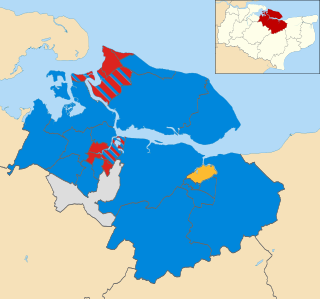
The 2004 Halton Borough Council election took place on 10 June 2004 to elect members of Halton Unitary Council in Cheshire, England. The whole council was up for election with boundary changes since the last election in 2002. The Labour Party stayed in overall control of the council.

<span class="mw-page-title-main">2004 Pendle Borough Council election</span> 2004 UK local government election

The 2004 Pendle Borough Council election took place on 10 June 2004 to elect members of Pendle Borough Council in Lancashire, England. One third of the council was up for election and the Liberal Democrats gained overall control of the council from no overall control.

<span class="mw-page-title-main">2012 East Lothian Council election</span>

2012 Elections to East Lothian Council were held on 3 May 2012, on the same day as the other Scottish local government elections. The election used the 7 wards created as a result of the Local Governance (Scotland) Act 2004, with each ward electing three or four councillors using the single transferable vote system form of proportional representation, with 23 councillors elected.

<span class="mw-page-title-main">2013 Norfolk County Council election</span> 2013 UK local government election

The Norfolk County Council election took place across Norfolk on 2 May 2013, coinciding with local elections for all county councils in England. The results were announced the following day, Friday 3 May 2013. The result brought to an end 12 years of Conservative administration, who finished three seats short of a majority after losing 20 seats, leaving the Council in no overall control (NOC). UKIP and the Labour Party both made gains of 14 and 11 seats respectively. The Liberal Democrats and the Green Party both lost three seats each, whilst an independent won a single seat in North Norfolk.

<span class="mw-page-title-main">2014 Havant Borough Council election</span> 2014 UK local government election

The 2014 Havant Borough Council election took place on 22 May 2014 to elect members of Havant Borough Council in Hampshire, England. One third of the council was up for election and the Conservative Party stayed in overall control of the council.

<span class="mw-page-title-main">2011 Swale Borough Council election</span> 2011 UK local government election

The 2011 Swale Borough Council election took place on 5 May 2011 to elect members of Swale Borough Council in Kent, England. The whole council was up for election and the Conservative Party stayed in overall control of the council.

<span class="mw-page-title-main">2011 West Oxfordshire District Council election</span> 2011 UK local government election

The 2011 West Oxfordshire District Council election took place on 5 May 2011 to elect members of West Oxfordshire District Council in Oxfordshire, England. One third of the council was up for election and the Conservative Party stayed in overall control of the council.

2017 Elections to East Dunbartonshire Council were held on Thursday 4 May, the same day as the 31 other local authorities in Scotland. The election used seven wards created under the Local Governance (Scotland) Act 2004, a reduction of one from 2012, with 22 Councillors being elected, 2 fewer overall. Each ward elected either 3 or 4 members, using the STV electoral system.

<span class="mw-page-title-main">2019 Cheshire West and Chester Council election</span> 2019 UK local government election

The 2019 Cheshire West and Chester Council election took place on 2 May 2019 to elect members of Cheshire West and Chester Council in England. This was on the same day as other local elections. Five fewer seats were contested because of boundary changes. No party gained overall control. The Labour Party gained a seat but lost control of the council; the Conservatives lost 8 seats, while the Independents gained 4, the Liberal Democrats gained 2, and the Green Party gained one.

<span class="mw-page-title-main">2019 Guildford Borough Council election</span> Local election in Surrey, England

The 2019 Guildford Borough Council election were held on 2 May 2019, to elect all 48 seats to the Guildford Borough Council in Surrey, England as part of the 2019 local elections.

<span class="mw-page-title-main">2022 Dundee City Council election</span> Dundee City Council election

The 2022 Dundee City Council election took place on 5 May 2022, the same day as the 31 other Scottish local government elections. Each ward elected three or four councillors using the single transferable vote system, a form of proportional representation used since the 2007 election and according to the Local Governance (Scotland) Act 2004.

<span class="mw-page-title-main">2022 Colchester Borough Council election</span> 2022 UK local government election

Elections to Colchester Borough Council took place on 5 May 2022. Eighteen members of the council were elected: one from 16 of the 17 wards, and two councillors from New Town & Christ Church ward, following the death of incumbent councillor Nick Cope, elected in 2019 and due to serve until 2023.

<span class="mw-page-title-main">2022 Angus Council election</span> Angus Council election

Elections to Angus Council took place on 5 May 2022, the same day as the 31 other Scottish local government elections. As with other Scottish council elections, it was held using single transferable vote (STV) – a form of proportional representation – in which multiple candidates are elected in each ward and voters rank candidates in order of preference.

References

  1. "Cheshire East Council: 2019 Cheshire East Borough Election Results". Cheshire East Council. 3 May 2019. Retrieved 6 May 2019.