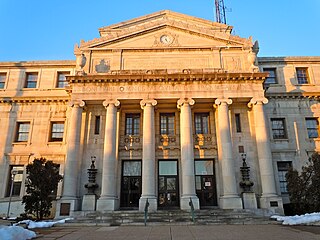
1992 Chester City Council election

Last updated
1992 Chester City Council election
Flag of Cheshire.svg
  1991 7 May 1992 (1992-05-07) 1994  

20 out of 60 seats to Chester City Council
31 seats needed for a majority
 First partySecond party
  No image wide.svg No image wide.svg
Party Conservative Labour
Last election24 seats, 36.9%21 seats, 34.6%
Seats won95
Seats after2319
Seat changeDecrease2.svg 1Decrease2.svg 2
Popular vote13,22310,126
Percentage41.0%31.4%
SwingIncrease2.svg 4.1%Decrease2.svg 3.2%

 Third partyFourth party
  No image wide.svg No image wide.svg
Party Liberal Democrats Independent
Last election14 seats, 24.0%1 seat, 3.9%
Seats won51
Seats after162
Seat changeIncrease2.svg 2Increase2.svg 1
Popular vote7,7161,060
Percentage23.9%3.3%
SwingDecrease2.svg 0.1%Decrease2.svg 0.6%

Chester UK ward map 1992.svg
Winner of each seat at the 1992 Chester City Council election

Council control before election


No overall control

Council control after election


No overall control

The 1992 Chester City Council election took place on 7 May 1992 to elect members of Chester City Council in Cheshire, England. [1] This was on the same day as other local elections.

Contents

Summary

Election result

1992 Chester City Council election
PartyThis electionFull councilThis election
SeatsNetSeats %OtherTotalTotal %VotesVotes %+/−
  Conservative 9Decrease2.svg 145.0142337.713,22341.0+4.1
  Labour 5Decrease2.svg 225.0141931.110,12631.4–3.2
  Liberal Democrats 5Increase2.svg 225.0111626.27,71623.9–0.1
  Independent 1Increase2.svg 15.0124.91,0603.3–0.6
  Ratepayer 0Steady2.svg0.0000.0840.3+0.1
  Green 0Steady2.svg0.0000.0430.1–0.3

Ward results

Blacon Hall

Blacon Hall
PartyCandidateVotes%±%
Labour J. Randall* 842 78.0 –6.9
Conservative T. Truesdale23822.0+6.9
Majority60455.9–13.7
Turnout 1,08125.8–10.7
Registered electors 4,184
Labour hold Swing Decrease2.svg6.9

Boughton

Boughton
PartyCandidateVotes%±%
Labour D. Halley 683 51.5 –17.1
Conservative G. Robinson52639.7+16.4
Liberal Democrats P. Brett1168.8+0.6
Majority15711.8–33.4
Turnout 1,32650.6–9.6
Registered electors 2,618
Labour hold Swing Decrease2.svg16.8

Christleton

Christleton
PartyCandidateVotes%±%
Conservative B. Bailey* 1,056 61.5 +3.7
Liberal Democrats R. Beith33119.3–1.2
Labour S. Wardman33019.2–2.5
Majority72542.2+6.1
Turnout 1,71746.4–3.6
Registered electors 3,697
Conservative hold Swing Increase2.svg2.5

College

College
PartyCandidateVotes%±%
Labour C. Russell* 1,059 56.0 –2.3
Conservative A. Hodgson52727.9+2.2
Liberal Democrats J. Pay22011.6–0.1
Ratepayer D. Taylor844.4±0.0
Majority53228.1–4.5
Turnout 1,89040.4–5.3
Registered electors 4,676
Labour hold Swing Decrease2.svg2.3

Curzon

Curzon
PartyCandidateVotes%±%
Conservative J. Price 809 47.8 +9.4
Labour L. Nixon68640.5–21.1
Liberal Democrats J. Main19811.7N/A
Majority1237.3N/A
Turnout 1,69357.7–11.2
Registered electors 2,936
Conservative gain from Labour Swing Increase2.svg15.3

Dee Point

Dee Point
PartyCandidateVotes%±%
Labour J. Fetherston* 875 66.4 –14.7
Conservative J. Jaworzyn35526.9+8.0
Liberal Democrats J. Indermaur886.7N/A
Majority52039.5–22.6
Turnout 1,31830.1–9.1
Registered electors 4,378
Labour hold Swing Decrease2.svg11.4

Farndon

Farndon
PartyCandidateVotes%±%
Conservative S. Rowlandson* 529 78.0 +4.4
Labour P. Byrne14922.0–4.4
Majority38056.0+8.8
Turnout 67840.3+0.6
Registered electors 1,683
Conservative hold Swing Increase2.svg4.4

Grosvenor

Grosvenor
PartyCandidateVotes%±%
Conservative P. Connolly 1,152 52.2 +5.9
Labour S. Rudd74933.9–3.3
Liberal Democrats P. Speirs30713.9–2.5
Majority40318.3+9.2
Turnout 2,20852.0–7.9
Registered electors 4,244
Conservative hold Swing Increase2.svg4.6

Hoole

Hoole
PartyCandidateVotes%±%
Liberal Democrats T. Veitch* 1,084 49.5 –1.6
Labour M. Foster84838.7–0.5
Conservative M. Vaughan25811.8+2.1
Majority23610.8–1.1
Turnout 2,19051.5–7.5
Registered electors 4,256
Liberal Democrats hold Swing Decrease2.svg0.6

Malpas

Malpas
PartyCandidateVotes%±%
Independent C. Higgie 600 51.0 +8.2
Conservative G. Roberts57749.0–1.2
Majority232.0N/A
Turnout 1,17740.2–7.2
Registered electors 2,926
Independent gain from Conservative Swing Increase2.svg4.7

Newton

Newton
PartyCandidateVotes%±%
Conservative J. Ebo* 995 47.6 +8.6
Liberal Democrats W. Williams75736.2–5.8
Labour W. Megarrell34016.3–2.7
Majority23811.4N/A
Turnout 2,09252.6–5.6
Registered electors 3,975
Conservative hold Swing Increase2.svg7.2

Plas Newton

Plas Newton
PartyCandidateVotes%±%
Liberal Democrats T. Ralph* 774 38.1 –11.5
Conservative A. Smith72935.9+14.5
Labour A. Mulvihill52826.0–3.0
Majority452.2N/A
Turnout 2,03156.5–3.2
Registered electors 3,596
Liberal Democrats hold Swing Decrease2.svg13.0

Saughall

Saughall
PartyCandidateVotes%±%
Conservative A. Coughlan* 697 48.5 +4.7
Liberal Democrats J. Ballard59341.2+5.1
Labour S. Newton14810.3–9.7
Majority1047.2–0.5
Turnout 1,43849.0–8.0
Registered electors 2,933
Conservative hold Swing Decrease2.svg0.2

Sealand

Sealand
PartyCandidateVotes%±%
Labour R. Bott* 814 57.4 –8.2
Conservative J. David34524.3+4.5
Liberal Democrats E. Bowman26018.3+10.1
Majority46933.1–12.7
Turnout 1,41942.0–5.2
Registered electors 3,382
Labour hold Swing Decrease2.svg6.4

Tattenhall

Tattenhall
PartyCandidateVotes%±%
Conservative M. Jones 510 45.6 N/A
Independent B. Smith46041.1N/A
Liberal Democrats T. Williams14813.2N/A
Majority504.5N/A
Turnout 1,11844.0–2.5
Registered electors 2,534
Conservative hold

Upton Grange

Upton Grange
PartyCandidateVotes%±%
Liberal Democrats C. Bain 789 53.7 –3.2
Conservative J. Butler*54737.2+12.2
Labour N. King1349.1–9.0
Majority24216.5–15.5
Turnout 1,47051.0–8.9
Registered electors 2,879
Liberal Democrats gain from Conservative Swing Decrease2.svg7.7

Upton Heath

Upton Heath
PartyCandidateVotes%±%
Conservative N. Fitton 1,114 49.4 +3.9
Labour S. Grant92441.0–2.9
Liberal Democrats P. Hancox2189.7–0.9
Majority1908.4+6.8
Turnout 2,25655.3–5.2
Registered electors 4,079
Conservative gain from Labour Swing Increase2.svg3.4

Vicars Cross

Vicars Cross
PartyCandidateVotes%±%
Liberal Democrats K. Holding* 1,040 52.9 –11.4
Conservative D. Robotham57129.0+8.9
Labour P. Whitley35518.1+2.6
Majority46923.9–20.3
Turnout 1,96647.1–6.6
Registered electors 4,173
Liberal Democrats hold Swing Decrease2.svg10.2

Waverton

Waverton
PartyCandidateVotes%±%
Liberal Democrats C. Walley 428 49.4 +6.3
Conservative J. Cleland37743.5–1.2
Labour F. Baker627.2–5.0
Majority515.9N/A
Turnout 86761.3
Registered electors 1,415
Liberal Democrats gain from Conservative Swing Increase2.svg3.8

Westminster

Westminster
PartyCandidateVotes%±%
Conservative R. Short* 1,311 56.5 +12.6
Labour L. Barlow60025.9–6.7
Liberal Democrats A. Stobie36515.7–5.2
Green M. Barker431.9–0.7
Majority71130.7+19.4
Turnout 2,31949.2–14.6
Registered electors 4,710
Conservative hold Swing Increase2.svg9.7

Related Research Articles

<span class="mw-page-title-main">Chester, Pennsylvania</span> First city in Pennsylvania, United States

Chester is a city in Delaware County, Pennsylvania, United States. It is located in the Delaware Valley on the western bank of the Delaware River between Philadelphia and Wilmington, Delaware. The population of Chester was 32,605 at the 2020 census.

<span class="mw-page-title-main">Chester</span> City in Cheshire, England

Chester is a cathedral city and the county town of Cheshire, England, on the River Dee, close to the England-Wales border. With a built up area population of 92,400 in 2021, it is the most populous settlement of Cheshire West and Chester and serves as its administrative headquarters. It is also the historic county town of Cheshire and the second-largest settlement in Cheshire after Warrington.

<span class="mw-page-title-main">Ellesmere Port and Neston</span>

Ellesmere Port and Neston was, from 1974 to 2009, a local government district with borough status in Cheshire, England. It covered the southern part of the Wirral Peninsula, namely that part which is not included in the Metropolitan Borough of Wirral.

Christine Margaret Russell is a British Labour Party politician who was the Member of Parliament (MP) for the City of Chester from 1997 to 2010. She lost her seat to the Conservative Stephen Mosley at the 2010 general election.

<span class="mw-page-title-main">Chester (district)</span>

Chester was a non-metropolitan local government district of Cheshire, England from 1974 to 2009. It had the status of a city and a borough, and the local authority was called Chester City Council.

<span class="mw-page-title-main">City of Chester (UK Parliament constituency)</span> UK Parliament constituency since 1918

The City of Chester is a constituency represented in the House of Commons of the UK Parliament since 2 December 2022 by Samantha Dixon of the Labour Party. She was elected in the by-election held following the resignation of Chris Matheson MP on 21 October 2022.
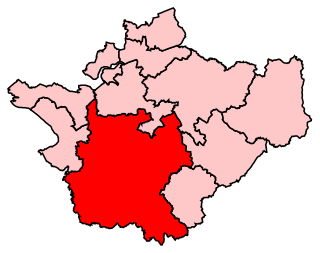
<span class="mw-page-title-main">Eddisbury (UK Parliament constituency)</span> Parliamentary constituency in the United Kingdom, 1885 to 1950 and 1983 onwards

Eddisbury is a constituency in Cheshire represented in the House of Commons of the UK Parliament since 2019 by Edward Timpson, a Conservative.

<span class="mw-page-title-main">Ellesmere Port and Neston (UK Parliament constituency)</span> UK Parliament constituency since 1983

Ellesmere Port and Neston is a constituency represented in the House of Commons of the UK Parliament since 2015 by Justin Madders of the Labour Party.

<span class="mw-page-title-main">Deva Stadium</span> Football stadium in Chester, England

Deva Stadium is an association football stadium which is the home of Chester F.C., the effective successor club to the liquidated Chester City. The stadium straddles the England-Wales border at Sealand, on the outskirts of Chester.

<span class="mw-page-title-main">Guilden Sutton</span> Human settlement in England

Guilden Sutton is a civil parish and village in the unitary authority of Cheshire West and Chester and the ceremonial county of Cheshire, England. The village lies approximately 3 miles (5 km) to the east of Chester and is south of the village of Mickle Trafford. The community consists of a church, a primary school, a post office, a pub, a village hall and several local businesses.

Chestler-le-Street District Council elections were generally held every four years between the council's creation in 1974 and its abolition in 2009. Chester-le-Street was a non-metropolitan district in County Durham, England. On 1 April 2009 the council's functions passed to Durham County Council, which became a unitary authority.

<span class="mw-page-title-main">Cheshire County Council</span> Former local authority in England

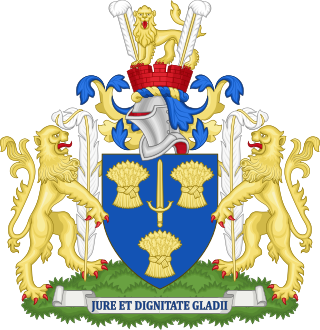
Cheshire County Council was the county council of Cheshire. Founded on 1 April 1889, it was officially dissolved on 31 March 2009, when it and its districts were superseded by two unitary authorities; Cheshire West and Chester and Cheshire East.

<span class="mw-page-title-main">Cheshire West and Chester</span> Borough in England

Cheshire West and Chester is a unitary authority area with borough status in Cheshire, England. It was established on 1 April 2009 as part of the 2009 local government changes, by virtue of an order under the Local Government and Public Involvement in Health Act 2007. It superseded the boroughs of Ellesmere Port and Neston, Vale Royal and the City of Chester; its council assumed the functions and responsibilities of the former Cheshire County Council within its area. The remainder of ceremonial Cheshire is composed of Cheshire East, Halton and Warrington. Cheshire West and Chester has three key urban areas: Chester, Ellesmere Port and Northwich/Winsford.

Cheshire West and Chester Council elections are held every four years. Cheshire West and Chester Council is the local authority for the unitary authority of Cheshire West and Chester in Cheshire, England. Since the last boundary changes in 2019, 70 councillors have been elected from 45 wards.

<span class="mw-page-title-main">Cheshire West and Chester Council</span> UK local government administration unit from 2009

Cheshire West and Chester Council is the local authority for Cheshire West and Chester. It is a unitary authority created on 1 April 2009, succeeding the non-metropolitan districts of Chester City Council, Ellesmere Port and Neston Borough Council, and Vale Royal Borough Council, and the non-metropolitan county of Cheshire County Council. The council was first elected on 1 May 2008, a year before coming into its legal powers on 1 April 2009.

<span class="mw-page-title-main">2015 Cheshire West and Chester Council election</span>

The 2015 Cheshire West and Chester Council election took place on 7 May 2015, electing members of Cheshire West and Chester Council in England. This was on the same day as other local elections across the country as well as the general election.

<span class="mw-page-title-main">2019 Cheshire West and Chester Council election</span>

The 2019 Cheshire West and Chester Council election took place on 2 May 2019 to elect members of Cheshire West and Chester Council in England. This was on the same day as other local elections. Five fewer seats were contested because of boundary changes. No party gained overall control. The Labour Party gained a seat but lost control of the council; the Conservatives lost 8 seats, while the Independents gained 4, the Liberal Democrats gained 2, and the Green Party gained one.

A by-election for the United Kingdom parliamentary constituency of the City of Chester was held on 1 December 2022. It followed the resignation of incumbent member of Parliament Chris Matheson as on 21 October 2022 after accusations of sexual misconduct and a recommendation from the Independent Expert Panel that he be suspended from the House of Commons for four weeks.

<span class="mw-page-title-main">Samantha Dixon</span> British Labour politician

Samantha Kate Dixon is a British politician serving as Member of Parliament (MP) for the City of Chester since 2022. A member of the Labour Party, she was Leader of Cheshire West and Chester Council from 2015 to 2019.

References

  1. "Chester City Council Election Results 1973-2007" (PDF). Colin Rallings & Michael Thrasher. The Elections Centre, Plymouth University . Retrieved 23 March 2024.