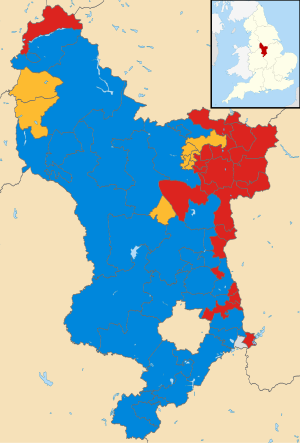
A whole-council election to Lancashire County Council took place on 4 June 2009 as part of the 2009 United Kingdom local elections. The United Kingdom government department Department for Communities and Local Government consulted on the issue of moving the elections to the same date as the 2009 European Parliament election, which resulted in the council elections being postponed to June to coincide. 84 councillors were elected for 84 divisions by first-past-the-post' for a four-year term of office. Wards were the same as those at the previous election in 2005. Elections are held in all electoral divisions across the present ceremonial county, excepting Blackpool, and Blackburn with Darwen which are unitary authorities in a similar way to Greater Manchester and most of Merseyside.

An election to Hertfordshire County Council took place on 4 June 2009 the date of the 2009 United Kingdom local elections. The whole elected council was up for election. The councillors were elected from the 77 wards, which return one each by first-past-the-post voting for a four-year term of office. The wards were the same as those used at the previous election in 2005.

Elections to Buckinghamshire County Council took place on 4 June 2009 as part of the 2009 United Kingdom local elections, having been delayed from 7 May, to coincide with elections to the European Parliament.

The East Sussex County Council election, 2009 took place on 4 June 2009 as part of the 2009 United Kingdom local elections, having been delayed from 7 May, to coincide with elections to the European Parliament. All 49 seats of this council were up for election. The councillors were elected from 44 electoral divisions, which accordingly return one or two by first-past-the-post voting, for a four-year term of office.

Elections to Gloucestershire County Council took place on 4 June 2009 as part of the 2009 United Kingdom local elections, having been delayed from 7 May, to coincide with elections to the European Parliament. All of the Council's 62 seats were up for election. Most divisions returned one County Councillor under the first past the post system which is used for most local government elections in England and Wales. However, some divisions especially those that were based upon towns too small for two divisions but too large for one returned two Councillors using the block vote variant of FPTP used for some English and Welsh local elections.
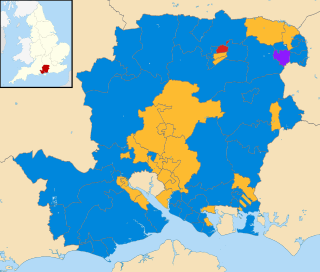
An election to Hampshire County Council took place on 4 June 2009 as part of the 2009 United Kingdom local elections, having been delayed from 7 May, to coincide with elections to the European Parliament. 78 councillors were elected from 75 electoral divisions, which returned either one or two county councillors each by first-past-the-post voting for a four-year term of office. The electoral divisions were the same as those used at the previous election in 2005. Elections in Portsmouth and Southampton do not coincide with this set, being unitary authorities outside the area covered by the County Council.

Elections to Lincolnshire County Council took place on 4 June 2009 as part of the 2009 United Kingdom local elections, having been delayed from 7 May, in order to coincide with elections to the European Parliament. 77 councillors were elected, each electoral division returned either one or two county councillors by first-past-the-post voting for a four-year term of office. The electoral divisions were the same as those used at the previous election in 2005.
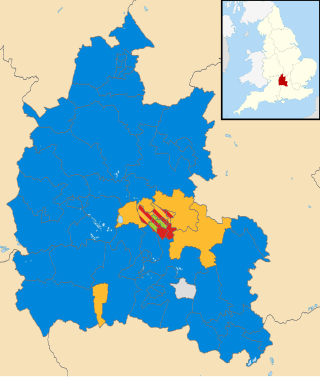
An election to Oxfordshire County Council took place on 4 June 2009 as part of the 2009 United Kingdom local elections, having been delayed from 7 May, to coincide with elections to the European Parliament. 74 councillors were elected from various electoral divisions, which returned either one, two or three county councillors each by first-past-the-post voting for a four-year term of office. The electoral divisions were the same as those used at the previous election in 2005.

An election to Somerset County Council took place on 4 June 2009 as part of the 2009 United Kingdom local elections, having been delayed from 7 May, to coincide with elections to the European Parliament. The result brought to an end 16 years of Liberal Democrat rule to a Conservative controlled administration. 58 councillors were elected from various electoral divisions, which returned one county councillor each. Members were elected by the first-past-the-post voting system for a four-year term of office. This was the last election before the number of seats was cut to 55 for the 2013 election. With a total of 58 seats being reduced to 55 for the next election.

Elections to Staffordshire County Council took place on 4 June 2009 as part of the 2009 United Kingdom local elections, having been delayed from 7 May, in order to coincide with elections to the European Parliament. 62 councillors were elected from the various electoral divisions, which returned either one or two county councillors each by first-past-the-post voting for a four-year term of office. The electoral divisions were the same as those used at the previous election in 2005. The council continues to be administered on the Leader and Cabinet model.

Elections to Surrey County Council took place on 4 June 2009 as part of the 2009 United Kingdom local elections, having been delayed from 7 May in order for the elections to take place alongside those to the European Parliament.
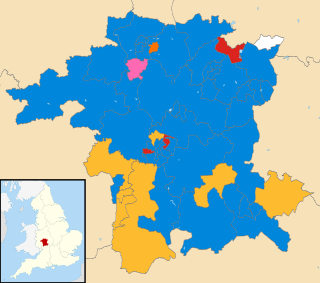
An election to Worcestershire County Council took place on 4 June 2009 as part of the 2009 United Kingdom local elections, alongside the 31 other County Councils, five of which are unitary, and a few other areas. The election had been delayed from 7 May, to coincide with elections to the European Parliament. 57 councillors were elected from 53 wards, which returned either one or two county councillors each by first-past-the-post voting for a four-year term of office. The wards were unchanged from the previous election in 2005. The election saw the Conservative Party retain overall control of the council with a majority of 14 seats, up from a majority of just 2 seats.
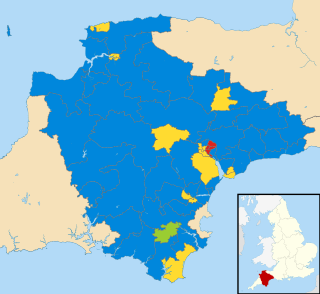
An election to Devon County Council took place on 7 May 2009 as part of the 2009 United Kingdom local elections. The elections had been delayed from 7 May, to coincide with elections to the European Parliament. 62 councillors were elected from various electoral divisions, which returned either one or two county councillors each by first-past-the-post voting for a four-year term of office. The electoral divisions were the same as those used at the previous election in 2005. No elections were held in Plymouth and Torbay, which are unitary authorities outside the area covered by the County Council.

The 2006 Waltham Forest Council elections, were held on 4 May 2006 in Waltham Forest, England. The whole council was up for election for the first time since the 2002 election.

An election to Lancashire County Council took place on 2 May 2013 as part of the United Kingdom local elections, 2013. 84 councillors were elected from single-member electoral divisions by first-past-the-post for a four-year term of office. Electoral divisions were the same as those at the previous election in 2009. Elections were held in all electoral divisions across the present ceremonial county, excepting Blackpool and Blackburn with Darwen which are unitary authorities in a similar way to Greater Manchester and most of Merseyside. The election saw the Conservative Party lose overall control of the council, instead overtaken in number of seats by the Labour Party, without any absolute majority.

An election to North Yorkshire County Council took place on 2 May 2013 as part of the 2013 United Kingdom local elections. 72 councillors were elected from 68 electoral divisions, which returned either one or two county councillors each by first-past-the-post voting for a four-year term of office. The four divisions which elected two members were Harrogate Bilton & Nidd Gorge, Harrogate Central, Knaresborough, and Selby Barlby. Of those seats UKIP won its first ever seats on the council in Bilton and Nidd Gorge. The electoral divisions were the same as those used at the previous election in 2009. The election saw the Conservative Party maintain overall control of the council.

An election to Leicestershire County Council took place on 2 May 2013 as part of the 2013 United Kingdom local elections. 55 councillors were elected from 52 electoral divisions, which returned either one or two county councillors each by first-past-the-post voting for a four-year term of office. The Conservatives held control of the council with a reduced majority of 5 seats. Despite a strong challenge from UKIP, the party only gained 2 seats whilst the Liberal Democrats lost one seat and Labour recouped some of their 2009 losses, gaining 6 seats.
Council elections for the City of Preston, Lancashire were held on 22 May 2014 as part of the 2014 United Kingdom local elections. The elections have been moved from earlier on in May to coincide with the North West component of the 2014 European Parliament election. Nineteen electoral wards were fought with those councillors elected in the corresponding elections in 2010 defending their seats due to the "in thirds" system employed in Preston local elections. The previous elections to Preston council occurred in 2012 but due to the "in thirds" system employed by Preston council, councillors are elected for four-year terms. This means gains, losses, and vote share comparisons this year are with those fought in 2010.

The 2014 Waltham Forest Council election took place on 22 May 2014 to elect members of Waltham Forest Council in England. This was on the same day as other local elections.

An election to Oxfordshire County Council took place on 5 May 2005 as part of the 2005 United Kingdom local elections, coinciding with the 2005 United Kingdom general election. 74 councillors were elected from various electoral divisions, which returned either one, two or three county councillors each by first-past-the-post voting for a four-year term of office. This was the first election using the new electoral divisions following proposals from the Electoral Commission in 2004, meaning the council would consist of three seats more than previously.