1999 Leeds City Council election

Last updated

Map of the results for the 1999 Leeds council election. Leeds UK local election 1999 map.png
Map of the results for the 1999 Leeds council election.

The 1999 Leeds City Council election took place on 6 May 1999 to elect members of City of Leeds Metropolitan Borough Council in West Yorkshire, England. One third of the council was up for election, as well as a vacancy each in Horsforth, Moortown and Wetherby. Prior to the election, the Liberal Democrats had gained a seat in Bramley from Labour, and Hunslet councillor, Mark Davies, had defected from Labour to Independent Socialist.

Contents

Labour stayed in overall control of the council. [1] Overall turnout in the election was 27.3%. [2]

Election result

Leeds Local Election Result 1999 [2] [3]
PartySeatsGainsLossesNet gain/lossSeats %Votes %Votes+/−
  Labour 2107-758.346.167,734-3.2%
  Liberal Democrats 940+425.022.232,644+2.5%
  Conservative 530+313.927.640,585-0.2%
  Green 10002.83.65,227+1.3%
  Leeds Left Alliance 000000.4522+0.1%
  Independent 000000.1163-0.4%
 Seacroft Community Party000000.196+0.1%

This result had the following consequences for the total number of seats on the council after the elections: [4]

PartyPrevious councilNew council
Labour7871
Liberal Democrat1014
Conservative912
Green11
Independent Socialist11
Total9999
Working majority 57  43 

Ward results

Aireborough [2]
PartyCandidateVotes%±%
Labour Michael Dunn2,91943.6-3.1
Conservative Graham Latty2,71940.6+4.1
Liberal Democrats Ian Hutton1,05515.8-1.0
Majority2003.0-7.2
Turnout 6,69333.8+2.8
Labour hold Swing -3.6
Armley [2]
PartyCandidateVotes%±%
Labour Janet Harper2,03261.1-1.5
Conservative Glenn Broadbent55816.8+0.7
Liberal Democrats Andrew Davies51615.5-1.3
Green Yvonne Clarke2186.6+6.6
Majority1,47444.3-1.5
Turnout 3,32420.9+2.4
Labour hold Swing -1.1
Barwick & Kippax [2]
PartyCandidateVotes%±%
Labour Marian Monks3,59260.8-0.9
Conservative Jack Stott1,59226.9+1.0
Liberal Democrats Natasha De Vere72512.3-0.1
Majority2,00033.9-1.9
Turnout 5,90932.9+5.1
Labour hold Swing -0.9
Beeston [2]
PartyCandidateVotes%±%
Labour Adam Ogilvie1,51556.7+1.5
Conservative William Birch75128.1+8.2
Liberal Democrats Shaun Dolan40515.2-4.1
Majority76428.6-6.7
Turnout 2,67121.5+1.8
Labour hold Swing -3.3
Bramley [2]
PartyCandidateVotes%±%
Liberal Democrats Ian Howell1,58747.6+32.1
Labour Stephen Simpson1,49344.7-24.6
Conservative Michael Best2577.7-7.5
Majority942.8-51.0
Turnout 3,33720.3+4.0
Liberal Democrats gain from Labour Swing +28.3
Burmantofts [2]
PartyCandidateVotes%±%
Labour Tina Davy1,85967.3-1.8
Liberal Democrats Margaret Betteridge52218.9-4.0
Conservative Jean Higham2318.4+0.4
Leeds Left Alliance Malcolm Christie1505.4+5.4
Majority1,33748.4+2.2
Turnout 2,76221.0+1.5
Labour hold Swing +1.1
Chapel Allerton [2]
PartyCandidateVotes%±%
Labour Norma Hutchinson2,34759.2-9.7
Conservative Arshad Ali85321.5+3.9
Liberal Democrats Rochelle Harris50512.7-0.8
Green Martin Reed2596.5+6.5
Majority1,49437.7-13.6
Turnout 3,96426.9+6.0
Labour hold Swing -6.8
City & Holbeck [2]
PartyCandidateVotes%±%
Labour Mohammed Iqbal1,74461.2-5.1
Conservative Stephen McBarron41314.5+1.9
Liberal Democrats Ann Norman41714.6+4.5
Leeds Left Alliance (Socialist Alternative)David Jones1615.6-1.7
Green Colin Johnston1164.1+0.4
Majority1,32746.5-7.2
Turnout 2,85119.2+2.0
Labour hold Swing -3.5
Cookridge [2]
PartyCandidateVotes%±%
Conservative Barry Anderson2,88851.6-2.8
Labour John Garvani1,68830.2+1.5
Liberal Democrats Darren Finlay87515.6-1.3
Green Paul Marchant1472.6+2.6
Majority1,20021.4-4.3
Turnout 5,59833.4+2.2
Conservative gain from Labour Swing -2.1
Garforth & Swillington [2]
PartyCandidateVotes%±%
Labour Alan Groves3,26961.4-1.9
Conservative Alan Lamb1,28324.1+1.5
Liberal Democrats Ian Dowling77614.6+0.5
Majority1,98637.3-3.4
Turnout 5,32828.5+2.4
Labour hold Swing -1.7
Halton [2]
PartyCandidateVotes%±%
Labour Doris McGee2,26244.9-1.4
Conservative David Schofield2,11241.9+1.6
Liberal Democrats David Hollingsworth66613.2-0.2
Majority1503.0-3.0
Turnout 5,04028.0+2.7
Labour hold Swing -1.5
Harehills [2]
PartyCandidateVotes%±%
Liberal Democrats Alan Taylor2,39551.4+28.5
Labour John Clare2,08344.7-16.0
Conservative Donald Townsley1783.8-5.5
Majority3126.7-31.1
Turnout 4,65633.0+13.0
Liberal Democrats gain from Labour Swing +22.2
Headingley [2]
PartyCandidateVotes%±%
Liberal Democrats David Pratt1,80144.0+20.2
Labour Paul Moxon1,57338.4-10.3
Green Lesley Jeffries3919.6-1.4
Conservative Thomas McMeeking3288.0-8.5
Majority2285.6-19.2
Turnout 4,09320.0+7.5
Liberal Democrats gain from Labour Swing +15.2
Horsforth [2]
PartyCandidateVotes%±%
Liberal Democrats Brian Cleasby2,69446.6+0.5
Liberal Democrats Thomas Nossiter 2,510
Conservative John Hardcastle1,54126.7-0.8
Conservative Sheila Jackson1,414
Labour Edmund Hanley1,28722.3-0.5
Labour David Marsh1,273
Green Irene Dracup2544.4+2.5
Majority96920.0+1.3
Turnout 5,77633.3+1.7
Liberal Democrats hold Swing
Liberal Democrats hold Swing +0.6
Hunslet [2]
PartyCandidateVotes%±%
Labour John Erskine1,58675.6-2.6
Conservative Anthony Larvin23311.1+1.7
Liberal Democrats Christine Glover22210.6+2.1
Green Charles Price582.8-1.1
Majority1,35364.5-4.3
Turnout 2,09918.6+1.4
Labour hold Swing -2.1
Kirkstall [2]
PartyCandidateVotes%±%
Labour John Illingworth2,24666.7-0.5
Conservative David Higgott46013.7-0.9
Liberal Democrats Barbara Thompson39911.9+1.0
Green Janet Pritchard2607.7+0.4
Majority1,78653.0+0.4
Turnout 3,36521.7+3.1
Labour hold Swing +0.2
Middleton [2]
PartyCandidateVotes%±%
Labour Stuart Bruce1,84865.3-8.9
Conservative Susan Nicholls61721.8+8.1
Liberal Democrats Pauline Davies36612.9+0.8
Majority1,23143.5-17.0
Turnout 2,83119.7+1.3
Labour hold Swing -8.5
Moortown [2]
PartyCandidateVotes%±%
Liberal Democrats Christine Brett2,57648.6+0.5
Liberal Democrats Brenda Lancaster2,286
Labour Leonard Fineberg1,68931.9-1.8
Labour Sheila Saunders1,589
Conservative Valerie Kendall1,03019.5+1.2
Conservative William Hyde992
Majority59716.8+2.4
Turnout 5,29534.7+3.0
Liberal Democrats hold Swing
Liberal Democrats hold Swing +1.1
Morley North [2]
PartyCandidateVotes%±%
Labour Philip Jones2,58255.1+1.3
Conservative Robert Tesseyman1,42430.4+0.4
Liberal Democrats Christine Golton50410.8+1.3
Green Andrea Binns1743.7+3.7
Majority1,15824.7+0.9
Turnout 4,68425.0+2.0
Labour hold Swing +0.4
Morley South [2]
PartyCandidateVotes%±%
Labour Raymond Mitchell2,46059.2-2.8
Conservative Robert Allen1,06325.6+0.8
Liberal Democrats Dorothy Harris62915.1+2.0
Majority1,39733.6-3.6
Turnout 4,15219.3+0.9
Labour hold Swing -1.8
North [2]
PartyCandidateVotes%±%
Conservative Ruth Feldman2,31541.5+3.4
Liberal Democrats Andrew Bell1,84133.0-2.1
Labour John Sully1,41725.4-1.4
Majority4748.5+5.5
Turnout 5,57332.8-0.1
Conservative gain from Labour Swing +2.7
Otley & Wharfedale [2]
PartyCandidateVotes%±%
Liberal Democrats Graham Kirkland3,00040.9+9.2
Conservative Christine Smith2,42133.0-0.6
Labour Ruth Blackwell1,91826.1-8.6
Majority5797.9+6.8
Turnout 7,33938.7+4.1
Liberal Democrats hold Swing +4.9
Pudsey North [2]
PartyCandidateVotes%±%
Conservative Amanda Carter3,47554.6+8.4
Labour Thomas Spamer2,23035.1-8.3
Liberal Democrats Jim Souper65610.3-0.1
Majority2,24519.5+16.7
Turnout 6,36135.6+3.2
Conservative gain from Labour Swing +8.3
Pudsey South [2]
PartyCandidateVotes%±%
Labour Josephine Jarosz2,21951.4-3.7
Conservative Audrey Smith1,58936.8+11.5
Liberal Democrats Pauline Bardon3598.3-9.1
Green Graham Illingworth1503.5+1.3
Majority63014.6-15.1
Turnout 4,31726.5+2.2
Labour hold Swing -7.6
Richmond Hill [2]
PartyCandidateVotes%±%
Labour Marlene Lyons1,76975.2-2.2
Liberal Democrats Keith Norman34914.8+0.8
Conservative David Boynton23510.0+1.4
Majority1,42060.4-3.0
Turnout 2,35318.6+2.5
Labour hold Swing -1.5
Rothwell [2]
PartyCandidateVotes%±%
Labour Brian Walker2,18157.0-3.2
Liberal Democrats Mitchell Galdas94224.6+5.1
Conservative John Cowling70518.4-1.9
Majority1,23932.4-7.5
Turnout 3,82824.6+2.3
Labour hold Swing -4.1
Roundhay [2]
PartyCandidateVotes%±%
Labour Michael Fox2,66645.2+8.4
Conservative Ann Castle2,39140.5-3.1
Liberal Democrats Ann Skinner84114.3-5.3
Majority2754.7-2.1
Turnout 5,89835.6+4.1
Labour hold Swing +5.7
Seacroft [2]
PartyCandidateVotes%±%
Labour Brian Selby2,04277.7+2.3
Conservative Roy Jones2348.9-1.4
Liberal Democrats Sadie Fisher1686.4-1.0
Seacroft Community PartyRaymond Northgreaves963.7-1.1
Green Michael Bolton873.3+1.2
Majority1,80868.8+3.7
Turnout 2,62721.5+0.1
Labour hold Swing +1.8
University [2]
PartyCandidateVotes%±%
Labour Gerald Harper1,46155.6-7.4
Liberal Democrats Kathleen Tebbutt64524.5+10.8
Conservative Robert Winfield2278.6-1.7
Green Paul Eade1736.6+0.4
Leeds Left Alliance (Socialist Alternative)Christopher Hill1224.6-2.3
Majority81631.1-18.2
Turnout 2,62816.7+3.8
Labour hold Swing -9.1
Weetwood [2]
PartyCandidateVotes%±%
Liberal Democrats Brian Jennings2,26639.6-0.5
Labour Eileen Moxon2,24139.2+3.5
Conservative Graham Castle95416.7-4.4
Green David Webb2614.6+1.5
Majority250.4-4.0
Turnout 5,72235.0+0.9
Liberal Democrats gain from Labour Swing -2.0
Wetherby [2]
PartyCandidateVotes%±%
Conservative David Hudson4,32757.9-4.3
Conservative Gerald Wilkinson4,257
Labour Reginald Steel1,88325.2-3.2
Labour Pauline Birch1,519
Liberal Democrats Michael Welby1,26516.9+7.4
Majority2,37432.7-1.1
Turnout 7,47536.0+5.2
Conservative hold Swing
Conservative hold Swing -0.5
Whinmoor [2]
PartyCandidateVotes%±%
Labour Peter Gruen1,88654.2-3.9
Conservative Richard Williams1,02129.4-0.8
Liberal Democrats Graham Roberts3199.2-2.6
Independent Anthony Thorpe1634.7+4.7
Leeds Left Alliance Amanda Munro892.6+2.6
Majority1,56724.8-3.1
Turnout 3,47825.5+4.8
Labour hold Swing -1.5
Wortley [2]
PartyCandidateVotes%±%
Green David Blackburn2,67954.2+14.9
Labour Daphne Riley1,74735.3-7.1
Liberal Democrats Richard Cutress3587.2+0.5
Conservative Ruby Patel1603.2-8.3
Majority93218.9+15.8
Turnout 4,94429.1+4.6
Green hold Swing +11.0

By-elections between 1999 and 2000

Harehills by-election 13 April 2000 [5]
PartyCandidateVotes%±%
Liberal Democrats Javaid Akhtar2,23650.9-0.5
Labour John Clare2,00245.6+0.9
Conservative Donald Townsley1252.8-1.0
Leeds Left Alliance Jane Young260.6+0.6
Majority2345.3-1.4
Turnout 4,38931.5-1.5
Liberal Democrats gain from Labour Swing -0.7

Related Research Articles

<span class="mw-page-title-main">Leeds City Council</span> Local government body in England

Leeds City Council is the local authority of the City of Leeds in West Yorkshire, England. It is a metropolitan district council, one of five in West Yorkshire and one of 36 in the metropolitan counties of England, and provides the majority of local government services in Leeds. It has the second-largest population of any council in the United Kingdom with approximately 800,000 inhabitants living within its area; only Birmingham City Council has more. Since 1 April 2014, it has been a constituent council of the West Yorkshire Combined Authority.

<span class="mw-page-title-main">1998 Leeds City Council election</span>

The 1998 Leeds City Council election took place on 7 May 1998 to elect members of City of Leeds Metropolitan Borough Council in West Yorkshire, England. One third of the council, alongside a vacancy in Wortley were up for election.

<span class="mw-page-title-main">2000 Leeds City Council election</span>

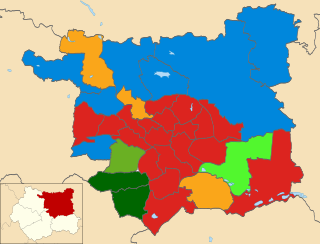
The Leeds City Council election took place on 4 May 2000 to elect members of City of Leeds Metropolitan Borough Council in West Yorkshire, England. Since the last election, Labour had lost a by-election to the Lib Dems in Harehills, and long-serving Chapel Allerton councillor, Garth Frankland, had defected from Labour to Left Alliance. One third of the council was up for election and the Labour party stayed in overall control of the council. Overall turnout in the election was 27.5%.

<span class="mw-page-title-main">2002 Leeds City Council election</span>

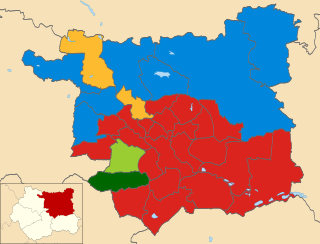
The Leeds City Council election took place on 2 May 2002 to elect members of City of Leeds Metropolitan Borough Council in West Yorkshire, England. Prior to the election, there had been several by-elections held with no change to the council composition. One third of the council was up for election and the Labour party stayed in overall control of the council.

<span class="mw-page-title-main">2011 Leeds City Council election</span>

The 2011 Leeds City Council election took place on Thursday 5 May 2011 to elect members of Leeds City Council in England. It was held on the same day as other local elections across the UK.

<span class="mw-page-title-main">2010 Leeds City Council election</span>

The 2010 Leeds City Council election took place on Thursday 6 May 2010 to elect members of Leeds City Council in England. It was held on the same day as the 2010 general election and other local elections across the UK.

<span class="mw-page-title-main">2008 Leeds City Council election</span>

The 2008 Leeds City Council election took place on Thursday 1 May 2008 to elect members of Leeds City Council in England.

<span class="mw-page-title-main">2007 Leeds City Council election</span>

The 2007 Leeds City Council election took place on Thursday 3 May 2007 to elect members of Leeds City Council in England.

<span class="mw-page-title-main">2014 Leeds City Council election</span>

The 2014 Leeds City Council election took place on Thursday 22 May 2014 to elect members of Leeds City Council in England. It was held on the same day as the 2014 European Parliament election and other local elections across the UK.

<span class="mw-page-title-main">2015 Leeds City Council election</span>

The 2015 Leeds City Council election took place on Thursday 7 May 2015 to elect members of Leeds City Council in England. It was held on the same day as the 2015 general election and other local elections across the UK.

<span class="mw-page-title-main">2016 Leeds City Council election</span>

The 2016 Leeds City Council election took place on Thursday 5 May 2016 to elect members of Leeds City Council in England. It was on the same day as other local elections.

<span class="mw-page-title-main">2018 Leeds City Council election</span>

The 2018 Leeds City Council election took place on Thursday 3 May 2018 to elect members of Leeds City Council in England. It was held on the same day as other UK local elections across England.

<span class="mw-page-title-main">Hunslet and Riverside (ward)</span> Electoral ward in Leeds, England

Hunslet and Riverside is an electoral ward of Leeds City Council in Leeds, West Yorkshire, largely covering the inner city area of Hunslet to the south of the city centre. It was created in advance of the 2018 council election.

The Morley Borough Independents (MBI) are a local political party in Leeds, West Yorkshire, founded in 2004.

<span class="mw-page-title-main">2019 Leeds City Council election</span>

The 2019 Leeds City Council election took place on Thursday 2 May 2019 to elect members of Leeds City Council in England. It was held on the same day as other UK local elections across England and Northern Ireland.

<span class="mw-page-title-main">2021 Leeds City Council election</span>

The 2021 Leeds City Council election took place on Thursday 6 May 2021 to elect members of Leeds City Council in England. It was held on the same day as other local elections across England and the rest of the UK, including the inaugural West Yorkshire mayoral election.

<span class="mw-page-title-main">2022 United Kingdom local elections</span> Elections to local councils and mayoralties

The 2022 United Kingdom local elections took place on Thursday 5 May 2022. These included elections for all London borough councils, for all local authorities in Wales and Scotland. Most seats in England were last up for election in 2018 and in Scotland and Wales in 2017. The elections coincided with the 2022 Northern Ireland Assembly election. In 91 cases, most of them in Wales, council seats were uncontested, each having only one candidate. Three seats in Scotland remained unfilled as no one nominated to fill them.

<span class="mw-page-title-main">2022 Leeds City Council election</span>

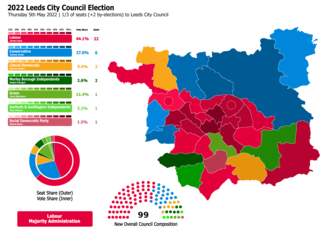
The 2022 Leeds City Council election took place on Thursday 5 May 2022 to elect members of Leeds City Council in England. It was held on the same day as other local elections across the United Kingdom.

The 2022 Oldham Metropolitan Borough Council election took place on 5 May 2022. One third—20 out of 60—of councillors on Oldham Council was elected. The election took place alongside other local elections across the United Kingdom.

References

  1. "Leeds". BBC News Online . Retrieved 6 August 2018.
  2. 1 2 3 4 5 6 7 8 9 10 11 12 13 14 15 16 17 18 19 20 21 22 23 24 25 26 27 28 29 30 31 32 33 34 35 "Election of Councillors : 6th May 1999". leeds.gov.uk. Archived from the original on 2 October 1999. Retrieved 6 August 2018.
  3. "Local Councils: Results round-up". The Times . 7 May 1999. p. 4. ISSN   0140-0460.
  4. "Britain votes: Local Council Election Results". The Independent . 7 May 1999. p. 12. ISSN   0951-9467.
  5. "Harehills By-Election 13th April 2000". leeds.gov.uk. Archived from the original on 11 May 2000. Retrieved 6 August 2018.