| ||||||||||||||||||||||||||||||||||||||||
All 68 seats to Aberdeenshire Council 35 seats needed for a majority | ||||||||||||||||||||||||||||||||||||||||
---|---|---|---|---|---|---|---|---|---|---|---|---|---|---|---|---|---|---|---|---|---|---|---|---|---|---|---|---|---|---|---|---|---|---|---|---|---|---|---|---|
| ||||||||||||||||||||||||||||||||||||||||
|
Elections to Aberdeenshire Council were held on 6 May 1999; the same day as elections to the Scottish Parliament and to the 31 other Scottish local authorities. 68 councillors were elected from 68 wards using First Past The Post (FPTP). This election was conducted under boundary changes with an increased number of seats from the 47 used in the 1995 election. The Liberal Democrats were the largest party, with councillors also being elected representing the SNP, Independents, and Conservatives.
Party | Seats | Gains | Losses | Net gain/loss | Seats % | Votes % | Votes | +/− | |
---|---|---|---|---|---|---|---|---|---|
Liberal Democrats | 28 | 15 | 47.2 | 32.8 | 29,908 | 9.2 | |||
SNP | 23 | 8 | 33.8 | 29.4 | 26,848 | 3.7 | |||
Independent | 10 | 3 | 14.7 | 14.3 | 13,036 | 11.5 | |||
Conservative | 7 | 3 | 10.3 | 18.4 | 16,795 | 7.6 | |||
Labour | 0 | 0.0 | 5.0 | 4,579 | 1.3 | ||||
Green Independent | 0 | 0.0 | 0.1 | 80 | 0.1 |
Party | Candidate | Votes | % | ||
---|---|---|---|---|---|
SNP | S Taylor | 817 | 57 | ||
Liberal Democrats | J Mair | 617 | 43 | ||
Majority | 202 | 14 | |||
Turnout | 1436 | 62 | |||
SNP win (new seat) |
Party | Candidate | Votes | % | ||
---|---|---|---|---|---|
SNP | J McKee | 618 | 45.8 | ||
Independent | R Cumming | 296 | 22 | ||
Independent | T Chalmers | 227 | 16.8 | ||
Liberal Democrats | H Mair | 207 | 15.4 | ||
Majority | 322 | 23.8 | |||
Turnout | 1348 | 59.1 | |||
SNP win (new seat) |
Party | Candidate | Votes | % | ||
---|---|---|---|---|---|
SNP | J Cox | 987 | 72.8 | ||
Liberal Democrats | S Barett | 187 | 13.8 | ||
Conservative | C Sutherland | 181 | 13.4 | ||
Majority | 800 | 59 | |||
Turnout | 1,355 | 57.9 | |||
SNP win (new seat) |
Party | Candidate | Votes | % | ||
---|---|---|---|---|---|
SNP | K Benzie | 491 | 41.3 | ||
Independent | C Bruce | 423 | 35.6 | ||
Liberal Democrats | D Ward | 274 | 23.1 | ||
Majority | 68 | 5.7 | |||
Turnout | 1,188 | 51.5 | |||
SNP win (new seat) |
Party | Candidate | Votes | % | ||
---|---|---|---|---|---|
SNP | S Mair | 948 | 80.3 | ||
Liberal Democrats | S Ritchie | 233 | 19.7 | ||
Majority | 715 | 60.6 | |||
Turnout | 1,181 | 50.7 | |||
SNP win (new seat) |
Party | Candidate | Votes | % | ||
---|---|---|---|---|---|
SNP | A Buchan | 537 | 45.2 | ||
Independent | J Duncan | 530 | 44.7 | ||
Liberal Democrats | E Murphy | 120 | 10.1 | ||
Majority | 7 | 0.5 | |||
Turnout | 1,187 | 58.3 | |||
SNP win (new seat) |
Party | Candidate | Votes | % | ||
---|---|---|---|---|---|
SNP | M Burnett | 784 | 57.6 | ||
Independent | M Rennie | 409 | 30.1 | ||
Liberal Democrats | J Murphy | 167 | 12.3 | ||
Majority | 375 | 27.5 | |||
Turnout | 1,360 | 58.3 | |||
SNP win (new seat) |
Party | Candidate | Votes | % | ||
---|---|---|---|---|---|
SNP | B Topping | unopposed | |||
SNP win (new seat) |
Party | Candidate | Votes | % | ||
---|---|---|---|---|---|
SNP | D Duguid | 887 | 70.6 | ||
Independent | J Milne | 370 | 29.4 | ||
Majority | 517 | 41.2 | |||
Turnout | 1,257 | 52.3 | |||
SNP win (new seat) |
Party | Candidate | Votes | % | ||
---|---|---|---|---|---|
SNP | I Tait | 931 | 72.3 | ||
Liberal Democrats | P MacKie | 357 | 27.7 | ||
Majority | 574 | 44.6 | |||
Turnout | 1,288 | 52.6 | |||
SNP win (new seat) |
Party | Candidate | Votes | % | ||
---|---|---|---|---|---|
Independent | H Fowler | 757 | 56.5 | ||
SNP | A Ramsay | 584 | 43.5 | ||
Majority | 173 | 13 | |||
Turnout | 1,341 | 54.6 | |||
Independent win (new seat) |
Party | Candidate | Votes | % | ||
---|---|---|---|---|---|
SNP | M McRae | unopposed | |||
SNP win (new seat) |
Party | Candidate | Votes | % | ||
---|---|---|---|---|---|
SNP | N Thomson | 417 | 31.2 | ||
Independent | R Chapman | 338 | 25.3 | ||
Liberal Democrats | D Smith | 308 | 23.1 | ||
Independent | J Conn | 165 | 12.4 | ||
Labour | C Donald | 108 | 8.1 | ||
Majority | 79 | 5.9 | |||
Turnout | 1,336 | 55 | |||
SNP win (new seat) |
Party | Candidate | Votes | % | ||
---|---|---|---|---|---|
SNP | S Tennant | 776 | 51.9 | ||
Conservative | R Thomas | 447 | 29.9 | ||
Liberal Democrats | V Duncan | 272 | 18.2 | ||
Majority | 329 | 22 | |||
Turnout | 1,495 | 57.9 | |||
SNP win (new seat) |
Party | Candidate | Votes | % | ||
---|---|---|---|---|---|
Independent | N Cowie | 1,015 | 61.6 | ||
SNP | P MacKie | 519 | 31.5 | ||
Liberal Democrats | J Michie | 115 | 7.0 | ||
Majority | 496 | 30.1 | |||
Turnout | 1,649 | 68 | |||
Independent win (new seat) |
Party | Candidate | Votes | % | ||
---|---|---|---|---|---|
SNP | D McHugh | 521 | 38.7 | ||
Independent | A Howie | 329 | 24.4 | ||
Liberal Democrats | W Cruickshank | 314 | 23.3 | ||
Conservative | G Walker | 182 | 13.5 | ||
Majority | 192 | 14.3 | |||
Turnout | 1,346 | 59.6 | |||
SNP win (new seat) |
Party | Candidate | Votes | % | ||
---|---|---|---|---|---|
SNP | A MacLeod | 513 | 36.7 | ||
Conservative | I Sutherland | 449 | 436 | ||
Liberal Democrats | J Murison | 436 | 31.2 | ||
Majority | 64 | 4.6 | |||
Turnout | 1,398 | 59.6 | |||
SNP win (new seat) |
Party | Candidate | Votes | % | ||
---|---|---|---|---|---|
Liberal Democrats | S Couli | 829 | 61.7 | ||
SNP | R Broughall | 515 | 38.3 | ||
Majority | 314 | 23.4 | |||
Turnout | 1,344 | 50.6 | |||
Liberal Democrats win (new seat) |
Party | Candidate | Votes | % | ||
---|---|---|---|---|---|
SNP | A Fowler | 853 | 66.1 | ||
Conservative | W Kenny | 438 | 33.9 | ||
Majority | 415 | 32.2 | |||
Turnout | 1,291 | 48.2 | |||
SNP win (new seat) |
Party | Candidate | Votes | % | ||
---|---|---|---|---|---|
SNP | A Strachan | unopposed | |||
SNP win (new seat) |
Party | Candidate | Votes | % | ||
---|---|---|---|---|---|
SNP | G Barnes | unopposed | |||
SNP win (new seat) |
Party | Candidate | Votes | % | ||
---|---|---|---|---|---|
SNP | J Davidson | unopposed | |||
SNP win (new seat) |
Party | Candidate | Votes | % | ||
---|---|---|---|---|---|
SNP | S Pratt | 938 | 75.7 | ||
Liberal Democrats | P Morris | 301 | 24.3 | ||
Majority | 637 | 51.4 | |||
Turnout | 1,239 | 51.3 | |||
SNP win (new seat) |
Party | Candidate | Votes | % | ||
---|---|---|---|---|---|
SNP | J Towers | 851 | 60.1 | ||
Conservative | M Cantlay | 381 | 26.9 | ||
Liberal Democrats | D Mackie | 185 | 13.1 | ||
Majority | 470 | 33.2 | |||
Turnout | 1,417 | 61.5 | |||
SNP win (new seat) |
Party | Candidate | Votes | % | ||
---|---|---|---|---|---|
Independent | S B Mair | 645 | 54.1 | ||
SNP | A Dillon | 250 | 21 | ||
Liberal Democrats | M Daley | 157 | 13.2 | ||
Conservative | R Grogan | 79 | 6.6 | ||
Labour | C Morrison | 62 | 5.2 | ||
Majority | 395 | 32.1 | |||
Turnout | 1,193 | 47.9 | |||
Independent win (new seat) |
Party | Candidate | Votes | % | ||
---|---|---|---|---|---|
Independent | A Norrie | 395 | 39.2 | ||
Liberal Democrats | A Carmichael | 305 | 30.3 | ||
SNP | M Shaw | 225 | 22.3 | ||
Conservative | D Churcher | 83 | 8.2 | ||
Majority | 90 | 8.9 | |||
Turnout | 1,008 | 49.1 | |||
Independent win (new seat) |
Party | Candidate | Votes | % | ||
---|---|---|---|---|---|
Independent | H Cormack | 416 | 34.6 | ||
Liberal Democrats | J Picken | 279 | 23.2 | ||
SNP | A Will | 246 | 20.4 | ||
Conservative | A Jiggens | 14.8 | 178 | ||
Labour | A McLean-Bullen | 84 | 7 | ||
Majority | 137 | 11.4 | |||
Turnout | 1,203 | 53.9 | |||
Independent win (new seat) |
Party | Candidate | Votes | % | ||
---|---|---|---|---|---|
Liberal Democrats | E A Robertson | 788 | 57.9 | ||
Conservative | R Fenton | 302 | 22.2 | ||
SNP | F Hall | 178 | 13.1 | ||
Labour | W McConnach | 94 | 6.9 | ||
Majority | 486 | 35.7 | |||
Turnout | 1,362 | 58.7 | |||
Liberal Democrats win (new seat) |
Party | Candidate | Votes | % | ||
---|---|---|---|---|---|
Liberal Democrats | P Johnston | 760 | 44.8 | ||
Conservative | R McIntyre | 459 | 27 | ||
SNP | F Nicholson | 340 | 20 | ||
Labour | S Thomson | 139 | 8.2 | ||
Majority | 301 | 17.8 | |||
Turnout | 1,698 | 60.3 | |||
Liberal Democrats win (new seat) |
Party | Candidate | Votes | % | ||
---|---|---|---|---|---|
Liberal Democrats | A McInnes | 796 | 48 | ||
SNP | R Duncan | 512 | 30.9 | ||
Conservative | C Wolrige-Gordon | 232 | 14 | ||
Labour | S Osprey | 118 | 7.1 | ||
Majority | 284 | 17.1 | |||
Turnout | 1,658 | 58.2 | |||
Liberal Democrats win (new seat) |
Party | Candidate | Votes | % | ||
---|---|---|---|---|---|
SNP | A Cameron | 478 | 35.1 | ||
Liberal Democrats | J Bowie | 442 | 32.5 | ||
Conservative | M Kinnaird | 276 | 20.3 | ||
Labour | L Stevenson | 165 | 12.1 | ||
Majority | 36 | 2.6 | |||
Turnout | 1,361 | 56.7 | |||
SNP win (new seat) |
Party | Candidate | Votes | % | ||
---|---|---|---|---|---|
Liberal Democrats | J Anderson | 834 | 51.2 | ||
SNP | R Kemp | 616 | 37.8 | ||
Labour | J Osprey | 178 | 10.9 | ||
Majority | 218 | 13.4 | |||
Turnout | 1,628 | 56.5 | |||
Liberal Democrats win (new seat) |
Party | Candidate | Votes | % | ||
---|---|---|---|---|---|
Liberal Democrats | J Loveday | 651 | 421 | ||
Conservative | P Sleigh | 486 | 31.4 | ||
SNP | G Ingram | 300 | 19.4 | ||
Labour | W Tuckwood | 111 | 7.2 | ||
Majority | 165 | 10.7 | |||
Turnout | 1,548 | 60.3 | |||
Liberal Democrats win (new seat) |
Party | Candidate | Votes | % | ||
---|---|---|---|---|---|
Liberal Democrats | J Sheridan | 765 | 49.2 | ||
SNP | J Daly | 313 | 20.1 | ||
Conservative | J Gifford | 286 | 18.4 | ||
Labour | R Kelly | 190 | 12.2 | ||
Majority | 452 | 29.1 | |||
Turnout | 1,554 | 57.3 | |||
Liberal Democrats win (new seat) |
Party | Candidate | Votes | % | ||
---|---|---|---|---|---|
Liberal Democrats | D Storr | 635 | 43.6 | ||
SNP | J MacAskill | 357 | 24.5 | ||
Conservative | D Costin | 262 | 18 | ||
Labour | M Carr | 202 | 13.9 | ||
Majority | 278 | 19.1 | |||
Turnout | 1,456 | 55 | |||
Liberal Democrats win (new seat) |
Party | Candidate | Votes | % | ||
---|---|---|---|---|---|
Liberal Democrats | S Lonchay | 756 | 50.4 | ||
Conservative | T Reed | 265 | 17.7 | ||
SNP | B Fielding-Browne | 232 | 15.5 | ||
Independent | L Tock | 125 | 8.3 | ||
Labour | R Winchester | 121 | 8.1 | ||
Majority | 491 | 32.7 | |||
Turnout | 1,499 | 54.3 | |||
Liberal Democrats win (new seat) |
Party | Candidate | Votes | % | ||
---|---|---|---|---|---|
Liberal Democrats | C Millar | 578 | 39.9 | ||
Independent | A Marr | 346 | 23.9 | ||
SNP | D Gorman | 189 | 13.1 | ||
Labour | J Cameron | 179 | 12.4 | ||
Conservative | M Hencken | 155 | 10.7 | ||
Majority | 232 | 16 | |||
Turnout | 1,447 | 62.3 | |||
Liberal Democrats win (new seat) |
Party | Candidate | Votes | % | ||
---|---|---|---|---|---|
Liberal Democrats | M Raeburn | 536 | 41.5 | ||
SNP | A McDiarmid | 270 | 20.9 | ||
Labour | E Thorpe | 243 | 18.8 | ||
Conservative | R Cowling | 243 | 18.8 | ||
Majority | 266 | 20.6 | |||
Turnout | 1,292 | 54.3 | |||
Liberal Democrats win (new seat) |
Party | Candidate | Votes | % | ||
---|---|---|---|---|---|
Liberal Democrats | H Bisset | 933 | 62.2 | ||
SNP | R Reid | 213 | 14.2 | ||
Labour | A Thorpe | 200 | 13.3 | ||
Conservative | L Johnstone | 155 | 10.3 | ||
Majority | 720 | 58 | |||
Turnout | 1,501 | 58.1 | |||
Liberal Democrats win (new seat) |
Party | Candidate | Votes | % | ||
---|---|---|---|---|---|
Liberal Democrats | R Bisset | 912 | 59.4 | ||
SNP | A Blackett | 276 | 18 | ||
Conservative | D Stewart | 174 | 11.3 | ||
Labour | B Begg | 173 | 11.3 | ||
Majority | 636 | 41.1 | |||
Turnout | 1,535 | 56.3 | |||
Liberal Democrats win (new seat) |
Party | Candidate | Votes | % | ||
---|---|---|---|---|---|
Conservative | D Cameron | 606 | 37.1 | ||
Liberal Democrats | C Copeland | 565 | 34.6 | ||
SNP | A Wilson | 309 | 18.9 | ||
Labour | R Knowles | 154 | 9.4 | ||
Majority | 41 | 2.7 | |||
Turnout | 1,634 | 61.8 | |||
Conservative win (new seat) |
Party | Candidate | Votes | % | ||
---|---|---|---|---|---|
Liberal Democrats | M Ford | 573 | 39.2 | ||
SNP | A Allan | 326 | 22.3 | ||
Independent | F Hood | 276 | 18.9 | ||
Conservative | A Bell | 174 | 11.9 | ||
Labour | C Schenk | 112 | 7.7 | ||
Majority | 247 | 16.9 | |||
Turnout | 1,461 | 58.8 | |||
Liberal Democrats win (new seat) |
Party | Candidate | Votes | % | ||
---|---|---|---|---|---|
Liberal Democrats | A Leitch | 708 | 54.5 | ||
SNP | G Paterson | 398 | 30.6 | ||
Conservative | I Wakley | 194 | 14.9 | ||
Majority | 310 | 23.9 | |||
Turnout | 1,300 | 51.6 | |||
Liberal Democrats win (new seat) |
Party | Candidate | Votes | % | ||
---|---|---|---|---|---|
Liberal Democrats | G Saluja | 703 | 45.4 | ||
Conservative | W Leslie | 329 | 21.5 | ||
SNP | L Davidson | 379 | 24.5 | ||
Majority | 238 | 15.3 | |||
Turnout | 1,547 | 56 | |||
Liberal Democrats win (new seat) |
Party | Candidate | Votes | % | ||
---|---|---|---|---|---|
Liberal Democrats | J McGregor | 767 | 50 | ||
Conservative | W Leslie | 329 | 21.5 | ||
SNP | M Cullen | 292 | 19 | ||
Labour | S Bousfield | 145 | 9.5 | ||
Majority | 438 | 28.5 | |||
Turnout | 1,533 | 60 | |||
Liberal Democrats win (new seat) |
Party | Candidate | Votes | % | ||
---|---|---|---|---|---|
Liberal Democrats | A Findlay | 1,120 | 54.4 | ||
Conservative | I Walker | 602 | 29.2 | ||
SNP | J Hermse | 189 | 9.2 | ||
Labour | L Leighton | 148 | 7.2 | ||
Majority | 518 | 25.2 | |||
Turnout | 2,059 | 64.4 | |||
Liberal Democrats win (new seat) |
Party | Candidate | Votes | % | ||
---|---|---|---|---|---|
Liberal Democrats | W A Findlay | 739 | 56.7 | ||
SNP | C Little | 319 | 24.5 | ||
Conservative | I Hopkin | 246 | 18.9 | ||
Majority | 420 | 32.2 | |||
Turnout | 2,059 | 64.4 | |||
Liberal Democrats win (new seat) |
Party | Candidate | Votes | % | ||
---|---|---|---|---|---|
Liberal Democrats | J Strathdee | 391 | 33.3 | ||
Liberal Democrats | P Morgan | 313 | 26.7 | ||
Independent | R Ness | 219 | 18.7 | ||
Conservative | N Webb | 146 | 12.4 | ||
Labour | P Sheal | 104 | 8.9 | ||
Majority | 78 | 6.6 | |||
Turnout | 1,173 | 49.5 | |||
SNP win (new seat) |
Party | Candidate | Votes | % | ||
---|---|---|---|---|---|
Liberal Democrats | W Anderson | 605 | 38.9 | ||
Independent | G Lumsden | 506 | 32.6 | ||
SNP | J Strong | 222 | 14.3 | ||
Conservative | B Jiggens | 132 | 8.5 | ||
Labour | R Barton | 89 | 5.7 | ||
Majority | 99 | 6.3 | |||
Turnout | 1,554 | 54.9 | |||
Liberal Democrats win (new seat) |
Party | Candidate | Votes | % | ||
---|---|---|---|---|---|
Liberal Democrats | K Carmichael | 369 | 27.1 | ||
Independent | D Grant | 345 | 25.3 | ||
Conservative | M Taitt | 328 | 24 | ||
SNP | M Grant | 242 | 17.7 | ||
Green Independent | J Williams | 80 | 5.9 | {{{change}}} | |
Majority | 24 | 1.8 | |||
Turnout | 1,364 | 54.6 | |||
Liberal Democrats win (new seat) |
Party | Candidate | Votes | % | ||
---|---|---|---|---|---|
Conservative | B Luffman | 610 | 39 | ||
Liberal Democrats | R Hunter | 475 | 30.3 | ||
SNP | C Watt | 361 | 23.1 | ||
Labour | N Bayfield | 120 | 7.7 | ||
Majority | 135 | 8.7 | |||
Turnout | 1,566 | 58.7 | |||
Liberal Democrats win (new seat) |
Party | Candidate | Votes | % | ||
---|---|---|---|---|---|
Liberal Democrats | R Stroud | 847 | 57 | ||
Conservative | F Lawson | 348 | 23.4 | ||
SNP | L Watt | 292 | 19.6 | ||
Majority | 499 | 33.6 | |||
Turnout | 1,487 | 55.7 | |||
Liberal Democrats win (new seat) |
Party | Candidate | Votes | % | ||
---|---|---|---|---|---|
Conservative | J M M Humphrey | 1,048 | 64.7 | ||
Liberal Democrats | J MacKintosh | 266 | 16.4 | ||
SNP | A Low | 234 | 14.4 | ||
Independent | D Bruce | 73 | 4.5 | ||
Majority | 782 | 48.3 | |||
Turnout | 1,621 | 62.8 | |||
Conservative win (new seat) |
Party | Candidate | Votes | % | ||
---|---|---|---|---|---|
Liberal Democrats | P Argyle | 752 | 43.7 | ||
Conservative | G Fiddes | 619 | 36 | ||
SNP | J Meiklejohn | 212 | 12.3 | ||
Labour | G Gray | 137 | 8 | ||
Majority | 133 | 7.7 | |||
Turnout | 1,720 | 65.8 | |||
Liberal Democrats win (new seat) |
Party | Candidate | Votes | % | ||
---|---|---|---|---|---|
Conservative | D Ewing | 837 | 43.3 | ||
Liberal Democrats | S Hall | 578 | 29.9 | ||
SNP | G Clark | 331 | 17.1 | ||
Labour | G Urquhart | 186 | 9.6 | ||
Majority | 259 | 13.4 | |||
Turnout | 1,932 | 63.6 | |||
Conservative win (new seat) |
Party | Candidate | Votes | % | ||
---|---|---|---|---|---|
Independent | N Makin | 1,210 | 73.9 | ||
Liberal Democrats | I McMillan | 290 | 17.7 | ||
Labour | J burt | 137 | 8.4 | ||
Majority | 920 | 56.2 | |||
Turnout | 1,637 | 60.7 | |||
Independent win (new seat) |
Party | Candidate | Votes | % | ||
---|---|---|---|---|---|
Independent | J Watson | 408 | 27.4 | ||
Independent | R Parr | 297 | 19.9 | ||
Conservative | S Salter | 270 | 18.1 | ||
Liberal Democrats | B Strachan | 245 | 16.4 | ||
SNP | H Taylor | 158 | 10.6 | ||
Labour | G Bayfield | 113 | 7.6 | ||
Majority | 111 | 7.5 | |||
Turnout | 1,491 | 62 | |||
Liberal Democrats win (new seat) |
Party | Candidate | Votes | % | ||
---|---|---|---|---|---|
Conservative | A Wallace | 521 | 32.6 | ||
Independent | H Irvine-Fortescue | 368 | 23 | ||
SNP | C Douglas | 291 | 18.2 | ||
Liberal Democrats | J Piggins | 287 | 18 | ||
Labour | M Hagger | 131 | 8.2 | ||
Majority | 153 | 9.6 | |||
Turnout | 1,598 | 57.8 | |||
Conservative win (new seat) |
Party | Candidate | Votes | % | ||
---|---|---|---|---|---|
Liberal Democrats | A Tunstall | 486 | 33 | ||
SNP | G Coutts | 462 | 31.4 | ||
Conservative | E Leavitt | 266 | 18.1 | ||
Labour | D Watt | 258 | 17.5 | ||
Majority | 24 | 1.6 | |||
Turnout | 1,472 | 54 | |||
Liberal Democrats win (new seat) |
Party | Candidate | Votes | % | ||
---|---|---|---|---|---|
Liberal Democrats | M Nash | 623 | 45.3 | ||
SNP | A Bews | 380 | 27.6 | ||
Conservative | G Paterson | 372 | 27.1 | ||
Majority | 243 | 17.7 | |||
Turnout | 1,275 | 53 | |||
Liberal Democrats win (new seat) |
Party | Candidate | Votes | % | ||
---|---|---|---|---|---|
Conservative | A Bisset | 658 | 44.3 | ||
Liberal Democrats | M Sullivan | 436 | 29.3 | ||
SNP | T Muir | 239 | 16.1 | ||
Labour | J Smith | 153 | 10.3 | ||
Majority | 222 | 15 | |||
Turnout | 1,486 | 60.8 | |||
Conservative win (new seat) |
Party | Candidate | Votes | % | ||
---|---|---|---|---|---|
Independent | J H McLean | 537 | 37 | ||
Conservative | W Agnew | 306 | 21.1 | ||
SNP | J Vigurs | 265 | 18.2 | ||
Liberal Democrats | P Bellarby | 219 | 15.1 | ||
Labour | D Sharp | 126 | 8.7 | ||
Majority | 231 | 15.9 | |||
Turnout | 1,453 | 52.5 | |||
Independent win (new seat) |
Party | Candidate | Votes | % | ||
---|---|---|---|---|---|
Independent | G Swapp | 1,097 | 67.8 | ||
Conservative | B Bartlett | 178 | 11 | ||
SNP | S Munn | 173 | 10.7 | ||
Liberal Democrats | C Tailford | 169 | 10.5 | ||
Majority | 919 | 56.8 | |||
Turnout | 1,617 | 61.5 | |||
Independent win (new seat) |
Party | Candidate | Votes | % | ||
---|---|---|---|---|---|
Independent | I Frain | 442 | 35.5 | ||
SNP | S Speirs | 323 | 26 | ||
Independent | V Fairclough | 206 | 16.6 | ||
Liberal Democrats | B Fenwick | 174 | 14 | ||
Labour | J Milne | 99 | 8.0 | ||
Majority | 119 | 9.5 | |||
Turnout | 1,244 | 52.9 | |||
Independent win (new seat) |
Party | Candidate | Votes | % | ||
---|---|---|---|---|---|
Liberal Democrats | D Smith | 649 | 43.9 | ||
SNP | P Martin | 578 | 39.1 | ||
Conservative | J Duncan | 252 | 17 | ||
Majority | 71 | 4.8 | |||
Turnout | 1,479 | 53.8 | |||
Liberal Democrats win (new seat) |
Party | Candidate | Votes | % | ||
---|---|---|---|---|---|
Liberal Democrats | W Howatson | 738 | 49.1 | ||
Conservative | W Pirie | 403 | 26.8 | ||
SNP | J Dick | 361 | 24 | ||
Majority | 335 | 22.3 | |||
Turnout | 1,502 | 55.7 | |||
Liberal Democrats win (new seat) |
Aberdeen City Council represents the Aberdeen City council area of Scotland.
Renfrewshire is one of the 32 council areas of Scotland.
Local government in Scotland is organised through 32 unitary authorities designated as councils which consist of councillors elected every five years by registered voters in each of the council areas.
A councillor is a member of a local government council in some countries, e.g. England. In Finland it is a title of honour granted by the government to several categories of Finns.
A county council is the elected administrative body governing an area known as a county. This term has slightly different meanings in different countries.
Comhairle nan Eilean Siar is the local government council for Na h-Eileanan Siar council area of Scotland. It is based in Stornoway in the Isle of Lewis.
The 2007 UK local government elections were held on 3 May 2007. These elections took place in most of England and all of Scotland. There were no local government elections in Wales though the Welsh Assembly had a general election on the same day. There were no local government elections in Northern Ireland. Just over half of English councils and almost all the Scottish councils began the counts on Friday, rather than Thursday night, because of more complex arrangements regarding postal votes.
The politics of the Highland council area in Scotland are evident in the deliberations and decisions of the Highland Council, in elections to the council, and in elections to the House of Commons of the Parliament of the United Kingdom (Westminster) and the Scottish Parliament (Holyrood). In the European Parliament the area was within the Scotland constituency, which covers all of the 32 council areas of Scotland.
The wards and electoral divisions in the United Kingdom are electoral districts at sub-national level represented by one or more councillors. The ward is the primary unit of English electoral geography for civil parishes and borough and district councils, electoral ward is the unit used by Welsh principal councils, while the electoral division is the unit used by English county councils and some unitary authorities. Each ward/division has an average electorate of about 5,500 people, but ward-population counts can vary substantially. As at the end of 2014 there were 9,456 electoral wards/divisions in the UK.
Politics in the Dundee Citycouncil area are evident in the deliberations and decisions of Dundee City Council, in elections to the council, and in elections to the Scottish Parliament (Holyrood) and the House of Commons of the Parliament of the United Kingdom (Westminster).
Elections to the Highland Council were held on 1 May 2003; the same day as elections to the Scottish Parliament and to the 31 other councils in Scotland. 80 councillors were elected from 80 wards using the plurality system. Independent councillors retained their status as the majority group, with councillors also being elected representing the Labour Party, Liberal Democrats, and Scottish National Party.
Elections to the Highland Council were held on 6 May 1999; the same day as elections to the Scottish Parliament and to the 31 other councils in Scotland. 80 councillors were elected from 80 wards using the plurality system. Independent councillors retained their status as the majority group, with councillors also being elected representing the Labour Party, Liberal Democrats, and Scottish National Party.
The Highland Council, the political body covering the Highland local authority created in 1995, comprises 22 wards, each electing three or four councillors by the single transferable vote system, which creates a form of proportional representation. The total number of councillors is 74, and the main meeting place and main offices are in Glenurquhart Road, Inverness.
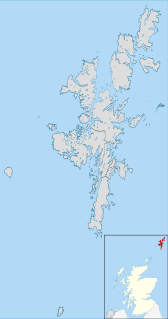
Elections to Shetland Islands Council were held on 3 May 2007 the same day as the other Scottish local government elections and the Scottish Parliament general election. The election was the first one using seven new wards created as a results of the Local Governance (Scotland) Act 2004. Each ward elected three or four councillors using the single transferable vote system, a form of proportional representation. The new wards replaced 22 single-member wards which used the plurality system of election. The Council was one of only three in Scotland with a majority of elected members who were independents.
Local elections were held in the United Kingdom on 7 May 1992, one month after the general election which returned the governing Conservative Party for a fourth consecutive term in office. The Conservatives won back some ground that they had lost the previous year.
Elections to East Lothian Council were held on 3 May 2012, on the same day as the other Scottish local government elections. The election used the 7 wards created as a result of the Local Governance (Scotland) Act 2004, with each ward electing three or four councillors using the single transferable vote system a form of proportional representation, with 23 councillors elected.
2003 Elections to Fife Council were held on 3 May 2003, the same day as the other Scottish local government elections and the Scottish Parliament election. The election was the last one to use plurality system of election to elected the 78 individual councillors.
The 1999 elections to West Dunbartonshire Council were held on the 6 May 1999 and were the second to the unitary authority, which was created, along with 28 other local authorities, under the Local Government etc (Scotland) Act 1994.
Elections to Liverpool City Council were held on 1 November 1923.
The City of Glasgow is divided into a number of wards. These electoral districts, as they are also known, are used to elect councillors to Glasgow City Council. The council, composed of the elected members from each ward, provides local government services to the City of Glasgow.