1991 Cardiff City Council election

Last updated

1991 Cardiff City Council election
Flag of Cardiff.svg
  1987 2 May 1991 1995  

All 65 seats to Cardiff City Council
33 seats needed for a majority
 First partySecond partyThird party
  No image wide.svg No image wide.svg No image wide.svg
Party Labour Conservative Liberal Democrats
Seats won39169
Seat changeIncrease2.svg10Decrease2.svg8Decrease2.svg3
Popular vote68,270

 Fourth party
  No image wide.svg
Party Independent
Seats won1
Seat changeIncrease2.svg1
Popular vote572

Council control before election

Labour

Council control after election

Labour

The 1991 Cardiff City Council election was held on Thursday 2 May 1991 to the district council of Cardiff in South Glamorgan, Wales. It took place on the same day as other district council elections in Wales and England. The Labour Party regained a majority on Cardiff City Council, after sharing government for the previous four years. [1]

Contents

The previous Cardiff City Council election took place in 1987. [2] The 1991 election was to be the final election to the district council before its dissolution and replacement, in 1995, by the new County Council of the City and County of Cardiff unitary authority.

Overview

All 65 council seats were up for election, though the election in the safe Conservative ward of Heath was delayed, with the results coming later (though not affecting Labour's majority control). Since 1987 Labour had governed in coalition with the SDP-Liberal Alliance. Following the 1991 election it regained a majority on the council. [3]

One of the major upsets of the election was the next Cardiff Lord Mayor-to-be, Gerald Brinks, losing his Roath seat. His designated successor, Anthea Thomas, also lost her seat in Llanishen. This meant Cllr Jeff Sainsbury unexpectedly became the new Lord Mayor, four years earlier than planned, as well as leader of the Conservative group on the council. [3]

Labour made 11 gains and lost only one seat, to Independent Betty Campbell, in Butetown. The Conservatives lost 8 seats and the Liberal Democrats lost three. [3]

Cardiff Council election result 1991 [2]
PartySeatsGainsLossesNet gain/lossSeats %Votes %Votes+/−
  Labour 39111Increase2.svg1060.068,270
  Conservative 1608Decrease2.svg824.6
  Liberal Democrats 925Decrease2.svg313.8
  Independent 110Increase2.svg11.5572
  Green 000Steady2.svg±00.04,910
  Plaid Cymru 000Steady2.svg±00.02,506
  SDP 000Steady2.svg±00.0717

Ward Results

Contests were held in all twenty-six wards: [2] (a) [4] (b)

Adamsdown (2 seats)

Adamsdown [2]
PartyCandidateVotes%±%
Labour Jon Owen Jones * 1,209 65.9 +8.3
Labour William P. M. Herbert * 1,194
Liberal Democrats Nigel Howells25614.0-5.6
Conservative A. C. S. Baker22012.0-5.9
Liberal Democrats S. Stevenson210
Conservative B. Jeffreys201
Plaid Cymru H. Davies1108.2+3.3
Turnout 33.0-3.8
Registered electors 5,649
Labour hold Swing
Labour hold Swing

Butetown (1 seat)

Butetown [2]
PartyCandidateVotes%±%
Independent Rachel E. Campbell 572 46.4 N/A
Labour Ben J. Foday 532 43.1 -23.3
Conservative K. D. Summerhayes1149.2-16.3
Liberal Democrats B. N. Singh161.3-6.8
Turnout 51.0+7.7
Registered electors 2,437
Independent gain from Labour Swing

Caerau (2 seats)

Caerau [2]
PartyCandidateVotes%±%
Liberal Democrats Jacqui A. Gasson * 1,914 49.9 +17.3
Labour Harry J. Ernest 1,546 40.3 -6.6
Labour David J. Seligman *1,444
Liberal Democrats Roger C. Burley1,417
Conservative A. J. Pithers2586.7-10.3
Green R. S. Best1213.2-0.2
Turnout 48.0+1.8
Registered electors 7,532
Liberal Democrats hold Swing
Labour hold Swing

Canton (3 seats)

Canton [2]
PartyCandidateVotes%±%
Labour Kevin D. Brennan 2,485 50.8 +15.6
Labour P. D. E. Mitchell 2,351
Labour David W. Thomas 2,153
Conservative D. O. Davey *1,47330.1-9.3
Conservative S. P. Docking1,421
Conservative Trevor C. Tyrrell *1,405
Liberal Democrats P. E. Crees51310.5-4.0
Liberal Democrats M. G. Kettle464
Green Vivien M. C. Turner4168.5+1.8
Liberal Democrats C. Morris386
Turnout 44.0-10.3
Registered electors 10,527
Labour gain from Conservative Swing

Cathays (3 seats)

Cathays [2]
PartyCandidateVotes%±%
Liberal Democrats Michael J. German * 2,231 41.7 +4.1
Liberal Democrats Fred J. Hornblow * 2,115
Labour Derek R. Allinson * 1,903 35.6 -1.3
Liberal Democrats D. W. T. Rees1,742
Labour L. J. Glaister1,672
Labour Reg Surridge1,553
Conservative B. Rees62111.6-4.8
Green N. Clark59711.2+5.3
Conservative D. G. Embers496
Conservative M. M. Williams457
Turnout 46.0-5.2
Registered electors 10,363
Liberal Democrats hold Swing
Labour hold Swing

Cyncoed (3 seats)

Cyncoed [2]
PartyCandidateVotes%±%
Liberal Democrats Jenny E. Randerson 3,134 55.1 +4.4
Liberal Democrats T. C. Pickets 2,956
Liberal Democrats N. J. Lewis 2,846
Conservative C. V. Baker1,86832.8-10.7
Conservative T. D. Donnelly1,803
Conservative E. Loader1,747
Labour S. N. Lashford3967.0
Labour C. Tugwell393
Labour V. J. James365
Green D. P. Corker2905.1N/A
Turnout 62.0-7.7
Registered electors 8,659
Liberal Democrats hold Swing

Ely (3 seats)

Ely [2]
PartyCandidateVotes%±%
Labour Elaine E. Morgan* 2,448 67.9 +8.9
Labour T. A. Davies 2,194
Labour Charlie Gale * 2,144
Conservative K. B. Gillard68719.1-1.9
Liberal Democrats I. I. Sadler47113.1-7.1
Liberal Democrats M. Rawnsley428
Liberal Democrats R. J. Hewlett415
Turnout 34.0-3.0
Registered electors 10,870
Labour hold Swing
Labour hold Swing
Labour hold Swing

Fairwater (3 seats)

Fairwater [2]
PartyCandidateVotes%±%
Labour Maxwell J. Phillips * 2,501 52.3 +12.2
Labour T. J. Ward * 2,497
Labour D. M. Evans * 2,227
Conservative D. M. Norman1,04621.9-5.5
Conservative W. R. P. Clarke1,002
SDP R. G. Drake71715.0N/A
Liberal Democrats C. L. Ceaton52110.9-18.1
Liberal Democrats S. L. White373
Liberal Democrats A. M. Wigley329
Turnout 41.0+13.0
Registered electors 10,295
Labour hold Swing
Labour hold Swing
Labour hold Swing

Gabalfa (1 seat)

Gabalfa [2]
PartyCandidateVotes%±%
Labour C. D. Hutchinson * 1,362 63.1 +11.4
Conservative E. R. Morgan50623.5
Liberal Democrats Cathy W. J. Pearcy38913.4-9.1
Turnout 45.0-7.7
Registered electors 4,769
Labour hold Swing

Grangetown (3 seats)

Grangetown [2]
PartyCandidateVotes%±%
Labour Joan M. Gallagher * 2,192 54.5 +7.1
Labour John F. Smith * 2,129
Labour Lynda D. Thorne * 2,123
Conservative J. S. Summerhayes91722.8-17.6
Conservative F. M. Arnold902
Conservative S. Trask757
Plaid Cymru P. Fawkes3588.9N/A
Liberal Democrats J. Turnbull3418.5-3.7
Green K. S. Shaw2125.3N/A
Liberal Democrats M. K. Verma153
Liberal Democrats A. Sayeda152
Turnout 40.0-10.7
Registered electors 9,220
Labour hold Swing
Labour hold Swing
Labour hold Swing

Heath (3 seats)

Heath [2]
PartyCandidateVotes%±%
Conservative C. Milsom * 1,829 34.6 -18.4
Conservative P. Donnelly 1,770
Conservative Greville Tatham * 1,643
Independent N. Rhodes1,47027.8N/A
Liberal Democrats W. Monkley85416.1-7.2
Liberal Democrats V. Hallett810
Liberal Democrats J. James805
Labour S. Walters75014.2-1.5
Labour L. Poole650
Labour A. Culat600
Green M. Evans3867.3-0.8
Turnout 42.0-13.5
Registered electors 9,395
Conservative hold Swing

The contest in the Heath ward was suspended until after the main election, with the result declared at a later date.

Lisvane and St Mellons (1 seat)

Lisvane and St Mellons [2]
PartyCandidateVotes%±%
Conservative J. W. Richards * 1,217 52.0 -4.9
Liberal Democrats A. M. Holland80134.2-0.4
Labour L. H. V. Davis26511.3+2.9
Green M. L. Duddy562.4N/A
Turnout 49.0-6.5
Registered electors 4,772
Conservative hold Swing

Llandaff (2 seats)

Llandaff [2]
PartyCandidateVotes%±%
Conservative Julius Hermer * 1,631 46.1 -4.3
Conservative M. E. Jones * 1,605
Labour V. Seligman83623.6+10.3
Labour R. C. Watson775
Liberal Democrats W. A. Slack50114.2-15.1
Liberal Democrats E. R. Williams393
Plaid Cymru G. Jones3289.3+2.2
Green F. O. James2416.8N/A
Turnout 49.0-7.0
Registered electors 6,767
Conservative hold Swing

Llandaff North (2 seats)

Llandaff North [2]
PartyCandidateVotes%±%
Labour M. D. Flynn * 1,799 66.9 +10.9
Labour M. E. Matthewson * 1,666
Conservative D. G. Morgan54820.4-3.1
Conservative J. B. Marshall524
Liberal Democrats G. M. James34312.8-3.4
Liberal Democrats D. J. Wright276
Turnout 46.0-1.3
Registered electors 6,116
Labour hold Swing
Labour hold Swing

Llanishen (3 seats)

Llanishen [2]
PartyCandidateVotes%±%
Conservative P. Tatham * 2,382 41.9 +1.9
Conservative A. L. Gretton * 2,316
Labour Garry Hunt 2,308 40.6 +10.1
Labour W. A. J. Matthews2,252
Labour W. C. Laing2,239
Conservative Anthea J. Thomas *2,158
Liberal Democrats M. D. Cawley98917.4-12.2
Liberal Democrats V. M. Hallett951
Liberal Democrats E. W. Richards900
Turnout 54.0+0.4
Registered electors 10,784
Conservative hold Swing
Labour gain from Conservative Swing

Llanrumney (3 seats)

Llanrumney [2]
PartyCandidateVotes%±%
Labour Gill M. Bird * 2,575 69.4 +18.1
Labour B. James * 2,386
Labour John R. Phillips * 2,159
Conservative A. M. McCarthy74320.0-3.2
Conservative R. J. Robinson735
Conservative H. P. Hunt694
Green L. Davey39210.6N/A
Turnout 39.0-6.8
Registered electors 9,305
Labour hold Swing
Labour hold Swing
Labour hold Swing

Pentwyn (3 seats)

Pentwyn [2]
PartyCandidateVotes%±%
Labour R. Longworth * 1,817 43.0 +15.5
Labour P. K. Cubitt 1,702
Labour J. Sullivan 1,641
Liberal Democrats J. A. Walklett1,29230.6-6.2
Liberal Democrats M. C. McMahon1,270
Liberal Democrats G. R. Williams1,221
Conservative W. J. Pursey81319.2-11.7
Conservative E. T. Richardson777
Conservative V. A. West717
Green G. J. John3057.2N/A
Turnout 35.0-5.7
Registered electors 11,749
Labour hold Swing
Labour gain from Liberal Democrats Swing

Plasnewydd (4 seats)

Plasnewydd [2]
PartyCandidateVotes%±%
Labour A. C. Cox 2,401 37.4 +10.4
Labour P. W. Morris 2,203
Labour F. M. Jackson 2,153
Labour J. Wilkinson 2,083
Liberal Democrats Georgette O. J. German *1,78227.8-8.6
Liberal Democrats S. E. Jennett1,459
Liberal Democrats J. C. Bennett1,379
Liberal Democrats P. K. Verma1,226
Conservative S. V. Cox1,04816.3-7.7
Conservative K. Fisher933
Conservative D. C. Porter876
Conservative D. C. Williams809
Green C. J. von Ruhland67510.5+3.5
Plaid Cymru S. Edwards5118.0
Turnout 43.0-13.9
Registered electors 12,088
Labour hold Swing
Labour gain from Liberal Democrats Swing

Radyr & St Fagans (1 seat)

Radyr & St Fagans [2]
PartyCandidateVotes%±%
Conservative P. Davison-Sebry 1,035 48.4 -3.2
Labour P. Robinson60028.1+16.5
Liberal Democrats N. L. Roberts50223.5-11.3
Turnout 55.0-12.1
Registered electors 3,885
Conservative hold Swing

Rhiwbina (3 seats)

Rhiwbina [2]
PartyCandidateVotes%±%
Conservative Gareth J. J. Neale * 2,642 50.5 -0.1
Conservative Jeffrey P. Sainsbury * 2,605
Conservative K. B. C. Heselton * 2,483
Labour L. L. Jenkins1,18322.6+9.9
Labour J. B. Minkes1,093
Labour A. P. Kempton987
Liberal Democrats J. G. Brent97618.7-9.1
Liberal Democrats G. Hallet927
Liberal Democrats K. Bowden832
Green G. P. Jones4278.2-0.7
Turnout 52.0-10.1
Registered electors 9,437
Conservative hold Swing

Riverside (3 seats)

Riverside [2]
PartyCandidateVotes%±%
Labour R. I. O. Brown * 2,340 54.8 +7.2
Labour Jane E. Davidson * 2,295
Labour Sue L. Essex * 2,271
Conservative N. A. Rhodes77618.2-5.3
Conservative G. Crosby736
Conservative P. C. Young720
Green P. G. Ward4069.5-0.4
Plaid Cymru C. ap Henri3828.9+2.1
Liberal Democrats R. Addison3678.6-3.5
Liberal Democrats A. M. Burgess303
Liberal Democrats R. P. Fawcett247
Turnout 41.0-9.7
Registered electors 9,438
Labour hold Swing
Labour hold Swing
Labour hold Swing

Roath (3 seats)

Roath [2]
PartyCandidateVotes%±%
Liberal Democrats C. J. Kelloway * 2,717 49.1 +5.7
Liberal Democrats M. N. Michaelis 2,458
Liberal Democrats Freda J. Salway 2,344
Conservative G. M. Brinks *1,61529.2-13.2
Conservative D. G. Williams *1,415
Conservative D. C. Harris1,398
Labour Ralph Rees81814.8-0.4
Labour D. Groves789
Labour A. Stuart629
Green D. Beasley3867.0N/A
Turnout 51.0-21.4
Registered electors 9,892
Liberal Democrats hold Swing
Liberal Democrats gain from Conservative Swing

Rumney (2 seats)

Rumney [2]
PartyCandidateVotes%±%
Labour A. A. Huish 1,820 59.7 +18.9
Labour C. Holland 1,649
Conservative A. L. Hollands1,21640.3-7.4
Conservative L. T. Sharp1,079
Turnout 46.0-8.4
Registered electors 6,724
Labour gain from Conservative Swing

Splott (2 seats)

Splott [2]
PartyCandidateVotes%±%
Labour Geoffrey Mungham * 2,894 75.9 +13.2
Labour Ricky Ormonde * 2,572
Conservative G. D. Donaldson58516.5-5.7
Conservative C. S. Ayland546
Liberal Democrats J. V. Febbo2717.6±0.0
Liberal Democrats R. K. Bhagat193
Turnout 46.0-1.6
Registered electors 7,974
Labour hold Swing
Labour hold Swing

Trowbridge (2 seats)

Trowbridge [2]
PartyCandidateVotes%±%
Labour D. M. English * 1,689 61.7 -1.0
Labour R. S. Hughes * 1,658
Conservative A. L. Cashin64423.5+0.3
Conservative K. Thomas625
Liberal Democrats W. J. Ford27410.0-4.0
Liberal Democrats H. K. Deogan263
Plaid Cymru S. R. Parry1294.7N/A
Turnout 33.0-2.2
Registered electors 8,442
Labour hold Swing
Labour hold Swing

Whitchurch & Tongwynlais (4 seats)

Whitchurch & Tongwynlais [2]
PartyCandidateVotes%±%
Conservative W. H. Griffiths * 3,033 42.5 -2.3
Conservative T. H. Davies * 2,817
Conservative Brian John Griffiths * 2,798
Conservative Victor Riley* 2,652
Labour D. R. Bethel2,62936.8+7.7
Labour T. H. Crews2,561
Labour P. H. Owen2,376
Labour M. R. Winters2,176
Liberal Democrats G. A. Mellem83211.6-14.5
Liberal Democrats H. G. Howell812
Liberal Democrats F. Leevers810
Liberal Democrats T. J. G. Williams658
Plaid Cymru Harri Pritchard-Jones 6489.1N/A
Turnout 56.0-4.3
Registered electors 11,647
Conservative hold Swing

(a) Elections Centre source also indicates pre-existing 'retiring' ward councillors, whether candidate is female, compares the percentage vote of the lead candidate for each party in the ward

(b) South Wales Echo source also indicates pre-existing 'retiring' ward councillors, candidates' full initials, whether the result was 'no change' or a 'gain'

*pre-existing 'retiring' ward councillors at this election

See also

Related Research Articles

<span class="mw-page-title-main">Cardiff City Council</span> Local government of Cardiff, Wales from 1974 to 1996

Cardiff City Council was the local government district authority that administered the city of Cardiff, capital of Wales, from 1974 until 1996. The district council replaced the pre-1974 county borough council. It was succeeded in 1996 by Cardiff Council.

<span class="mw-page-title-main">2012 Vale of Glamorgan Council election</span>

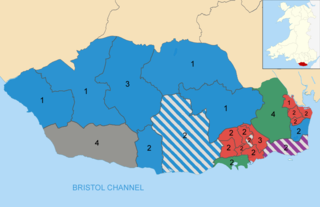
The 2012 Vale of Glamorgan Council election took place on Thursday 3 May 2012 to elect members of Vale of Glamorgan Council in Wales. This was the same day as other United Kingdom local elections. The previous full council election took place on 1 May 2008 and the next one took place on 4 May 2017.

The 1995 Cardiff Council election was the first election to the new unitary County Council of the City and County of Cardiff following the re-organization of local government in Wales. It was held on Thursday 4 May 1995. It was followed by the 1999 elections. On the same day there were elections to the other 21 local authorities in Wales and community councils in Wales. Labour won a majority of the seats. It was preceded in Cardiff by the 1991 elections to Cardiff City Council and the 1993 elections to South Glamorgan County Council.

Canton is the name of an electoral ward in the west of the city of Cardiff, Wales, which covers part of its namesake community, Canton. The ward elects three county councillors to the County Council of the City and County of Cardiff.

<span class="mw-page-title-main">Rhiwbina (electoral ward)</span> Community/Electoral ward in Wales

Rhiwbina is the name of an electoral ward in the north of Cardiff, capital city of Wales. It covers the community of the same name.

<span class="mw-page-title-main">Heath (electoral ward)</span> Electoral ward in Wales

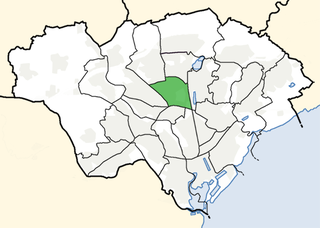
Heath is the name of an electoral ward in the north of the city of Cardiff, Wales, which covers its namesake community, Heath. The ward elects three county councillors to the County Council of the City and County of Cardiff.

The 1973 South Glamorgan County Council election was the first election to South Glamorgan County Council and was held in April 1973. It was followed by the 1977 election.

The 1987 Cardiff City Council election was held on Thursday 7 May 1987 to the district council known as Cardiff City Council, in Cardiff, South Glamorgan, Wales. It took place on the same day as other district council elections in Wales and England. The Conservative Party lost control of the council, though the Labour Party were unable to regain an overall majority.

The 1920 Cardiff City Council election was held on Monday 1 November 1920 to elect councillors to Cardiff City Council in Cardiff, Glamorgan, Wales. It took place on the same day as many other local elections in Wales and England.

<span class="mw-page-title-main">Central (Cardiff electoral ward)</span> Electoral ward in Wales

Central was the name of an original electoral ward in the centre of the county borough and, from 1905, city of Cardiff, Wales. It elected representatives to the Cardiff County Borough Council and, from 1974, South Glamorgan County Council. The ward ceased to exist in 1996.

The 1983 Cardiff City Council election was held on Thursday 5 May 1983 to the district council known as Cardiff City Council, in Cardiff, South Glamorgan, Wales. It took place on the same day as other district council elections in Wales and England. The Conservative Party regained control of the council from the Labour Party.

The 1983 Vale of Glamorgan Borough Council election was held on Thursday 5 May 1983 to the Vale of Glamorgan Borough Council in South Glamorgan, Wales. It took place on the same day as other district council elections in Wales and England. The Conservative Party won a healthy majority on the council.

The 1995 Vale of Glamorgan Council election was held on 4 May 1995 to the new Vale of Glamorgan Council unitary authority in Vale of Glamorgan, Wales. It took place on the same day as other council elections in Wales and England. These were the first elections since the re-organization of local government in Wales.

The 1970 Cardiff City Council election was held on Thursday 7 May 1970 to elect councillors to Cardiff City Council in Cardiff, Glamorgan, Wales. It took place on the same day as many other local elections in Wales and England.

The 1971 Cardiff City Council election was held on Thursday 13 May 1971 to elect councillors to Cardiff City Council in Cardiff, Glamorgan, Wales. It took place on the same day as several other county borough elections in Wales and England.

The 1967 Cardiff City Council election was held on Thursday 11 May 1967 to elect councillors to Cardiff City Council in Cardiff, Glamorgan, Wales. It took place on the same day as several other county borough elections in Wales and England.

The 1966 Cardiff City Council election was held on Thursday 12 May 1966 to elect councillors to Cardiff City Council in Cardiff, Glamorgan, Wales. It took place on the same day as several other county borough elections in Wales and England.

The 1973 Cardiff City Council election was held on Thursday 10 May 1973 to elect councillors to the new Cardiff District Council in Cardiff, Wales. It took place on the same day as other district council elections in the United Kingdom.

The fifth election to South Glamorgan County Council was held in May 1989. It was preceded by the 1985 election and followed by the 1993 election.

The 1972 Cardiff City Council election was held on Thursday 4 May 1972 to elect councillors to Cardiff City Council in Cardiff, Glamorgan, Wales. It took place on the same day as several other county borough elections in Wales and England.

References

  1. "Tories stunned, Plaid celebrate in S. Wales - Labour Sweep To Power In Cardiff". South Wales Echo . 3 May 1991. p. 1.
  2. 1 2 3 4 5 6 7 8 9 10 11 12 13 14 15 16 17 18 19 20 21 22 23 24 25 26 27 28 29 "Cardiff Welsh District Council Election Results 1973-1991" (PDF). The Elections Centre (Plymouth University). Retrieved 23 May 2019.
  3. 1 2 3 "Labour sweep the city - Tory gloom as eight seats fall". South Wales Echo. 3 May 1991. p. 3.
  4. "How You Voted - South Glamorgan". South Wales Echo. 3 May 1991. p. 8.