California's 16th congressional district

Last updated

California's 16th congressional district
California's 16th congressional district (since 2023).svg
California's 16th congressional district
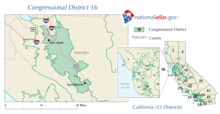
Interactive map of district boundaries since 2023 (Used in the 2022 elections). In the 2020 redistricting cycle, the 16th district was redrawn to include much of coastal San Mateo County as well as parts of Santa Clara County in Silicon Valley.
Representative
  Anna Eshoo
DAtherton
Population (2022)735,381
Median household
income
$160,623 [1]
Ethnicity
Cook PVI D+26 [2]

California's 16th congressional district is a congressional district in the U.S. state of California. It includes portions of Santa Clara and San Mateo counties, extending from the southwestern San Francisco Bay Area through the Santa Cruz Mountains to the Pacific coast. The district is currently represented by Democrat Anna Eshoo.

Contents

On December 20, 2021, the state redistricting commission unanimously approved a new map of congressional districts, under which the new district overlaps largely with the old 18th district. [3] The primary election of June 2022 was the first to feature the new districts; however, sitting representatives reflected the old district boundaries until the general election in November 2022.

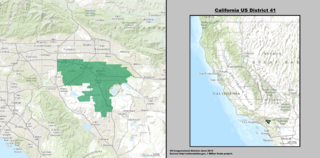
Prior to the 2020s redistricting, the district included Merced County, most of Madera County, and part of Fresno County. During this time, cities in the district included Los Banos, Madera, Merced, and most of Fresno. Cities in the new 16th district include Pacifica, Half Moon Bay, Atherton, Palo Alto, Saratoga, Campbell, Woodside, and Los Gatos, along with the south-central and southwestern parts of San Jose. Most of the old 16th district is now part of the 13th and 21st districts. [4]

Recent results from statewide elections

YearOfficeResults
1992 U.S. President Clinton (D) 52.4 – 27.1%
U.S. Senator Boxer (D) 54.4 – 34.0%
U.S. Senator Feinstein (D) 63.8 – 28.4%
1994 Governor [ data missing ]
U.S. Senator [ data missing ]
1996 U.S. President [ data missing ]
1998 Governor [ data missing ]
U.S. Senator [ data missing ]
2000 U.S. President [5] Gore (D) 64.2 – 31.7%
U.S. Senator [6] Feinstein (D) 64.4 – 30.2%
2002 Governor [7] Davis (D) 56.3 – 31.3%
2003 Recall [8] [9] Dark Red x.svg 57.3 - 42.7%
Bustamante (D) 41.2 – 38.7%
2004 U.S. President [10] Kerry (D) 63.4 – 35.5%
U.S. Senator [11] Boxer (D) 67.0 – 28.5%
2006 Governor [12] Schwarzenegger (R) 49.6 – 46.1%
U.S. Senator [13] Feinstein (D) 70.2 – 24.6%
2008 U.S. President [14] Obama (D) 69.6 – 28.8%
2010 Governor Brown (D) 62.3 – 33.4%
U.S. Senator Boxer (D) 64.3 – 30.8%
2012 U.S. President Obama (D) 58.6 – 39.4%
U.S. Senator Feinstein (D) 59.3 - 40.7%
2014 Governor Brown (D) 54.4 - 45.6%
2016 U.S. President Clinton (D) 58.0 – 36.4%
U.S. Senator Sanchez (D) 51.2 - 48.8%
2018 Governor Newsom (D) 56.1 - 43.9%
U.S. Senator de Leon (D) 51.9 - 48.1%
2020 U.S. President Biden (D) 58.8 – 38.9%
2021 Recall [15] Dark Red x.svg No 54.2 - 45.8%
2022 Governor [16] Newsom 72.5 - 27.5%
Senator Padilla 74.1 - 25.9%

Composition

#CountySeatPopulation
81 San Mateo Redwood City 737,888
85 Santa Clara San Jose 1,885,508

As of the 2020 redistricting, California's 16th congressional district is located in the San Francisco Bay Area. It encompasses the west coast and interior of San Mateo County, and the western border of Santa Clara County.

San Mateo County is split between this district and the 15th district. They are partitioned by the San Francisquito Creek, Menalto Ave, Willow Rd, S Perimeter Rd, W Perimeter Rd, Bay Rd, Marsh Rd, Middlefield Rd, Highway 82, Highway 84, Alameda de las Pulgas, Woodhill Dr, Farm Hill Blvd, The Loop Rd, Jefferson Ave, Summit Way, California Way, Junipero Serra Freeway, and Highway 35. The 16th district takes in the cities of Pacifica, Menlo Park, and Half Moon Bay, California.

Santa Clara County is split between this district, the 17th district, the 18th district, and the 19th district. The 16th and 19th are partitioned by Old Santa Cruz Highway, Aldercroft Hts Rd, Weaver Rd, Soda Springs Rd, Love Harris Rd, Pheasant Creek, Guadalupe Creek, Guadalupe Mines Rd, Oak Canyon Dr, Coleman Rd, Meridian Ave, Highway G8, Guadalupe River, W Capitol Expressway, Senter Rd, Sylvandale Ave, Yerba Buena Rd, Silver Creek Rd, and E Capitol Expressway. The 16th and 18th are partitioned by Annona Ave Santiago Ave, Tully Rd, Highway 101, S King Rd, Valley Palms Apts, Story Rd, Senter Rd, E Alma Ave, S 7th St, Monterey Rd, Barnard Ave, Highway G8, Highway 87, W Alma Ave, Belmont Way, Belmont Ave, Minnesota Ave, Prevost St, Atlanta Ave, Fuller Ave, Riverside Dr, Coe Ave, Lincoln Ave, Paula St, Highway 280, and Highway 880. The 16th and 17th are partitioned by Stevens Creek Blvd, Santana Row, Olsen Dr, S Winchester Blvd, Williams Rd, Eden Ave, Lexington Dr, Valley Forge Way, Gleason Ave, Moreland Way, Payne Ave, Saratoga Ave, Doyle Rd, Highway G2, Royal Ann Dr, Wisteria Way, Rainbow Dr, Highway 85, S De Anza Blvd, Prospect Rd, Fremont Older Open Space, Permanente Creek, Highway 280, N Foothill Blvd, Homestead Rd, Stevens Creek, W EL Camino Real, Magritte Way, Highway G6, Highway 101, and Enterprise Way.

The 16th district takes in the west central section of the city of San Jose, the cities of Campbell, Saratoga, Los Gatos, Los Altos, Mountain View, and the census-designated place Stanford, which includes Stanford University.

Cities & CDP with 10,000 or more people

List of members representing the district

RepresentativePartyDatesCong
ress(es)
Electoral historyCounties
District created March 4, 1933
John F. Dockweiler, 1932 (cropped).jpg
John F. Dockweiler
(Los Angeles)
Democratic March 4, 1933 –
January 3, 1939
73rd
74th
75th
Elected in 1932.
Re-elected in 1934.
Re-elected in 1936.
Lost re-election as an independent
candidate after running for governor.
[ data missing ]
Leland M. Ford.jpeg
Leland M. Ford
(Santa Monica)
Republican January 3, 1939 –
January 3, 1943
76th
77th
Elected in 1938.
Re-elected in 1940.
Lost re-election.
[ data missing ]
Will Rogers, Jr.JPG
Will Rogers Jr.
(Culver City)
Democratic January 3, 1943 –
May 23, 1944
78th Elected in 1942.
Resigned to return to
active duty in the Army.
[ data missing ]
VacantMay 23, 1944 –
January 3, 1945
Ellis E. Patterson (1).jpg
Ellis E. Patterson
(Los Angeles)
Democratic January 3, 1945 –
January 3, 1947
79th Elected in 1944.
Lost re-nomination.
[ data missing ]
DonaldLJackson.jpg
Donald L. Jackson
(Los Angeles)
Republican January 3, 1947 –
January 3, 1961
80th
81st
82nd
83rd
84th
85th
86th
Elected in 1946.
Re-elected in 1948.
Re-elected in 1950.
Re-elected in 1952.
Re-elected in 1954.
Re-elected in 1956.
Re-elected in 1958.
Retired.
[ data missing ]
Alphonzo Bell.jpg
Alphonzo E. Bell Jr.
(Santa Monica)
Republican January 3, 1961 –
January 3, 1963
87th Elected in 1960.
Redistricted to the 28th district .
[ data missing ]
BFSisk.png
B. F. Sisk
(Fresno)
Democratic January 3, 1963 –
January 3, 1975
88th
89th
90th
91st
92nd
93rd
Redistricted from the 12th district and re-elected in 1962.
Re-elected in 1964.
Re-elected in 1966.
Re-elected in 1968.
Re-elected in 1970.
Re-elected in 1972.
Redistricted to the 15th district .
Fresno, Madera, Merced
Fresno, Merced
Burt L. Talcott.jpg
Burt Talcott
(Salinas)
Republican January 3, 1975 –
January 3, 1977
94th Redistricted from the 12th district and re-elected in 1974.
Lost re-election.
Western Monterey, San Benito, northern San Luis Obispo, Santa Cruz
Leon Panetta congressional photo 1977.jpg
Leon Panetta
(Carmel Valley)
Democratic January 3, 1977 –
January 3, 1993
95th
96th
97th
98th
99th
100th
101st
102nd
Elected in 1976.
Re-elected in 1978.
Re-elected in 1980.
Re-elected in 1982.
Re-elected in 1984.
Re-elected in 1986.
Re-elected in 1988.
Re-elected in 1990.
Redistricted to the 17th district
Monterey, San Benito, northern San Luis Obispo, southern Santa Cruz
Don Edwards.jpg
Don Edwards
(San Jose)
Democratic January 3, 1993 –
January 3, 1995
103rd Redistricted from the 10th district and re-elected in 1992.
Retired.
Santa Clara
Zoe Lofgren 111th pictorial.jpg
Zoe Lofgren
(San Jose)
Democratic January 3, 1995 –
January 3, 2013
104th
105th
106th
107th
108th
109th
110th
111th
112th
Elected in 1994.
Re-elected in 1996.
Re-elected in 1998.
Re-elected in 2000.
Re-elected in 2002.
Re-elected in 2004.
Re-elected in 2006.
Re-elected in 2008.
Re-elected in 2010.
Redistricted to the 19th district
2003–2013
CA-16th.png
Santa Clara (San Jose)
Jim Costa official portrait (cropped).jpg
Jim Costa
(Fresno)
Democratic January 3, 2013 –
January 3, 2023
113th
114th
115th
116th
117th
Redistricted from the 20th district and re-elected in 2012.
Re-elected in 2014.
Re-elected in 2016.
Re-elected in 2018.
Re-elected in 2020.
Redistricted to the 21st district .
2013–2023
California US Congressional District 16 (since 2013).tif
Central Valley including Fresno and Merced
Anna Eshoo official photo.jpg
Anna Eshoo
(Atherton)
Democratic January 3, 2023 –
present
118th Redistricted from the 18th district and re-elected in 2022.
Retiring at end of term.
2023–present
California's 16th congressional district (since 2023) (new version).svg
portions of Santa Clara, San Mateo, and Santa Cruz counties, extending from the southwestern San Francisco Bay Area through the Santa Cruz Mountains to the Pacific coast.

Election results

1932193419361938194019421944194619481950195219541956195819601962196419661968197019721974197619781980198219841986198819901992199419961998200020022004200620082010201220142016201820202022

1932

United States House of Representatives elections, 1932 [17]
PartyCandidateVotes%
Democratic John F. Dockweiler 70,333 54.9
Republican Clyde Woodworth57,71845.1
Total votes128,051 100.0
Turnout {{{votes}}}
Democratic win (new seat)

1934

United States House of Representatives elections, 1934 [18]
PartyCandidateVotes%
Democratic John F. Dockweiler (inc.) 119,332 100.0
Turnout
Democratic hold

1936

United States House of Representatives elections, 1936 [19]
PartyCandidateVotes%
Democratic John F. Dockweiler (inc.) 90,986 57.7
Republican Raymond V. Darby66,58342.3
Total votes157,569 100.0
Turnout {{{votes}}}
Democratic hold

1938

United States House of Representatives elections, 1938 [20]
PartyCandidateVotes%
Republican Leland M. Ford 97,407 62.8
Democratic John F. Dockweiler (write-in)32,86321.2
Townsend Ted E. Felt16,04510.3
Progressive J. Barton Huthins6,6434.3
Communist La Rue McCormick2,0701.3
Total votes155,028 100.0
Turnout {{{votes}}}
Republican gain from Democratic

1940

United States House of Representatives elections, 1940 [21]
PartyCandidateVotes%
Republican Leland M. Ford 188,049 96.4
Communist George C. Sandy7,0173.6
Total votes195,066 100.0
Turnout {{{votes}}}
Republican gain from Democratic

1942

United States House of Representatives elections, 1942 [22]
PartyCandidateVotes%
Democratic Will Rogers Jr. 61,437 53.7
Republican Leland M. Ford (incumbent)52,02345.4
Communist Allen L. Ryan1,0430.9
Total votes114,503 100.0
Turnout {{{votes}}}
Democratic gain from Republican

1944

United States House of Representatives elections, 1944 [23]
PartyCandidateVotes%
Democratic Ellis E. Patterson (inc.) 105,835 54.1
Republican Jesse Randolph Kellems89,70045.9
Total votes195,535 100.0
Turnout {{{votes}}}
Democratic hold

1946

United States House of Representatives elections, 1946 [24]
PartyCandidateVotes%
Republican Donald L. Jackson 78,264 53.9
Democratic Harold Harby45,95131.7
Democratic Ellis E. Patterson (write-in)20,94514.4
Total votes145,160 100.0
Turnout {{{votes}}}
Republican gain from Democratic

1948

United States House of Representatives elections, 1948 [25]
PartyCandidateVotes%
Republican Donald L. Jackson (inc.) 121,198 57
Democratic Ellis E. Patterson91,26843
Total votes212,466 100
Turnout {{{votes}}}
Republican hold

1950

United States House of Representatives elections, 1950 [26]
PartyCandidateVotes%
Republican Donald L. Jackson (inc.) 115,970 59.3
Democratic S. Mark Hogue79,74440.7
Total votes195,714 100.0
Turnout {{{votes}}}
Republican hold

1952

United States House of Representatives elections, 1952 [27]
PartyCandidateVotes%
Republican Donald L. Jackson (inc.) 79,127 59.7
Democratic S. Mark Hogue53,33740.3
Total votes132,464 100.0
Turnout {{{votes}}}
Republican hold

1954

United States House of Representatives elections, 1954 [28]
PartyCandidateVotes%
Republican Donald L. Jackson (inc.) 63,124 60.8
Democratic S. Mark Hogue40,65939.2
Total votes103,783 100.0
Turnout {{{votes}}}
Republican hold

1956

United States House of Representatives elections, 1956 [29]
PartyCandidateVotes%
Republican Donald L. Jackson (inc.) 84,050 60.8
Democratic G. Robert "Bob" Fleming53,62439.2
Total votes137,674 100.0
Turnout {{{votes}}}
Republican hold

1958

United States House of Representatives elections, 1958 [30]
PartyCandidateVotes%
Republican Donald L. Jackson (inc.) 70,724 57.8
Democratic Melvin Lennard51,61642.2
Total votes122,340 100.0
Turnout {{{votes}}}
Republican hold

1960

United States House of Representatives elections, 1960 [31]
PartyCandidateVotes%
Republican Alphonzo E. Bell Jr. 83,601 55.4
Democratic Jerry Pacht67,31844.6
Total votes150,919 100.0
Turnout {{{votes}}}
Republican hold

1962

United States House of Representatives elections, 1962 [32]
PartyCandidateVotes%
Democratic Bernice F. Sisk (incumbent) 108,339 71.8
Republican Arthur L. Selland 42,40128.2
Total votes150,740 100.0
Turnout {{{votes}}}
Democratic hold

1964

United States House of Representatives elections, 1964 [33]
PartyCandidateVotes%
Democratic Bernice F. Sisk (incumbent) 117,727 66.8
Republican David T. Harris58,60433.2
Total votes176,331 100.0
Turnout {{{votes}}}
Democratic hold

1966

United States House of Representatives elections, 1966 [34]
PartyCandidateVotes%
Democratic Bernice F. Sisk (incumbent) 118,063 71.4
Republican Cecil F. White 47,32928.6
Total votes165,392 100.0
Turnout {{{votes}}}
Democratic hold

1968

United States House of Representatives elections, 1968 [35]
PartyCandidateVotes%
Democratic Bernice F. Sisk (incumbent) 97,473 62.5
Republican Dave Harris55,19235.4
American Independent John P. Carroll3,3902.2
Total votes156,055 100.0
Turnout {{{votes}}}
Democratic hold

1970

United States House of Representatives elections, 1970 [36]
PartyCandidateVotes%
Democratic Bernice F. Sisk (incumbent) 95,118 66.4
Republican Phillip V. Sanchez43,84330.6
American Independent James W. Scott4,2373.0
Total votes143,198 100.0
Turnout {{{votes}}}
Democratic hold

1972

United States House of Representatives elections, 1972 [37]
PartyCandidateVotes%
Democratic Bernice F. Sisk (incumbent) 134,079 79.1
Republican Carol Harner35,38420.9
Total votes169,463 100.0
Turnout {{{votes}}}
Democratic hold

1974

United States House of Representatives elections, 1974 [38]
PartyCandidateVotes%
Republican Burt L. Talcott (incumbent) 76,084 49.2
Democratic Julian Camacho74,01847.8
American Independent D. Jeff Mauro4,5763.0
Total votes154,678 100.0
Turnout {{{votes}}}
Republican hold

1976

United States House of Representatives elections, 1976 [39]
PartyCandidateVotes%
Democratic Leon Panetta 104,545 53.4
Republican Burt L. Talcott (incumbent)91,16046.6
Total votes195,705 100.0
Turnout {{{votes}}}
Democratic gain from Republican

1978

United States House of Representatives elections, 1978 [40]
PartyCandidateVotes%
Democratic Leon Panetta (incumbent) 104,550 61.4
Republican Eric Seastrand65,80838.6
Total votes170,358 100.0
Turnout {{{votes}}}
Democratic hold

1980

United States House of Representatives elections, 1980 [41]
PartyCandidateVotes%
Democratic Leon Panetta (incumbent) 158,360 71.0
Republican W. A. "Jack" Roth54,67524.5
Libertarian Kenton H. Bowers6,8023.0
Peace and Freedom D. Jeff Mauro3,1981.4
Total votes223,035 100.0
Turnout {{{votes}}}
Democratic hold

1982

United States House of Representatives elections, 1982 [42]
PartyCandidateVotes%
Democratic Leon Panetta (incumbent) 142,630 85.4
Republican Gary Richard Arnold24,44814.6
Total votes167,078 100.0
Turnout {{{votes}}}
Democratic hold

1984

United States House of Representatives elections, 1984 [43]
PartyCandidateVotes%
Democratic Leon Panetta (incumbent) 153,377 70.8
Republican Patricia Smith Ramsey60,06527.7
Libertarian Bill Anderson3,2451.5
Total votes216,687 100.0
Turnout {{{votes}}}
Democratic hold

1986

United States House of Representatives elections, 1986 [44]
PartyCandidateVotes%
Democratic Leon Panetta (incumbent) 128,151 78.4
Republican Louis Darrigo31,38619.2
Peace and Freedom Ron Wright2,0171.2
Libertarian Bill Anderson1,9441.2
Total votes163,498 100.0
Turnout {{{votes}}}
Democratic hold

1988

United States House of Representatives elections, 1988 [45]
PartyCandidateVotes%
Democratic Leon Panetta (incumbent) 177,452 78.6
Republican Stanley K. Monteith 48,37521.4
Total votes225,827 100.0
Turnout {{{votes}}}
Democratic hold

1990

United States House of Representatives elections, 1990 [46]
PartyCandidateVotes%
Democratic Leon Panetta (incumbent) 134,236 74.2
Republican Jerry M. Reiss39,88522.0
Libertarian Brian H. Tucker6,8813.8
Total votes181,002 100.0
Turnout {{{votes}}}
Democratic hold

1992

United States House of Representatives elections, 1992 [47]
PartyCandidateVotes%
Democratic Don Edwards (incumbent) 96,661 62
Republican Ted Bundesen49,84332
Peace and Freedom Amani S. Kummba9,3706
No partyHunt (write-in)50
No partyLoeber (write-in)30
No partyJames (write-in)10
Total votes155,883 100.0
Turnout {{{votes}}}
Democratic hold

1994

United States House of Representatives elections, 1994 [48]
PartyCandidateVotes%
Democratic Zoe Lofgren 74,935 64.96
Republican Lyle J. Smith40,40935.03
No partyBarraza (write-in)80.01
Total votes115,352 100.0
Turnout {{{votes}}}
Democratic hold

1996

United States House of Representatives elections, 1996 [49]
PartyCandidateVotes%
Democratic Zoe Lofgren (incumbent) 94,020 65.7
Republican Chuck Wojslaw43,19730.2
Libertarian David Bonino4,1242.8
Natural Law Abaan Abu-Shumays1,8661.3
Total votes143,207 100.0
Turnout {{{votes}}}
Democratic hold

1998

United States House of Representatives elections, 1998 [50]
PartyCandidateVotes%
Democratic Zoe Lofgren (incumbent) 85,503 72.82
Republican Horace Eugene Thayn27,49423.42
Natural Law John H. Black4,4173.76
Total votes117,414 100.0
Turnout {{{votes}}}
Democratic hold

2000

United States House of Representatives elections, 2000 [51]
PartyCandidateVotes%
Democratic Zoe Lofgren (incumbent) 115,118 72.1
Republican Horace "Gene" Thayn37,21323.3
Libertarian Dennis Michael Umphress4,7423.0
Natural Law Edward J. Klein2,6731.6
Total votes159,746 100.0
Turnout {{{votes}}}
Democratic hold

2002

United States House of Representatives elections, 2002 [52]
PartyCandidateVotes%
Democratic Zoe Lofgren (incumbent) 72,370 67.1
Republican Douglas Adams McNea32,18229.8
Libertarian Dennis Michael Umphress3,4343.1
Total votes104,556 100.0
Turnout {{{votes}}}
Democratic hold

2004

United States House of Representatives elections, 2004 [53]
PartyCandidateVotes%
Democratic Zoe Lofgren (incumbent) 129,222 70.9
Republican Lawrence R. Wiesner47,99226.4
Libertarian Markus Welch5,0672.7
Total votes182,281 100.0
Turnout {{{votes}}}
Democratic hold

2006

United States House of Representatives elections, 2006 [54]
PartyCandidateVotes%
Democratic Zoe Lofgren (incumbent) 98,929 72.8
Republican Charel Winston37,13027.2
Total votes136,059 100.0
Turnout {{{votes}}}
Democratic hold

2008

United States House of Representatives elections, 2008 [55]
PartyCandidateVotes%
Democratic Zoe Lofgren (incumbent) 146,481 71.3
Republican Charel Winston49,39924.1
Libertarian Steven Wells9,4474.6
Total votes205,327 100.0
Turnout {{{votes}}}
Democratic hold

2010

United States House of Representatives elections, 2010 [56]
PartyCandidateVotes%
Democratic Zoe Lofgren (incumbent) 105,841 67.82
Republican Daniel Sahagun37,91324.29
Libertarian Edward Gonzalez12,3047.89
Total votes156,058 100.00
Turnout {{{votes}}}
Democratic hold

2012

United States House of Representatives elections, 2012 [57]
PartyCandidateVotes%
Democratic Jim Costa (incumbent) 84,649 57%
Republican Brian Daniel Whelan62,80143%
Total votes147,450 100.0%
Democratic hold

2014

United States House of Representatives elections, 2014 [58]
PartyCandidateVotes%
Democratic Jim Costa (incumbent) 46,277 51%
Republican Johnny Tacherra44,94349%
Total votes91,220 100.0%
Democratic hold

2016

United States House of Representatives elections, 2016
PartyCandidateVotes%
Democratic Jim Costa (incumbent) 97,473 58%
Republican Johnny Tacherra70,48342%
Total votes167,956 100.0%
Democratic hold

2018

United States House of Representatives elections, 2018
PartyCandidateVotes%
Democratic Jim Costa (incumbent) 82,266 58%
Republican Elizabeth Heng60,69342%
Total votes142,959 100.0%
Democratic hold

2020

2020 United States House of Representatives elections in California
PartyCandidateVotes%
Democratic Jim Costa (incumbent) 128,690 59.4
Republican Kevin Cookingham88,03940.6
Total votes216,729 100.0
Democratic hold

2022

2022 United States House of Representatives elections in California
PartyCandidateVotes%
Democratic Anna Eshoo (incumbent) 139,235 57.8
Democratic Rishi Kumar101,77242.2
Total votes241,007 100.0
Democratic hold

Historical district boundaries

2003 - 2013 CA-16th.png
2003 - 2013
2013 - 2023 California US Congressional District 16 (since 2013).tif
2013 - 2023

See also

Related Research Articles

California's 48th congressional district is a congressional district in the U.S. state of California based in San Diego County in Southern California. It is currently represented by Republican Darrell Issa.

California's 9th congressional district is a congressional district in the U.S. state of California. Josh Harder, a Democrat, has represented the district since January 2023.

California's 10th congressional district is a congressional district in the U.S. state of California. Currently, the 10th district encompasses parts of the eastern San Francisco Bay Area. It is currently represented by Democrat Mark DeSaulnier.

<span class="mw-page-title-main">California's 38th congressional district</span> U.S. House district for California

California's 38th congressional district is a congressional district in the U.S. state of California based in suburban eastern Los Angeles County and Orange County, California. The district is currently represented by Democrat Linda Sánchez.

<span class="mw-page-title-main">California's 37th congressional district</span> U.S. House district for California

California's 37th congressional district is a congressional district in the U.S. state of California based in Los Angeles County. It includes many neighborhoods west and southwest of Downtown Los Angeles.

California's 18th congressional district is a congressional district located in the U.S. state of California. The district is currently represented by Democrat Zoe Lofgren. Since the 2022 election, the district is landlocked and includes all of San Benito County and parts of Santa Clara and Monterey counties, including Salinas, Hollister, Watsonville, Gilroy, Soledad, and downtown and eastern San Jose.

<span class="mw-page-title-main">California's 41st congressional district</span> U.S. House district for California

California's 41st congressional district is a congressional district in Riverside County, in the U.S. state of California. The district is currently represented by Republican Ken Calvert.

California's 14th congressional district is a congressional district in the U.S. state of California. Eric Swalwell, a Democrat, has represented the district since January 2023.

California's 17th congressional district is a congressional district in the U.S. state of California that is currently represented by Ro Khanna. It is located in the South Bay and East Bay regions of the San Francisco Bay Area.

California's 19th congressional district is a congressional district in the U.S. state of California, currently represented by Democrat Jimmy Panetta.

California's 24th congressional district is a congressional district in the U.S. state of California. The district is currently represented by Salud Carbajal. It contains all of Santa Barbara County, most of San Luis Obispo County, and part of Ventura County. Cities in the district include Santa Barbara, Ventura, San Luis Obispo, Santa Maria, and Ojai.

<span class="mw-page-title-main">California's 28th congressional district</span> U.S. House district for California

California's 28th congressional district is a congressional district in the U.S. state of California, in Los Angeles County. The district is regarded as a Democratic stronghold and has been held by the Democratic Party since 2003 and is currently represented by Democrat Judy Chu.

<span class="mw-page-title-main">California's 30th congressional district</span> U.S. House district for California

California's 30th congressional district is a congressional district in the U.S. state of California. The 30th district takes in all of Burbank and Glendale, the Linda Vista neighborhood of Pasadena, and the Los Angeles communities of Tujunga, Hollywood, West Hollywood, Edendale, Park La Brea, Hancock Park, and westside Echo Park. The district is currently represented by Democrat Adam Schiff.

California's 31st congressional district is a congressional district in Los Angeles County, in the U.S. state of California. The district is located in the San Gabriel Valley.

<span class="mw-page-title-main">California's 33rd congressional district</span> U.S. House district for California

California's 33rd congressional district is a congressional district in the U.S. state of California. The district is currently represented by Democrat Pete Aguilar.

<span class="mw-page-title-main">California's 35th congressional district</span> U.S. House district for California

California's 35th congressional district is a U.S. congressional district in California. The district is currently represented by Democrat Norma Torres.

<span class="mw-page-title-main">California's 36th congressional district</span> U.S. House district for California

California's 36th congressional district is a U.S. congressional district in California. The 36th district is located primarily in the South Bay and Westside regions of Los Angeles. It takes in the cities of Beverly Hills, Santa Monica, the west side of Culver City, Hermosa Beach, Rancho Palos Verdes, Redondo Beach, Palos Verdes Estates, Rolling Hills Estates, El Segundo, Lomita, Manhattan Beach, and the west side of Torrance, as well as the Los Angeles neighborhoods of Venice, Playa del Rey, Palms, Cheviot Hills, Westwood Village, West Los Angeles, Mar Vista, Westchester, Marina Peninsula, and west side Harbor City.

California's 40th congressional district is a congressional district in the U.S. state of California, encompassing Orange, San Bernardino, and Riverside counties. The district is currently represented by Republican Young Kim. It was one of 18 districts that would have voted for Joe Biden in the 2020 presidential election had they existed in their current configuration while being won or held by a Republican in 2022.

<span class="mw-page-title-main">California's 42nd congressional district</span> U.S. House district for California

California's 42nd congressional district is a U.S. congressional district in California. The district is currently represented by Democrat Robert Garcia.

<span class="mw-page-title-main">California's 45th congressional district</span> U.S. House district for California

California's 45th congressional district is a congressional district in the U.S. state of California currently represented by Republican Michelle Steel. It was one of 18 districts that would have voted for Joe Biden in the 2020 presidential election had they existed in their current configuration while being won or held by a Republican in 2022.

References

  1. "My Congressional District".
  2. "2022 Cook PVI: District Map and List". Cook Political Report. Retrieved January 10, 2023.
  3. Kamal, Sameea (December 21, 2021). "California redistricting: What to know about the final maps". Calmatters.
  4. "CA 2022 Congressional". Dave's Redistricting. January 4, 2022. Retrieved November 11, 2022.
  5. Statement of Vote (2000 President) Archived May 20, 2011, at the Wayback Machine
  6. Statement of Vote (2000 Senator) Archived May 20, 2011, at the Wayback Machine
  7. Statement of Vote (2002 Governor) Archived November 11, 2010, at the Wayback Machine
  8. Statement of Vote (2003 Recall Question) Archived May 20, 2011, at the Wayback Machine
  9. Statement of Vote (2003 Governor) Archived May 20, 2011, at the Wayback Machine
  10. Statement of Vote (2004 President) Archived May 20, 2011, at the Wayback Machine
  11. Statement of Vote (2004 Senator) Archived August 10, 2011, at the Wayback Machine
  12. Statement of Vote (2006 Governor) Archived August 10, 2011, at the Wayback Machine
  13. Statement of Vote (2006 Senator) Archived August 10, 2011, at the Wayback Machine
  14. (2008 President) Archived February 14, 2009, at the Wayback Machine
  15. "Counties by Congressional District for Recall Question" (PDF). sos.ca.gov. September 14, 2021. Retrieved May 2, 2022.
  16. "Counties by Congressional Districts for Governor" (PDF). sos.ca.gov. November 8, 2022. Retrieved May 4, 2023.
  17. 1932 election results
  18. 1934 election results
  19. 1936 election results
  20. 1938 election results
  21. 1940 election results
  22. 1942 election results
  23. 1944 election results
  24. 1946 election results
  25. 1948 election results
  26. 1950 election results
  27. 1952 election results
  28. 1954 election results
  29. 1956 election results
  30. 1958 election results
  31. 1960 election results
  32. 1962 election results
  33. 1964 election results
  34. 1966 election results
  35. 1968 election results
  36. 1970 election results
  37. 1972 election results
  38. 1974 election results
  39. 1976 election results
  40. 1978 election results
  41. 1980 election results
  42. 1982 election results
  43. 1984 election results
  44. 1986 election results
  45. 1988 election results
  46. 1990 election results
  47. 1992 election results
  48. 1994 election results
  49. 1996 election results
  50. 1998 election results
  51. 2000 election results
  52. 2002 general election results Archived February 3, 2009, at the Wayback Machine
  53. 2004 general election results [ dead link ]
  54. 2006 general election results Archived November 27, 2008, at the Wayback Machine
  55. 2006 Office of the Clerk of the United States House of Representatives [ permanent dead link ] "Statistics of the Congressional Election of November 4, 2008" (retrieved on August 8, 2009).
  56. 2010 Office of the Clerk of the United States House of Representatives [ permanent dead link ] "Statistics of the Congressional Election of November 2, 2010" (retrieved on March 24, 2011).
  57. 2012 general election results Archived October 19, 2013, at the Wayback Machine
  58. U.S. House of Representatives District 16 - Districtwide Results Archived December 21, 2014, at the Wayback Machine

37°06′34″N120°31′18″W / 37.10944°N 120.52167°W / 37.10944; -120.52167