Climate of Tamil Nadu

Last updated

Agasthiyamalai range and Tirunelveli rainshadow.jpg
A semi-arid wasteland near Tirunelveli, Tamil Nadu. Monsoon clouds dump torrents of rain on lush forests only kilometres away in windward-facing Kerala. The Agasthyamalai Range mostly stops them from reaching Tirunelveli.
Monsoon season beach Tamil Nadu India.jpg
Late-season monsoonal sunset, Coromandel Coast
Chill climate view.jpg
Chill climate view of tamilnadu from a house

The Climate of Tamil Nadu, India is generally tropical and features fairly hot temperatures over the year except during the monsoon seasons. The city of Chennai lies on the thermal equator, [1] which means Chennai and Tamil Nadu does not have that much temperature variation.

Contents

History

Under the Köppen climate classification the greater part of Tamil Nadu fills under Tropical savanna climate and smaller portions of the state fall under Humid subtropical climate; the climate of the state ranges from dry sub-humid to semi-arid.

Seasons

Summer

The summer in Tamil Nadu runs throughout March, April and May and is characterized by intense heat and scant rainfall across the state.

Monsoon

The state has three distinct periods of rainfall: advanced rainfall; rainfall from the tropical cyclones emerging in the neighbourhood of the Andaman Islands during the Retreat of Monsoons(October–November): and the North-East monsoon during the months of October–December, with dominant northeast monsoon winds from the western disturbances emerging over the Bay of Bengal. The dry season is from February to early June. Mid-June to December is the monsoon months.

Since the state is entirely dependent on rains for recharging its water resources, monsoon failures lead to acute water scarcity and severe droughts.

Tamil Nadu is classified into seven agro-climatic zones: north-east, north-west, west, southern, high rainfall, high altitude hilly, and Cauvery Delta (the most fertile agricultural zone).

Statistics

Temperature

Average temperatures in various cities of Tamil Nadu (°C) [2] [3] [4]
Winter
(Jan
– Feb)
Summer
(Mar – May)
Monsoon
(Jun – Sep)
Post-monsoon
(Oct – Dec)
Year-round
CityJanFebMarAprMayJunJulAugSepOctNovDecAvg
Chennai 24252729313030282726252431
Coimbatore 25262829292725262524232429
Madurai 25272931323029282725242532
Tiruchirapalli 25262829313230292927252432

Precipitation

Average precipitation in various cities of Tamil Nadu (mm) [2] [3] [4]
Winter
(Jan – Feb)
Summer
(Mar – May)
Monsoon 1
(Jun – Sep)
Monsoon 2
(Oct – Dec)
Year-round
CityJanFebMarAprMayJunJulAugSepOctNovDecTotal
Chennai
Coimbatore
Madurai
Tiruchirappalli

Weatherboxes

Climate data for Chennai (Köppen Aw)
MonthJanFebMarAprMayJunJulAugSepOctNovDecYear
Record high °C (°F)34.4
(93.9)
36.7
(98.1)
40.6
(105.1)
42.8
(109.0)
45.0
(113.0)
43.3
(109.9)
41.1
(106.0)
40.0
(104.0)
38.9
(102.0)
39.4
(102.9)
35.4
(95.7)
33.0
(91.4)
45.0
(113.0)
Mean daily maximum °C (°F)29.3
(84.7)
30.9
(87.6)
32.9
(91.2)
34.5
(94.1)
37.1
(98.8)
37.0
(98.6)
35.3
(95.5)
34.7
(94.5)
34.2
(93.6)
32.1
(89.8)
29.9
(85.8)
28.9
(84.0)
33.1
(91.6)
Daily mean °C (°F)25.2
(77.4)
26.6
(79.9)
28.7
(83.7)
30.9
(87.6)
32.9
(91.2)
32.4
(90.3)
30.9
(87.6)
30.3
(86.5)
29.8
(85.6)
28.4
(83.1)
26.5
(79.7)
25.3
(77.5)
29.0
(84.2)
Mean daily minimum °C (°F)21.2
(70.2)
22.2
(72.0)
24.2
(75.6)
26.6
(79.9)
28.0
(82.4)
27.5
(81.5)
26.4
(79.5)
25.9
(78.6)
25.6
(78.1)
24.6
(76.3)
23.1
(73.6)
21.9
(71.4)
24.8
(76.6)
Record low °C (°F)13.9
(57.0)
15.0
(59.0)
16.7
(62.1)
20.0
(68.0)
21.1
(70.0)
20.6
(69.1)
21.0
(69.8)
20.5
(68.9)
20.6
(69.1)
16.7
(62.1)
15.0
(59.0)
13.9
(57.0)
13.9
(57.0)
Average rainfall mm (inches)25.9
(1.02)
3.4
(0.13)
3.5
(0.14)
14.4
(0.57)
34.2
(1.35)
55.8
(2.20)
103.8
(4.09)
126.8
(4.99)
147.7
(5.81)
315.6
(12.43)
399.9
(15.74)
177.4
(6.98)
1,382.9
(54.44)
Average rainy days1.40.80.30.81.84.06.57.77.310.911.55.858.8
Average relative humidity (%) (at 17:30 IST)67666770686365667176767169
Average dew point °C (°F)20
(68)
20
(68)
22
(72)
24
(75)
24
(75)
23
(73)
23
(73)
23
(73)
24
(75)
24
(75)
23
(73)
21
(70)
23
(73)
Mean monthly sunshine hours 232.5240.1291.4294.0300.7234.0142.6189.1195.0257.3261.0210.82,848.5
Mean daily sunshine hours 7.58.59.49.89.77.84.66.16.58.38.76.87.8
Average ultraviolet index 7778888776777
Source 1: Indian Meteorological Department
Source 2: Japan Meteorological Agency [5] Weather Atlas [6] Time and Date (dewpoints, 2005-2015) [7]
Climate data for Coimbatore (Köppen BSh)
MonthJanFebMarAprMayJunJulAugSepOctNovDecYear
Record high °C (°F)35.9
(96.6)
38.8
(101.8)
40.8
(105.4)
42.6
(108.7)
41.2
(106.2)
38.0
(100.4)
36.2
(97.2)
36.0
(96.8)
37.8
(100.0)
36.8
(98.2)
34.2
(93.6)
34.4
(93.9)
42.6
(108.7)
Mean daily maximum °C (°F)30.8
(87.4)
33.6
(92.5)
36.0
(96.8)
36.7
(98.1)
35.4
(95.7)
32.4
(90.3)
31.6
(88.9)
31.9
(89.4)
32.7
(90.9)
31.9
(89.4)
30.1
(86.2)
29.6
(85.3)
32.7
(90.9)
Mean daily minimum °C (°F)18.8
(65.8)
19.8
(67.6)
21.8
(71.2)
23.7
(74.7)
23.7
(74.7)
22.6
(72.7)
22.0
(71.6)
22.0
(71.6)
22.1
(71.8)
22.0
(71.6)
20.9
(69.6)
19.0
(66.2)
21.5
(70.7)
Record low °C (°F)12.2
(54.0)
12.8
(55.0)
15.8
(60.4)
18.2
(64.8)
15.6
(60.1)
18.3
(64.9)
16.1
(61.0)
16.1
(61.0)
16.7
(62.1)
15.9
(60.6)
14.1
(57.4)
12.4
(54.3)
12.2
(54.0)
Average rainfall mm (inches)7.5
(0.30)
4.2
(0.17)
25.7
(1.01)
43.6
(1.72)
55.2
(2.17)
23.7
(0.93)
25.3
(1.00)
36.1
(1.42)
52.8
(2.08)
157.5
(6.20)
134.6
(5.30)
33.3
(1.31)
599.5
(23.61)
Average rainy days0.40.61.32.93.52.72.92.83.58.26.62.237.6
Average relative humidity (%) (at 17:30 IST)41333142566668686667645354
Source: India Meteorological Department [8] [9]
Climate data for Madurai (Köppen Aw/As/BSh)
MonthJanFebMarAprMayJunJulAugSepOctNovDecYear
Record high °C (°F)39.1
(102.4)
38.5
(101.3)
41.7
(107.1)
42.1
(107.8)
44.5
(112.1)
42.2
(108.0)
40.6
(105.1)
40.0
(104.0)
39.8
(103.6)
40.0
(104.0)
38.0
(100.4)
37.0
(98.6)
44.5
(112.1)
Mean daily maximum °C (°F)30.8
(87.4)
33.3
(91.9)
36.0
(96.8)
37.2
(99.0)
37.9
(100.2)
37.2
(99.0)
36.5
(97.7)
36.2
(97.2)
35.1
(95.2)
33.1
(91.6)
30.6
(87.1)
30.0
(86.0)
34.5
(94.1)
Mean daily minimum °C (°F)19.6
(67.3)
21.5
(70.7)
23.4
(74.1)
25.6
(78.1)
26.3
(79.3)
26.2
(79.2)
25.9
(78.6)
25.5
(77.9)
24.6
(76.3)
23.7
(74.7)
22.7
(72.9)
21.3
(70.3)
23.9
(75.0)
Record low °C (°F)15.6
(60.1)
10.5
(50.9)
16.9
(62.4)
19.4
(66.9)
17.8
(64.0)
17.8
(64.0)
19.4
(66.9)
20.6
(69.1)
18.5
(65.3)
18.9
(66.0)
17.2
(63.0)
16.7
(62.1)
10.5
(50.9)
Average precipitation mm (inches)8.5
(0.33)
11.0
(0.43)
18.3
(0.72)
60.1
(2.37)
80.6
(3.17)
34.3
(1.35)
56.9
(2.24)
93.9
(3.70)
121.5
(4.78)
185.8
(7.31)
147.2
(5.80)
51.3
(2.02)
869.4
(34.23)
Average precipitation days0.81.11.23.34.02.22.94.66.69.76.83.446.6
Average relative humidity (%)77777672706870717176787874
Average ultraviolet index 7788888877667
Source 1: Indian Meteorological Department Mean data from 1981–2010 [10] [11]
Source 2: Weather Atlas [12]
Climate data for Tiruchirappalli (Köppen Aw/As)
MonthJanFebMarAprMayJunJulAugSepOctNovDecYear
Record high °C (°F)35.6
(96.1)
40.0
(104.0)
42.2
(108.0)
42.8
(109.0)
43.3
(109.9)
43.9
(111.0)
41.1
(106.0)
40.6
(105.1)
40.6
(105.1)
38.9
(102.0)
36.7
(98.1)
35.6
(96.1)
43.9
(111.0)
Mean daily maximum °C (°F)30.3
(86.5)
32.8
(91.0)
35.7
(96.3)
37.5
(99.5)
38.2
(100.8)
37.1
(98.8)
36.3
(97.3)
35.8
(96.4)
35.0
(95.0)
32.8
(91.0)
30.4
(86.7)
29.6
(85.3)
34.3
(93.7)
Mean daily minimum °C (°F)20.6
(69.1)
21.5
(70.7)
23.5
(74.3)
26.1
(79.0)
26.8
(80.2)
26.6
(79.9)
26.1
(79.0)
25.7
(78.3)
24.9
(76.8)
24.2
(75.6)
22.8
(73.0)
21.2
(70.2)
24.2
(75.6)
Record low °C (°F)14.4
(57.9)
13.9
(57.0)
15.6
(60.1)
18.3
(64.9)
19.4
(66.9)
18.0
(64.4)
20.1
(68.2)
20.6
(69.1)
20.6
(69.1)
18.9
(66.0)
16.7
(62.1)
14.4
(57.9)
13.9
(57.0)
Average rainfall mm (inches)13.3
(0.52)
3.6
(0.14)
5.3
(0.21)
29.6
(1.17)
67.0
(2.64)
38.3
(1.51)
60.5
(2.38)
69.9
(2.75)
153.4
(6.04)
153.9
(6.06)
168.0
(6.61)
81.4
(3.20)
844.2
(33.24)
Average rainy days0.90.40.61.73.82.62.74.17.19.28.15.146.3
Average relative humidity (%) (at 17:30 IST)54433741424445465264706550
Source: India Meteorological Department [13] [14]

Desert Soil

Mostly, desert soils are seen around Madurai , Virudhunagar, Sivaganga, Ramanathapuram and some parts of Tirunelveli dist, a few adjoining districts. These districts are formally known as the desert districts of Tamil Nadu.

Disasters

Floods

During the 2015 South Indian floods (most affected districts: Chennai, Kanchipuram and Cuddalore), Chennai received 1,049 mm (41.3 in) of rainfall in November, the highest recorded since November 1918 when 1,088 mm (42.8 in) of rainfall was recorded.[24][25] The flooding in Chennai was described as the worst in a century.[26]

Cyclones

2004 Asian tsunami disaster

Drought & famine

Pollution

The air quality of industrial areas in Ennore, as well as in Poes Garden and Boat Club are above the standards prescribed by the environment ministry, according to a report by Coastal Resource Centre.

The centre took eleven air samples in and around North Chennai and Chennai city as part of their air quality study in Ennore 2016. 24-hour samples were taken using filters fitted to a low volume air sampler and analysed for PM 2.5 (Particulate Matter or dust less than 2.5 micrometres in size). The key documented sources of PM 2.5 pollution are automobile exhaust, burning of coal, burning garbage and landfill, smelting processing of metals.

Surprisingly, 10 out of the 11 air samples were between 1.4 and 3.7 times higher than prescribed by the Ministry of Environment, Forests and Climate Change. The quality of air in Nallathaneer Odai Kuppam in Ennore is the highest with 220 micrograms of particulate matter per cubic meter of air.

Other areas from Ennore include Manali with 156 ug/m3, Sivanpadaiveethi Kuppam with 156. 90 ug/m3 and Kodingayur with 154.90 ug/m3 which is all considered very unhealthy according to the US Environment Protection Agency.

The Ennore region has 3300 MW of installed coal power plant capacity, with more than 1500 acres as dedicated coal ash dumps, says the report.

Highlighting the health effects of bad air quality, Dr Hissamudin Papa, Founder and Director, HUMA Hospitals said, "We visited these areas in Ennore and found various health issues. Children who are 14 to 15 years old look like they are 8 years old. Women have hormonal issues and infertility. Many people have chronic obstructive pulmonary disease in these areas. The pollution needs to be reduced in these areas.

Even areas like Poes Garden and Boat Club ranged 104 and 101 UG/ M3 which is considered unhealthy according to US EPA standards. "The high concentration of polluting industries in the city’s northern and southern edges is affecting all of Chennai," said Dr Rakhal Gaitonde, a public health specialist.

According to the report by the Coastal Resource Centre, the level of manganese in eight of the eleven samples exceed the US EPA reference concentration for exposure to manganese. There are no standards in India for manganese in ambient air. Also, the levels of calcium silicon and crystalline silica, which are enriched in coal ash were found in the air samples.

"Manganese and nickel are well-known toxins and their effects are well-documented. Manganese is predominantly a neurotoxin, while nickel is a carcinogen. The measurement of such toxic substances from the rooftops of human settlements is indeed a cause of concern," added Dr Rakhal.

The Coastal Resource Centre wants the Tamil Nadu government to take immediate action to improve the air quality in Ennore. "The government needs to impose a moratorium on all industrial activities till the environment is restored, initiate long-term and continuous monitoring in Ennore region," said Nityanand Jayaraman, an environment activist.

He added, "No norms are followed by the Tamil Nadu Pollution Control Board. Why should people living in North Chennai have to bear all the harmful effects of the industries?"

The Coastal Resource Centre also wants the government to apprehend polluters and take corrective actions to bring the levels of dust and heavy metals in the dust below detection limits in residential areas.

See also

Related Research Articles

The climate of Mumbai is an extreme version of a tropical wet and dry climate with a lengthy, practically rainless dry season and a relatively short, but extremely rainy wet season due to the Southwest Monsoon and orographic influences from the nearby Western Ghats. Some suburbs are sufficiently wet to qualify as a tropical monsoon climate. Mumbai's climate can be best described as moderately hot with a high level of humidity. Its coastal nature and tropical location ensure temperatures do not fluctuate much throughout the year.
<span class="mw-page-title-main">Climate of India</span> Overview of climatic conditions in India

The climate of India consists of a wide range of weather conditions across a vast geographic scale and varied topography. Based on the Köppen system, India hosts six major climatic sub types, ranging from arid deserts in the west, alpine tundra and glaciers in the north, and humid tropical regions supporting rain forests in the southwest and the island territories. Many regions have starkly different microclimates, making it one of the most climatically diverse countries in the world. The country's meteorological department follows the international standard of four seasons with some local adjustments: winter, summer, monsoon or rainy season, and a post-monsoon period.
<span class="mw-page-title-main">Kanchipuram district</span> District of Tamil Nadu in India

Kanchipuram district is one of the 38 districts in the state of Tamil Nadu in India. The area comprising the present day Kancheepuram district was earlier a part of Chingleput district. The original Chingleput district was split in 1997 into form the present day Kanchiepuram and Tiruvallur districts.

<span class="mw-page-title-main">Tambaram</span> A city within the Chennai Metropolitan Area

Tambaram is a city located within the Chennai Metropolitan Area in the Indian State of Tamil Nadu. The city is governed by Tambaram City Municipal Corporation.

<span class="mw-page-title-main">Dharmapuri</span> City in Tamil Nadu, India

Dharmapuri is a city in the north western part of Tamil Nadu, India. It serves as the administrative headquarters of Dharmapuri district which is the first district created in Tamil Nadu after the independence of India by splitting it from then Salem district on 2 October 1965. The city is located 50 km from Krishnagiri, 69 km from Salem, 90 km from Hosur, 117 km from Thiruvannamalai, 126 km from Bangalore and Erode, 181 km from Tiruppur, 200 km from Coimbatore and Tiruchirappalli, 300 km from Madurai and the state capital Chennai. It is located between latitudes N 11 47’ and 12 33’ and longitudes E 77 02’ and 78 40’. It is one of the major leading cultivators and producers of mangoes in the state along with Krishnagiri, and is often referred as Mango Capital of India.
<span class="mw-page-title-main">2005 North Indian Ocean cyclone season</span> Cyclone season in the North Indian ocean

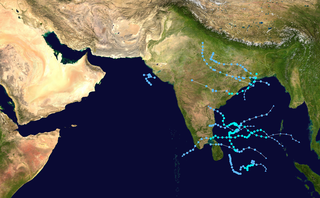
The 2005 North Indian Ocean cyclone season caused much devastation and many deaths in Southern India despite the storms’ weakness. The basin covers the Indian Ocean north of the equator as well as inland areas, sub-divided by the Arabian Sea and the Bay of Bengal. Although the season began early with two systems in January, the bulk of activity was confined from September to December. The official India Meteorological Department tracked 12 depressions in the basin, and the unofficial Joint Typhoon Warning Center (JTWC) monitored two additional storms. Three systems intensified into a cyclonic storm, which have sustained winds of at least 63 km/h (39 mph), at which point the IMD named them.
<span class="mw-page-title-main">Tiruttani</span> Town in Tamil Nadu, India

Tiruttani is a town in the Tiruvallur district, a suburb of Chennai within the Chennai Metropolitan Area, located in the state of Tamil Nadu, India. The town is renowned for the Tiruttani Murugan Temple, which is one of the Arupadaiveedu and is dedicated to Kartikeya (Murugan). Tiruttani was added to the Chennai Metropolitan Area in October 2022.

Mecheri is a town in Mettur taluk, Salem district, Tamil Nadu, India.

The climate of Delhi is an overlap between monsoon-influenced humid subtropical and semi-arid, with high variation between summer and winter temperatures and precipitation. Delhi's version of a humid subtropical climate is markedly different from many other humid subtropical cities such as São Paulo, Houston, and Brisbane in that the city features dust storms and wildfire haze due to its semi-arid climate.

<span class="mw-page-title-main">Climate of West Bengal</span> Climatic conditions of West Bengal

The climate of West Bengal is varied, with tropical savannahs in the southern portions of the state, to humid subtropical areas in the north. Temperatures vary widely, and there are five distinct seasons. The area is vulnerable to heavy rainfall, monsoons, and cyclones. There are some mountains in the area which are generally cold all year round.

<span class="mw-page-title-main">Geography of Chennai</span> Capital city of Tamil Nadu, India

Chennai is located at 13.04°N 80.17°E on the southeast coast of India and in the northeast corner of Tamil Nadu. It is located on a flat coastal plain known as the Eastern Coastal Plains. The city has an average elevation of 6 metres (20 ft), its highest point being 60 m (200 ft). Chennai is 2,184 kilometres south of Delhi, 1,337 kilometres southeast of Mumbai, and 1,679 kilometers southwest of Kolkata by road.

Kolkata has a Tropical wet-and-dry climate. The annual mean temperature is 26.8 °C (80 °F); monthly mean temperatures range from 15 °C to 30 °C. Summers are hot and humid with temperatures in the low 30's and during dry spells the maximum temperatures often exceed 40 °C (104 °F) during May and June. Winter tends to last for only about two and a half months, with seasonal lows dipping to 9 °C – 11 °C (48.2 °F – 51.8 °F) between December and January. The highest recorded temperature is 43.9 °C (111 °F) and the lowest is 5 °C (41 °F). Often during early summer, dusty squalls followed by spells of thunderstorm and heavy rains lash the city, bringing relief from the humid heat. These thunderstorms are convective in nature, and is locally known as Kal baisakhi.

Located in eastern India, Bihar is the twelfth-largest Indian state, with an area of 94,163 km2 (36,357 mi2) and an average elevation of about 150 metres above mean sea level. The landlocked state shares a boundary with Nepal to the north, the state of West Bengal to the east, Jharkhand to the south, and Uttar Pradesh to the west. Bihar lies in a subtropical temperate zone and its climatic type is humid subtropical.

<span class="mw-page-title-main">Climate of Gujarat</span>

The climate of Gujarat involves diverse conditions. The plains of Gujarat are very hot and humid in summer and cold and dry in winter. Summer is milder in the hilly regions and the coast. The average daytime temperature during winter is around 29 °C (84 °F) and in nights is around 12 °C (54 °F) with 100 percent sunny days and clear nights. During summers, the daytime temperature is around 49 °C (120 °F) and at night no lower than 30 °C (86 °F). The monsoon season lasts from June to September. Most of Gujarat receives scanty rainfall. Southern Gujarat and the hilly regions receive heavy rainfall during the monsoons with high humidity which makes the air feel hotter. There is relief when the monsoon season starts. The day temperatures are lowered to around 35 °C (95 °F) but humidity is very high and nights are around 27 °C (81 °F). Most of the rainfall occurs in this season, and the rain can cause severe Floods. The sun is often occluded during the monsoon season. Though mostly dry, it is desertic in the north-west, and wet in the southern districts due to a heavy monsoon season.

Pamban is a town in the Rameswaram taluk of Ramanathapuram district, Tamil Nadu. It is at the west edge of Pamban Island and is a popular fishing port. The town gives its name to the whole island. Pamban railway station is the first station on the island for pilgrims travelling to Rameswaram.

<span class="mw-page-title-main">Climate of Agra</span>

The climate of Agra features a semi-arid climate that borders on a humid subtropical climate. The city features mild winters, hot and dry summers and a monsoon season. The monsoon, though substantial in Agra, is not quite as heavy as the monsoon in other parts of India. The average monsoon rainfall during June to September is 628.6 millimeters. Agra is reputation of being one of the hottest and the coldest towns in India. In summers the city witnesses a sudden surge in temperature and at times, mercury goes beyond the 46 °C mark in addition to a very high level of humidity. During summer, the daytime temperature hovers around 46-50 °C. Nights are relatively cooler and temperature lowers to 30 °C. Winter minimum temperatures sometimes goes as low as 3 or 3.5 °C but usually hovers in the range of 6 to 8 °C.

The climate of Uttar Pradesh (U.P.) is primarily defined as humid subtropical with dry winter (Cwa) type with parts of Western U.P. as hot semi-arid (BSh) type. Alternatively, some authors refer to it as tropical monsoon. Variations do exist in different parts of the large state, however the uniformity of the vast Indo-Gangetic Plain forming bulk of the state gives a predominantly single climatic pattern to the state with minor regional variations. U.P. has a climate of extremes. With temperatures fluctuating anywhere from 0 °C or 32 °F to 50 °C or 122 °F in several parts of the state and cyclical droughts and floods due to unpredictable rains, the summers are extremely hot, winters are cold and the rainy season can be either very wet or very dry.

<span class="mw-page-title-main">Regional Meteorological Centre, Chennai</span> Research institute in Chennai

Regional Meteorological Centre, Chennai is one of the six regional meteorological centres (RMCs) of the India Meteorological Department (IMD) and is responsible for the weather-related activities of the southern Indian peninsula comprising the states of Andhra Pradesh, Telangana, Karnataka, Kerala, Tamil Nadu and the union territories of Andaman and Nicobar, Lakshadweep Islands and Puducherry. The other regional centres are located at Kolkata, Guwahati, Mumbai, Nagpur and New Delhi.

<span class="mw-page-title-main">Climate of Rajasthan</span> Climate of the Indian state

The climate of Rajasthan in northwestern India is generally arid or semi-arid and features fairly hot temperatures over the year with extreme temperatures in both summer and winter. The hottest months are May and June. The monsoon season is from July to September; however, rainfall remains moderate.

<span class="mw-page-title-main">Tirupattur</span> Town in Tamil Nadu, India

Tirupathur or Tirupattur is the headquarters of Tirupathur district in the state of Tamil Nadu in India and is one of the oldest inhabited places in the state, with a history of over 1,600 years. The town is known for an abundance of sandalwood in the surrounding hills. It is located about 89 km (55 mi) from Vellore, 85 km (53 mi) from Hosur, 60 km (37 mi) from Dharmapuri, 50 km (31 mi) from Krishnagiri, 50 km (31 mi) from Thiruvannamalai, 210 km (130 mi) from Chennai, and 125 km (78 mi) from Bangalore.

References

  1. "About Chennai" (PDF). Chennai Metropolitan Development Authority. p. 1. Archived from the original (PDF) on 22 September 2020. Retrieved 28 December 2012.
  2. 1 2 "Weatherbase" . Retrieved 19 October 2012.
  3. 1 2 "Wunderground". Weather Underground. Retrieved 19 October 2012.
  4. 1 2 "Weather.com". The Weather Channel . Retrieved 19 October 2012.
  5. "Normals Data". Japan Meteorological Agency. Retrieved 11 May 2020.
  6. "Climate and monthly weather forecast Chennai, India". Weather Atlas. Retrieved 13 June 2022.
  7. "Climate & Weather Averages in Chennai, Tamil Nadu, India". Time and Date. Retrieved 18 July 2022.
  8. "Extremes of Temperature & Rainfall for Indian Stations (Up to 2012)" (PDF). India Meteorological Department. December 2016. p. M193. Archived from the original (PDF) on 5 February 2020. Retrieved 7 March 2020.
  9. "Station: Coimbatore (Peeamedu) Climatological Table 1981–2010" (PDF). Climatological Normals 1981–2010. India Meteorological Department. January 2015. pp. 203–204. Archived from the original (PDF) on 5 February 2020. Retrieved 7 March 2020.
  10. "Climatology of Madurai". Indian Meteorological Department. 2011. Retrieved 11 April 2015.
  11. "Climate - Record highs and lows of Madurai" (PDF). Indian Meteorological Department. 2015. Archived from the original (PDF) on 16 March 2014. Retrieved 11 April 2015.
  12. "Climate and monthly weather forecast Madurai, India". Weather Atlas. Retrieved 19 July 2022.
  13. "Extremes of Temperature & Rainfall for Indian Stations (Up to 2012)" (PDF). India Meteorological Department. December 2016. p. M204. Archived from the original (PDF) on 5 February 2020. Retrieved 30 March 2020.
  14. "Station: Tiruchirapalli (A) Climatological Table 1981–2010" (PDF). Climatological Normals 1981–2010. India Meteorological Department. January 2015. pp. 745–746. Archived from the original (PDF) on 5 February 2020. Retrieved 30 March 2020.