Climate of Uttar Pradesh

Last updated

The climate of Uttar Pradesh (U.P.) is primarily defined as humid subtropical with dry winter (Cwa) type with parts of Western U.P. as hot semi-arid (BSh) type. Alternatively, some authors refer to it as tropical monsoon. Variations do exist in different parts of the large state. However, the uniformity of the vast Indo-Gangetic Plain forming the bulk of the state gives a predominantly single climatic pattern to the state with minor regional variations. U.P. has a climate of extremes. With temperatures fluctuating anywhere from 0 °C or 32 °F to 50 °C or 122 °F in several parts of the state and cyclical droughts and floods due to unpredictable rains, the summers are extremely hot, winters are cold and the rainy season can be either very wet or very dry.

Contents

Seasons of Uttar Pradesh

Indian Meteorological Department (IMD) breakdowns the climate of India into the following seasons: [1] [2]

  1. Winter Season / Cold Weather Season (January and February)
  2. Summer season/ Pre-monsoon season/ Hot weather season/ Thunderstorm season (March, April, May and June)
  3. South-west Monsoon/ Summer Monsoon (July, August and September)
  4. Post-monsoon or Northeast monsoon or Retreating SW Monsoon season (October, November and December)

This classification is primarily Monsoon centric given the vast effect that it casts on the lives and agriculture of India.

Classification of the Uttar Pradesh climate

The climate of Uttar Pradesh is generally defined to be tropical monsoon type. [3] However based on the Köppen climate classification, it can be classified mostly as Humid Subtropical with dry winter (CWa) type with parts of Western U.P. as Semi-Arid (BS) type (refer to map of India above)

Based on IMD classification, UP has the following three predominant seasons: [4] [5]

  1. Winter Season – November to February
  2. Summer season – March, April and May
  3. South-west Monsoon – June, July, August, September and October

Retreating Monsoon season, although existent, has a very negligible effect in Uttar Pradesh and only occasional mild showers are experienced in winter. Some of these showers are not even due to the Monsoon but due to western disturbances. [6]

The primary temperature, rainfall and wind features of the three Distinct Seasons of U.P. can be summarised below:

  1. Summer (March–June): Hot & dry (temperatures rise to 45 °C or 113 °F, sometimes 47 or 48 °C or 116.6 or 118.4 °F); low relative humidity (20%); dust laden winds.
  2. Monsoon (June–October): 85% of the average annual rainfall of 990 millimetres or 39 inches. Fall in temperature on rainy days.
  3. Winter (November–February): Cool (morning temperatures drop to 3–4 °C or 37.4–39.2 °F, sometimes below −1 °C or 30.2 °F); clear skies; foggy conditions in some tracts.

Given significant climatic differences, U.P. has been divided into two meteorological sub-divisions – U.P. East and U.P. West. [7]

Geographical terrain

The state of Uttar Pradesh is in the heart of Indo-Gangetic Plain with River Ganges flowing right through the State, Himalayas to the north, and the Chota Nagpur Plateau and the Vindhyas to the south of the State.

Temperature

Temperature varies from 0 to 46 °C (32.0 to 114.8 °F). [5] High temperatures of around 50 °C or 122 °F have been recorded in Gonda district of U.P. [3] Given such a wide range of temperature fluctuations in most parts of the state, it can lead to either cold waves or heat waves both resulting in substantial loss of life and economy.

Heat waves

In 2007, Banda with 45.5 °C or 113.9 °F temperature was the leader in terms of hot districts of U.P. for several days. [8] At least 62, people were reportedly dead during the heat wave that year. [9] In June 2009, 30 people died of heatstroke in U.P. [10] Highest temperatures reached 49 °C or 120.2 °F in Bundelkhand district of northern U.P. [11] [12] In June 2010, Jhansi recorded the highest temperature of 46.7 °C or 116.1 °F, the hottest for U.P. for that year. [13]

Cold waves

In recent years, winters at the end of 2007 and beginning of year 2008 caused a string of cold-wave related deaths in U.P. [14] with temperatures as low as 2.8 °C or 37.0 °F in the city of Meerut, U.P. Simultaneously it also led to a loss of crops and agricultural produce. Similarly last part of 2009, saw the mercury-dipping to lows of 2.9 °C or 37.2 °F in Meerut again causing loss of human life. [15] The end of 2010 and starting of 2011 were no different, with winters bringing news of cold-wave-related deaths. [16] [17] This time Churk town in Sonbhadra district ranked coldest with 1.4 °C or 34.5 °F. [16] On 13 January 2013, Kanpur recorded its all-time low temperature when the mercury plunged to −1.1 °C or 30.0 °F and on the same day Agra recorded −0.7 °C or 30.7 °F. In the month of January, in Lucknow, the temperature can plunge below freezing; Lucknow recorded 0.0 °C or 32.0 °F on 18 January 2017. Agra and Muzaffarnagar are also notorious for chilly winds and the temperature there can also go below freezing.

Precipitation

It rains over most of the U.P., with very few arid or semi-arid patches. Snowfall doesn't occur, but hail-storms, frost, and dew occur often in U.P. The type of rainfall that U.P. receives is orographic, cyclonic and convectional. [5]

Rain

Primarily a summer phenomenon, the Bay of Bengal branch of the Indian Monsoon is the major bearer of rain in most parts of U.P. It is the South-West Monsoon which brings most of the rain here, although rain due to the western disturbances [6] and North-East Monsoon also contribute small quantities towards the overall precipitation of the state. [5] The rain in U.P. can vary from an annual average of 170 cm in hilly areas to 84 cm in Western U.P. [5] Given the concentration of most of this rainfall in the 4 months of Monsoon period, excess rain can lead to floods and shortage to droughts. [3] As such, these two phenomena of floods and droughts are a common recurrence in the state.

Floods in U.P.

Floods are a known hazard of U.P. due to overflowing of its main rivers like Ganga, Yamuna, Ramganga, Gomti, Sharda, Ghaghra, Rapti and Gandak. [7] Estimated annual losses due to floods in U.P. is 4.32 billion (US$54 million). [7] Major flood management efforts have been undertaken to mitigate the risk. Most of these floods occur due to the Monsoon rains and overflowing of rivers during the rainy periods. Year 2010 witnessed one such year of flooding in U.P. [18] [19]

Droughts in Uttar Pradesh

Shortage of rain during the highly variable Monsoon season can cause droughts in U.P. leading to severe loss to man and property. Recent 2002 and 2004 drought-related financial estimates have been reported to be 75.4 billion (US$940 million) and 72.92 billion (US$910 million). [7] The recurrence of a major deficiency in annual rainfall follows a 6–8-year cycle in Eastern U.P., whereas in Western U.P., it is a 10-year cycle.

Wind

In summer, hot winds called loo blow all across U.P. They are dust-laden and quite damaging. [5] In winter, dry and rainless winds blow across the state. Fog may also form in parts of U.P. [5]

Climate data

MonthJanFebMarAprMayJunJulAugSepOctNovDecYear
Record high °C (°F)33.0
(91.4)
35.6
(96.1)
42.8
(109.0)
47.3
(117.1)
48.6
(119.5)
48.5
(119.3)
46.5
(115.7)
43.0
(109.4)
41.4
(106.5)
41.1
(106.0)
36.1
(97.0)
31.0
(87.8)
48.6
(119.5)
Mean daily maximum °C (°F)22.7
(72.9)
26.0
(78.8)
32.1
(89.8)
38.1
(100.6)
41.9
(107.4)
41.5
(106.7)
36.0
(96.8)
33.7
(92.7)
34.5
(94.1)
34.5
(94.1)
29.7
(85.5)
24.5
(76.1)
32.9
(91.2)
Mean daily minimum °C (°F)7.5
(45.5)
9.9
(49.8)
14.4
(57.9)
20.0
(68.0)
24.6
(76.3)
26.3
(79.3)
25.0
(77.0)
23.8
(74.8)
22.8
(73.0)
18.0
(64.4)
12.4
(54.3)
7.8
(46.0)
17.7
(63.9)
Record low °C (°F)−2.2
(28.0)
−1.7
(28.9)
5.6
(42.1)
10.0
(50.0)
14.0
(57.2)
12.0
(53.6)
14.5
(58.1)
12.0
(53.6)
13.0
(55.4)
9.4
(48.9)
2.8
(37.0)
−0.6
(30.9)
−2.2
(28.0)
Average rainfall mm (inches)12.4
(0.49)
12.1
(0.48)
8.8
(0.35)
12.3
(0.48)
22.6
(0.89)
81.7
(3.22)
214.9
(8.46)
230.2
(9.06)
129.6
(5.10)
29.4
(1.16)
3.4
(0.13)
3.5
(0.14)
760.7
(29.95)
Average rainy days1.31.01.20.92.03.210.410.78.01.40.40.439.0
Average relative humidity (%) (at 17:30 IST)58473935354066736349525851
Average dew point °C (°F)8
(46)
11
(52)
13
(55)
14
(57)
17
(63)
21
(70)
25
(77)
25
(77)
23
(73)
18
(64)
13
(55)
10
(50)
17
(62)
Average ultraviolet index 5679997787647
Source 1: NOAA (1971–1990), [20] World Meteorological Organization (precipitation 1901–2000) [21] India Meteorological Department [22] [23] [24] Time and Date (dewpoints, 2005-2015) [25]
Source 2: Weather Atlas [26]
Climate data for Lucknow (1981–2010, extremes 1952–2012)
MonthJanFebMarAprMayJunJulAugSepOctNovDecYear
Record high °C (°F)30.4
(86.7)
35.9
(96.6)
40.9
(105.6)
45.0
(113.0)
46.5
(115.7)
47.7
(117.9)
44.2
(111.6)
40.4
(104.7)
40.1
(104.2)
37.7
(99.9)
38.0
(100.4)
29.9
(85.8)
47.7
(117.9)
Mean maximum °C (°F)27.2
(81.0)
31.1
(88.0)
37.6
(99.7)
42.2
(108.0)
44.0
(111.2)
43.5
(110.3)
38.7
(101.7)
36.5
(97.7)
36.5
(97.7)
35.6
(96.1)
32.2
(90.0)
28.1
(82.6)
44.6
(112.3)
Mean daily maximum °C (°F)22.1
(71.8)
26.2
(79.2)
32.3
(90.1)
38.2
(100.8)
39.6
(103.3)
38.3
(100.9)
34.1
(93.4)
33.5
(92.3)
33.3
(91.9)
32.8
(91.0)
29.1
(84.4)
24.4
(75.9)
32.0
(89.6)
Mean daily minimum °C (°F)7.9
(46.2)
10.7
(51.3)
15.2
(59.4)
20.7
(69.3)
24.7
(76.5)
26.6
(79.9)
26.1
(79.0)
25.7
(78.3)
24.3
(75.7)
19.4
(66.9)
13.2
(55.8)
9.1
(48.4)
18.6
(65.5)
Mean minimum °C (°F)3.8
(38.8)
6.5
(43.7)
10.3
(50.5)
15.5
(59.9)
20.3
(68.5)
22.6
(72.7)
23.6
(74.5)
23.4
(74.1)
21.6
(70.9)
14.7
(58.5)
9.1
(48.4)
5.2
(41.4)
3.6
(38.5)
Record low °C (°F)−1.0
(30.2)
0.0
(32.0)
5.4
(41.7)
10.9
(51.6)
17.0
(62.6)
19.7
(67.5)
21.5
(70.7)
22.2
(72.0)
17.2
(63.0)
15.0
(59.0)
3.9
(39.0)
0.5
(32.9)
−1.0
(30.2)
Average rainfall mm (inches)16.7
(0.66)
16.1
(0.63)
8.6
(0.34)
5.6
(0.22)
24.4
(0.96)
107.8
(4.24)
255.3
(10.05)
213.7
(8.41)
205.6
(8.09)
44.8
(1.76)
6.4
(0.25)
12.3
(0.48)
917.3
(36.09)
Average rainy days1.31.40.90.62.05.211.810.68.41.70.60.845.3
Average relative humidity (%) (at 17:30 IST)60473325324973777465616255
Average dew point °C (°F)9
(48)
12
(54)
13
(55)
14
(57)
19
(66)
23
(73)
26
(79)
26
(79)
25
(77)
19
(66)
14
(57)
10
(50)
18
(63)
Average ultraviolet index 5791112121212108659
Source 1: India Meteorological Department [27] [28] Time and Date (dewpoints, 2005-2015) [29]
Source 2: Weather Atlas [30]
Climate data for Kanpur (1981-2010, extremes 1901-2006)
MonthJanFebMarAprMayJunJulAugSepOctNovDecYear
Record high °C (°F)31.1
(88.0)
35.6
(96.1)
42.8
(109.0)
45.6
(114.1)
47.2
(117.0)
47.3
(117.1)
45.0
(113.0)
40.6
(105.1)
40.0
(104.0)
40.6
(105.1)
36.1
(97.0)
31.3
(88.3)
47.3
(117.1)
Mean daily maximum °C (°F)22.3
(72.1)
25.4
(77.7)
32.0
(89.6)
38.0
(100.4)
39.8
(103.6)
39.0
(102.2)
33.8
(92.8)
33.2
(91.8)
33.1
(91.6)
32.5
(90.5)
28.6
(83.5)
24.4
(75.9)
31.9
(89.4)
Mean daily minimum °C (°F)8.2
(46.8)
10.6
(51.1)
15.6
(60.1)
21.1
(70.0)
25.1
(77.2)
27.2
(81.0)
26.4
(79.5)
26.1
(79.0)
24.8
(76.6)
19.0
(66.2)
12.8
(55.0)
8.7
(47.7)
18.8
(65.8)
Record low °C (°F)1.6
(34.9)
0.6
(33.1)
7.2
(45.0)
11.1
(52.0)
16.4
(61.5)
20.6
(69.1)
21.7
(71.1)
21.7
(71.1)
11.8
(53.2)
4.6
(40.3)
0.5
(32.9)
−0.9
(30.4)
−0.9
(30.4)
Average rainfall mm (inches)9.2
(0.36)
9.2
(0.36)
2.9
(0.11)
2.7
(0.11)
8.2
(0.32)
61.8
(2.43)
185.3
(7.30)
191.7
(7.55)
138.1
(5.44)
33.9
(1.33)
3.4
(0.13)
2.1
(0.08)
648.5
(25.52)
Average rainy days0.80.80.40.30.82.99.69.06.11.40.30.232.6
Average relative humidity (%) (at 17:30 IST)59463427314574777262626254
Source: India Meteorological Department [31] [32]
Climate data for Meerut (1971–2000)
MonthJanFebMarAprMayJunJulAugSepOctNovDecYear
Record high °C (°F)29.3
(84.7)
32.2
(90.0)
39.5
(103.1)
43.5
(110.3)
45.8
(114.4)
46.1
(115.0)
46.0
(114.8)
40.0
(104.0)
39.0
(102.2)
38.0
(100.4)
34.5
(94.1)
30.0
(86.0)
46.1
(115.0)
Mean daily maximum °C (°F)21.9
(71.4)
23.1
(73.6)
28.7
(83.7)
36.3
(97.3)
39.1
(102.4)
37.6
(99.7)
33.6
(92.5)
32.6
(90.7)
33.7
(92.7)
32.8
(91.0)
28.6
(83.5)
23.5
(74.3)
31.1
(88.0)
Mean daily minimum °C (°F)7.2
(45.0)
9.1
(48.4)
13.8
(56.8)
19.9
(67.8)
24.3
(75.7)
26.0
(78.8)
25.9
(78.6)
25.5
(77.9)
23.6
(74.5)
18.2
(64.8)
12.4
(54.3)
8.0
(46.4)
17.7
(63.9)
Record low °C (°F)−0.4
(31.3)
0.1
(32.2)
5.4
(41.7)
8.3
(46.9)
15.4
(59.7)
17.7
(63.9)
16.5
(61.7)
19.0
(66.2)
15.7
(60.3)
7.2
(45.0)
1.8
(35.2)
0.2
(32.4)
−0.4
(31.3)
Average precipitation mm (inches)19.7
(0.78)
24.9
(0.98)
24.4
(0.96)
12.8
(0.50)
19.1
(0.75)
71.2
(2.80)
269.0
(10.59)
264.7
(10.42)
95.4
(3.76)
25.9
(1.02)
4.3
(0.17)
13.4
(0.53)
845.0
(33.27)
Average rainy days1.51.71.70.91.63.910.29.44.21.60.40.938.0
Average relative humidity (%)88837554586881848378798676
Source: India Meteorological Department (record high and low up to 2012) [33] [34] [35] [36]
Climate data for Varanasi (1981–2010, extremes 1901–2012)
MonthJanFebMarAprMayJunJulAugSepOctNovDecYear
Record high °C (°F)31.4
(88.5)
36.1
(97.0)
41.5
(106.7)
45.2
(113.4)
47.2
(117.0)
47.2
(117.0)
45.0
(113.0)
40.1
(104.2)
39.7
(103.5)
39.4
(102.9)
36.0
(96.8)
32.8
(91.0)
47.2
(117.0)
Mean daily maximum °C (°F)22.5
(72.5)
26.5
(79.7)
32.7
(90.9)
38.8
(101.8)
40.1
(104.2)
38.3
(100.9)
33.8
(92.8)
33.0
(91.4)
32.9
(91.2)
32.4
(90.3)
29.3
(84.7)
24.7
(76.5)
32.1
(89.8)
Mean daily minimum °C (°F)8.9
(48.0)
11.7
(53.1)
16.3
(61.3)
21.6
(70.9)
25.3
(77.5)
27.1
(80.8)
25.9
(78.6)
25.6
(78.1)
24.6
(76.3)
20.3
(68.5)
14.0
(57.2)
9.8
(49.6)
19.3
(66.7)
Record low °C (°F)1.0
(33.8)
1.7
(35.1)
6.7
(44.1)
11.1
(52.0)
17.3
(63.1)
20.5
(68.9)
20.0
(68.0)
20.4
(68.7)
17.8
(64.0)
11.7
(53.1)
5.0
(41.0)
2.2
(36.0)
1.0
(33.8)
Average rainfall mm (inches)16.7
(0.66)
22.8
(0.90)
9.2
(0.36)
5.7
(0.22)
16.8
(0.66)
106.8
(4.20)
260.9
(10.27)
280.8
(11.06)
228.9
(9.01)
29.0
(1.14)
7.2
(0.28)
4.2
(0.17)
989.0
(38.94)
Average rainy days1.51.80.70.71.75.212.912.59.11.90.40.448.7
Average relative humidity (%) (at 17:30 IST)63503525315074787768666657
Mean monthly sunshine hours 232.5240.1291.4294.0300.7234.0142.6189.1195.0257.3261.0210.82,848.5
Mean daily sunshine hours 7.58.59.49.89.77.84.66.16.58.38.76.87.8
Average ultraviolet index 67101112121212118659
Source 1: India Meteorological Department (sun 1971–2000) [37] [38] [39]
Source 2: Weather Atlas [40]

See also

Related Research Articles

The climate of Mumbai is an extreme version of a tropical wet and dry climate with a lengthy, practically rainless dry season and a relatively short, but extremely rainy wet season due to the Southwest Monsoon and orographic influences from the nearby Western Ghats. Some suburbs are sufficiently wet to qualify as a tropical monsoon climate. Mumbai's climate can be best described as moderately hot with a high level of humidity. Its coastal nature and tropical location ensure temperatures do not fluctuate much throughout the year.

<span class="mw-page-title-main">Climate of India</span> Overview of climatic conditions in India

The climate of India consists of a wide range of weather conditions across a vast geographic scale and varied topography. Based on the Köppen system, India hosts six major climatic sub types, ranging from arid deserts in the west, alpine tundra and glaciers in the north, and humid tropical regions supporting rain forests in the southwest and the island territories. Many regions have starkly different microclimates, making it one of the most climatically diverse countries in the world. The country's meteorological department follows the international standard of four seasons with some local adjustments: winter, summer, monsoon or rainy season, and a post-monsoon period.

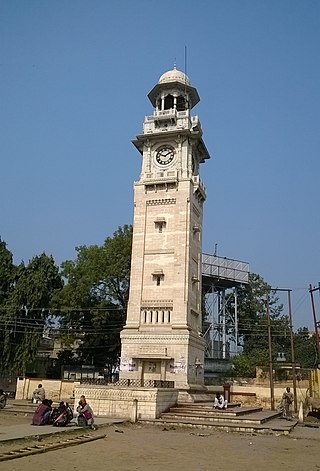
Muzaffarnagar is a city under Muzaffarnagar district in the Indian State of Uttar Pradesh. It is situated midway on the Delhi - Haridwar/Dehradun National Highway and is also well connected with the national railway network. It is known as the sugarbowl of Uttar Pradesh.

<span class="mw-page-title-main">Bahraich</span> City in Uttar Pradesh, India

Bahraich is a city and a municipal board in Bahraich district in the state of Uttar Pradesh, India. Located on the Saryu River, a tributary of the Ghaghara river, Bahraich is 125 kilometres north-east of Lucknow, the state capital. The districts of Barabanki, Gonda, Balrampur, Lakhimpur Kheri, Shravasti and Sitapur share local boundaries with Bahraich. A factor which makes this town important is the international border shared with Nepal..

Shivpuri is a city and a municipality in Shivpuri district located in the central Indian state of Madhya Pradesh. It is in the Gwalior Division of northwest Madhya Pradesh and is the administrative headquarters of Shivpuri District. It is situated at an altitude of 1,515 feet (462 m) above sea level.

Hapur is a city in, as well as the headquarters of, Hapur district, in Uttar Pradesh, India. Located about 60 kilometres (37 mi) east of New Delhi, the city is part of the Delhi National Capital Region (NCR). National Highway 9 passes through the city, connecting it to Delhi.

<span class="mw-page-title-main">Khargone</span> City in Madhya Pradesh, India

Khargone is a city and administrative headquarters of an Khargone district in the Indian state of Madhya Pradesh. The city is located on the bank of the Kunda river and is known for its cotton and chilly production. It is also known for Navgraha Mandir, a temple devoted to the nav grahas. Khargone topped the nation in municipality and received a national award for 'India's Fastest Moving City' under a population of two lakh. Khargone ranked 10th Cleanest city in India in Swachh Survekshan 2020 City ranked the 15th cleanest city in India in Swachh Survekshan 2018 and ranked 17th cleanest city in India in Swachh Survekshan 2017.

<span class="mw-page-title-main">Garhmukteshwar</span> Town in Uttar Pradesh, India

Garhmukteshwar is a town, just outside of Hapur city, and tehsil in Hapur district of Uttar Pradesh, India. According to Census 2011 information the sub-district code of Garhmukteshwar block is 00741. Total area of Garhmukteshwar is 272 km2 including 237.38 km2 rural area and 34.13 km2 urban area. Garhmukteshwar has a population of 46,077. There are 64,688 houses in the sub-district. There are about 137 villages in Garhmukteshwar block.

<span class="mw-page-title-main">Naraingarh</span> Town in Haryana, India

Naraingarh is a town, municipal committee and assembly constituency in the Ambala district of the Indian state of Haryana, located on the border with the Indian state of Himachal Pradesh. Due to its geographical location, the Naraingarh plays an important role in local tourism, being located 39 km from Ambala, the district headquarter, 52 km of Chandigarh, the state capital, 144 km of Shimla, and 230 km of New Delhi.

The climate of Delhi is an overlap between monsoon-influenced humid subtropical and semi-arid, with high variation between summer and winter temperatures and precipitation. Delhi's version of a humid subtropical climate is markedly different from many other humid subtropical cities such as São Paulo, Houston, and Brisbane in that the city features dust storms and wildfire haze due to its semi-arid climate.

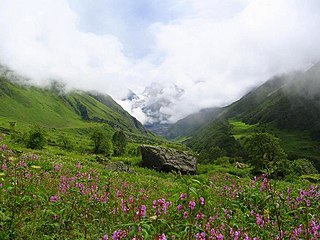
There is a huge variation in the climatic conditions of Himachal Pradesh due to variation in altitude. The climate varies from hot and sub-humid tropical in the southern low tracts, warm and temperate, cool and temperate and cold glacial and alpine in the northern and eastern high elevated mountain. Pollution is affecting the climate of almost all the states of India.

<span class="mw-page-title-main">Climate of West Bengal</span> Climatic conditions of West Bengal

The climate of West Bengal is varied, with tropical savannahs in the southern portions of the state, to humid subtropical areas in the north. Temperatures vary widely, and there are five distinct seasons. The area is vulnerable to heavy rainfall, monsoons, and cyclones. There are some mountains in the area which are generally cold all year round.

Kolkata has a Tropical wet-and-dry climate. The annual mean temperature is 26.8 °C (80 °F); monthly mean temperatures range from 15 °C to 30 °C. Summers are hot and humid with temperatures in the low 30's and during dry spells the maximum temperatures often exceed 40 °C (104 °F) during May and June. Winter tends to last for only about two and a half months, with seasonal lows dipping to 9 °C – 11 °C (48.2 °F – 51.8 °F) between December and January. The highest recorded temperature is 43.9 °C (111 °F) and the lowest is 5 °C (41 °F). Often during early summer, dusty squalls followed by spells of thunderstorm and heavy rains lash the city, bringing relief from the humid heat. These thunderstorms are convective in nature, and is locally known as Kal baisakhi.

Located in eastern India, Bihar is the twelfth-largest Indian state, with an area of 94,163 km2 (36,357 mi2) and an average elevation of about 150 metres above mean sea level. The landlocked state shares a boundary with Nepal to the north, the state of West Bengal to the east, Jharkhand to the south, and Uttar Pradesh to the west. Bihar lies in a subtropical temperate zone and its climatic type is humid subtropical.

<span class="mw-page-title-main">Climate of Gujarat</span>

The climate of Gujarat involves diverse conditions. The plains of Gujarat are very hot and humid in summer and cold and dry in winter. Summer is milder in the hilly regions and the coast. The average daytime temperature during winter is around 29 °C (84 °F) and in nights is around 12 °C (54 °F) with 100 percent sunny days and clear nights. During summers, the daytime temperature is around 49 °C (120 °F) and at night no lower than 30 °C (86 °F). The monsoon season lasts from June to September. Most of Gujarat receives scanty rainfall. Southern Gujarat and the hilly regions receive heavy rainfall during the monsoons with high humidity which makes the air feel hotter. There is relief when the monsoon season starts. The day temperatures are lowered to around 35 °C (95 °F) but humidity is very high and nights are around 27 °C (81 °F). Most of the rainfall occurs in this season, and the rain can cause severe Floods. The sun is often occluded during the monsoon season. Though mostly dry, it is desertic in the north-west, and wet in the southern districts due to a heavy monsoon season.

The climate of Hyderabad is semi-arid, featuring too little rain to feature the tropical savanna climate. The days are hot and dry, usually going up to extreme highs of 40 °C (104 °F), while the nights are cool and breezy. Winds usually bring along clouds of dust, and people prefer staying indoors in the daytime, while the breezes at night are pleasant and clean.

<span class="mw-page-title-main">Climate of Agra</span>

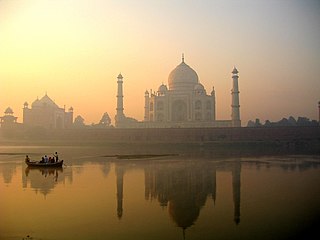
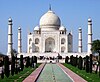
The climate of Agra features a semi-arid climate that borders on a humid subtropical climate. The city features mild winters, hot and dry summers and a monsoon season. The monsoon, though substantial in Agra, is not quite as heavy as the monsoon in other parts of India. The average monsoon rainfall during June to September is 628.6 millimeters. Agra is reputation of being one of the hottest and the coldest towns in India. In summers the city witnesses a sudden surge in temperature and at times, mercury goes beyond the 46 °C mark in addition to a very high level of humidity. During summer, the daytime temperature hovers around 46-50 °C. Nights are relatively cooler and temperature lowers to 30 °C. Winter minimum temperatures sometimes goes as low as 3 or 3.5 °C but usually hovers in the range of 6 to 8 °C.

<span class="mw-page-title-main">Climate of Tamil Nadu</span> Climate of Tamil Nadu (State in South India)

The Climate of Tamil Nadu, India is generally tropical and features fairly hot temperatures over the year except during the monsoon seasons. The city of Chennai lies on the thermal equator, which means Chennai and Tamil Nadu does not have that much temperature variation.

<span class="mw-page-title-main">Climate of Rajasthan</span> Climate of the Indian state

The climate of Rajasthan in northwestern India is generally arid or semi-arid and features fairly hot temperatures over the year with extreme temperatures in both summer and winter. The hottest months are May and June. The monsoon season is from July to September; however, rainfall remains moderate.

References

  1. S D Attri and Ajit Tyagi. "CLIMATE PROFILE OF INDIA" (PDF). Indian Meteorological Department. Archived from the original (PDF) on 21 July 2011. Retrieved 9 March 2011.
  2. "Climate". India.gov.in. Retrieved 9 March 2011.
  3. 1 2 3 Mathur, Raj B. "Uttar Pradesh: Climate". Encyclopædia Britannica. Retrieved 9 March 2011.
  4. "Home » Uttar Pradesh Profile » Geography » Climate". UPonline. Archived from the original on 21 July 2011. Retrieved 9 March 2011.
  5. 1 2 3 4 5 6 7 Upkar Prakashan – Editorial Board (2008). Uttar Pradesh General Knowledge. Upkar Prakashan. pp. 26–. ISBN   978-81-7482-408-0 . Retrieved 9 March 2011.
  6. 1 2 Sethi, Nitin (13 February 2007). "Met dept blames it on 'western disturbance'". The Times of India . Archived from the original on 11 August 2011. Retrieved 9 March 2011.
  7. 1 2 3 4 "Disaster Management Department, Govt of U.P." rahat.up.nic.in. Archived from the original on 12 March 2011. Retrieved 9 March 2011.
  8. "9 more succumb to heatwave in UP, rain claims 5 lives in south". OneIndiaNews.in. 11 June 2007. Retrieved 10 March 2011.
  9. "46 more perish in heat spell; toll crosses 100". The Hindu. 11 June 2007. Retrieved 10 March 2011.
  10. "120 die in unrelenting heatwave across India". 25 June 2009. IOL.co.za. Retrieved 10 March 2011.
  11. "Deadly heatwave sweeps India". BreakingNews.ie. 26 June 2009. Retrieved 10 March 2011.
  12. "Deadly heat wave sweeps India". Yorkshire Post. Retrieved 10 March 2011.
  13. "Heat tightens grip over N-India, Rajasthan hottest". Zeenews.com. 20 June 2010. Retrieved 10 March 2011.
  14. IANS (3 January 2008). "Uttar Pradesh cold wave toll rises to 38". DNA. Retrieved 9 March 2011.
  15. "Three die due to cold in UP as winter firms its grip on north". Zeenews.com. 27 December 2009. Retrieved 9 March 2011.
  16. 1 2 IANS (7 January 2011). "Four more die in freezing Uttar Pradesh, toll climbs to 63". Sify.com. Archived from the original on 17 October 2012. Retrieved 9 March 2011.
  17. "Rajasthan temperature dips to 0 °C or 32 °F, N India frozen". OneIndiaNews.com. 6 January 2011. Archived from the original on 21 July 2011. Retrieved 9 March 2011.
  18. "Floods play havoc in Bihar & Uttar Pradesh". Samachar today. 28 August 2010. Archived from the original on 15 July 2011. Retrieved 9 March 2011.
  19. "Nine die in Uttar Pradesh India floods: Toll 429". Climate Himalaya Initiative-NEWS. 2 October 2010. Archived from the original on 25 July 2011. Retrieved 9 March 2011.
  20. "Agra Climate Normals 1971-1990". National Oceanic and Atmospheric Administration . Retrieved 18 January 2014.
  21. "World Weather Information Service–Agra". World Meteorological Organization. Retrieved 18 January 2014.
  22. "Station: Agra Climatological Table 1981–2010" (PDF). Climatological Normals 1981–2010. India Meteorological Department. January 2015. pp. 9–10. Archived from the original (PDF) on 5 February 2020. Retrieved 19 April 2020.
  23. "Ever recorded Maximum and minimum temperatures upto 2010" (PDF). India Meteorological Department. Archived from the original (PDF) on 16 March 2014. Retrieved 18 January 2014.
  24. "Extremes of Temperature & Rainfall for Indian Stations (Up to 2012)" (PDF). India Meteorological Department. December 2016. p. M210. Archived from the original (PDF) on 5 February 2020. Retrieved 19 April 2020.
  25. "Climate & Weather Averages in Agra, Uttar Pradesh, India". Time and Date. Retrieved 9 August 2022.
  26. "Climate and monthly weather forecast Agra, India". Weather Atlas. Retrieved 15 June 2022.
  27. "Station: Lucknow (Amausi) Climatological Table 1981–2010" (PDF). Climatological Normals 1981–2010. India Meteorological Department. January 2015. pp. 447–448. Archived from the original (PDF) on 5 February 2020. Retrieved 27 April 2020.
  28. "Extremes of Temperature & Rainfall for Indian Stations (Up to 2012)" (PDF). India Meteorological Department. December 2016. p. M218. Archived from the original (PDF) on 5 February 2020. Retrieved 27 April 2020.
  29. "Climate & Weather Averages in Lucknow, Uttar Pradesh, India". Time and Date. Retrieved 19 July 2022.
  30. "Climate and monthly weather forecast Lucknow, India". Weather Atlas. Retrieved 13 June 2022.
  31. "Station: Kanpur (A) Climatological Table 1981–2010" (PDF). Climatological Normals 1981–2010. India Meteorological Department. January 2015. pp. 387–388. Archived from the original (PDF) on 5 February 2020. Retrieved 27 April 2020.
  32. "Extremes of Temperature & Rainfall for Indian Stations (Up to 2012)" (PDF). India Meteorological Department. December 2016. p. M217. Archived from the original (PDF) on 5 February 2020. Retrieved 27 April 2020.
  33. "Station: Meerut Climatological Table 1981–2010" (PDF). Climatological Normals 1981–2010. India Meteorological Department. January 2015. pp. 509–510. Archived from the original on 5 February 2020. Retrieved 1 March 2020.
  34. "Meerut Climatological Table Period: 1971–2000". India Meteorological Department. Archived from the original on 14 February 2014. Retrieved 15 April 2015.
  35. "Ever recorded Maximum and minimum temperatures up to 2010" (PDF). India Meteorological Department. Archived from the original (PDF) on 16 March 2014. Retrieved 15 April 2015.
  36. "Extremes of Temperature & Rainfall for Indian Stations (Up to 2012)" (PDF). India Meteorological Department. December 2016. p. M46. Archived from the original (PDF) on 5 February 2020. Retrieved 26 December 2020.
  37. "Climatological Normals 1981–2010" (PDF). India Meteorological Department. January 2015. pp. 779–82. Archived from the original (PDF) on 5 February 2020. Retrieved 1 March 2020.
  38. "Extremes of Temperature & Rainfall for Indian Stations (Up to 2012)" (PDF). India Meteorological Department. December 2016. p. M224. Archived from the original (PDF) on 5 February 2020. Retrieved 1 March 2020.
  39. "Table 3 Monthly mean duration of Sun Shine (hours) at different locations in India" (PDF). Daily Normals of Global & Diffuse Radiation (1971–2000). India Meteorological Department. December 2016. p. M-3. Archived (PDF) from the original on 5 February 2020. Retrieved 1 March 2020.
  40. "Climate and monthly weather forecast Varanasi, India". Weather Atlas. Retrieved 28 June 2022.