Types of cluster diagrams
Specific types of cluster diagrams are:
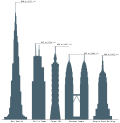 Comparison diagram of sky scraper
 Astronomic cluster diagram of the Messier 3 globular cluster
 Biositemap diagram
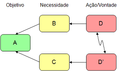 Cluster chart in brainstorming


- In architecture a comparison diagram is sometimes called a cluster diagram. [1]
- In astronomy diagrams of star clusters, galaxy clusters or globular clusters.
- In brainstorming a cluster diagrams is also called cloud diagram. They can be considered "are a type of non-linear graphic organizer that can help to systematize the generation of ideas based upon a central topic. Using this type of diagram... can more easily brainstorm a theme, associate about an idea, or explore a new subject". [2] Also, the term cluster diagrams is sometimes used as synonym of mind maps". [3]
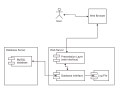
 Computer architecture diagram of a PC
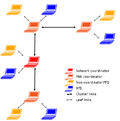
 Internet diagram
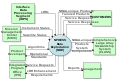


- In computer science more complex diagrams of computer networks, computer architecture, file systems and internet can be considered cluster diagrams.
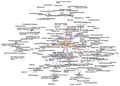
- In information visualization specific visual representation of large-scale collections of non-numerical information are sometimes drawn in the shape of a cluster diagram.
- In quantum field theory for example, according to Crawford (1998), the called coupled cluster diagram is a "simple diagrammatic formalism popularized by Kucharski and Bartlett [in 1986] by which one may construct the coupled cluster energy and amplitude equations far more quickly than by direct application of Wick's theorem". [4]
 UML Class diagram
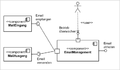


- In the Unified Modeling Language (UML) all structure diagrams can be considered cluster diagrams. These structure diagrams emphasize what things must be in the system being modeled. UML encounters here the Class diagram, Component diagram, Composite structure diagram, Deployment diagram, Object diagram, and the Package diagram.