Constituency election results in the 1923 United Kingdom general election

Last updated

31st Parliament (1918)
32nd Parliament (1922)
33rd Parliament (1923)
34th Parliament (1924)
35th Parliament (1929)
Results of the election by constituency 1923 UK general election map.svg
Results of the election by constituency

This is a complete alphabetical list of constituency election results to the 33rd Parliament of the United Kingdom at the 1923 general election, held on 5 December 1923.

Contents

Notes

England

The results in England are in a separate article for size reasons.

Scotland

Aberdeen North [1]
PartyCandidateVotes%±%
Labour Frank Rose 9,13850.6
Unionist William Forbes Lumsden4,82026.7n/a
Liberal William Mackenzie Cameron4,09922.7
Majority4,31823.9
Turnout 53.0
Labour hold Swing
Aberdeen South [1]
PartyCandidateVotes%±%
Unionist Frederick Thomson 11,25847.3-10.7
Labour John Paton 6,91129.0n/a
Liberal Charles Mallet 5,64123.7-18.3
Majority4,34718.3
Turnout
Unionist hold Swing
Aberdeenshire Central [1]
PartyCandidateVotes%±%
Liberal Murdoch McKenzie Wood 9,81853.6-6.5
Unionist Robert Smith 8,50746.4+6.5
Majority1,3117.2-13.0
Turnout 64.7+7.8
Liberal hold Swing -6.5
Aberdeenshire East [1]
PartyCandidateVotes%±%
Liberal Frederick Martin 8,79355.9-4.6
Unionist Falconer Lewis Wallace6,94944.1n/a
Majority1,84411.8-9.2
Turnout 15,74257.6+12.1
Liberal hold Swing n/a
Aberdeenshire West & Kincardine [1]
PartyCandidateVotes%±%
Unionist Malcolm Barclay-Harvey 6,63951.0n/a
Liberal Arthur Murray 6,36949.0-12.4
Majority2702.026.6
Turnout 57.8+13.2
Unionist gain from Liberal Swing n/a
Argyllshire [2]
PartyCandidateVotes%±%
Liberal William Sutherland 9,02052.7-6.1
Unionist F. A. Macquisten 8,10047.3n/a
Majority9205.4
Turnout 17,12053.3
Liberal gain from National Liberal Swing n/a
Ayr Burghs [1]
PartyCandidateVotes%±%
Unionist John Baird 10,20641.8-2.7
Labour John McDiarmid Airlie7,73231.7+5.7
Liberal William Henderson Pringle 6,46726.5-3.0
Majority2,47410.1-4.9
Turnout 70.0-1.1
Unionist hold Swing -4.2
Ayrshire North & Bute [1]
PartyCandidateVotes%±%
Unionist Aylmer Hunter-Weston 12,32055.6
Labour Peter Campbell Stephen9,85544.4
Majority2,46511.2
Turnout 55.9
Unionist hold Swing
Ayrshire South [1]
PartyCandidateVotes%±%
Labour James Brown 11,16955.9
Unionist Charles Fergusson 8,80744.1
Majority2,36211.8
Turnout 65.7
Labour hold Swing
Banffshire [1]
PartyCandidateVotes%±%
Liberal Charles Barrie unopposedn/an/a
Liberal hold Swing n/a
Berwick and Haddington [1]
PartyCandidateVotes%±%
Labour Robert Spence 8,57637.0
Unionist Chichester Crookshank 8,50836.7n/a
Liberal Walter Waring 6,08426.3
Majority680.3
Turnout 69.4
Labour gain from National Liberal Swing
Bothwell [1]
PartyCandidateVotes%±%
Labour John Robertson 14,21160.2
Unionist Peter Denniston Ridge-Beedle7,56932.0
Liberal John Dick Scott1,8467.8
Majority6,64228.2
Turnout 73.1
Labour hold Swing
Caithness and Sutherland
PartyCandidateVotes%±%
Liberal Archibald Sinclair unopposedn/an/a
Liberal hold Swing n/a
Clackmannan and Eastern Stirlingshire [1]
PartyCandidateVotes%±%
Labour MacNeill Weir 10,49251.1
Liberal Craigie Aitchison 10,04348.9
Majority4492.2
Turnout 64.2
Labour hold Swing
Coatbridge [1]
PartyCandidateVotes%±%
Labour James C. Welsh 12,29255.5
Unionist J.B. Young9,86544.5
Majority2,42711.0
Turnout 71.7
Labour hold Swing
Dumbarton Burghs [1]
PartyCandidateVotes%±%
Labour David Kirkwood 13,47261.3
Unionist Walter Black Munro8,52038.7
Majority4,95222.6
Turnout 68.0
Labour hold Swing
Dumfriesshire [1]
PartyCandidateVotes%±%
Liberal William Chapple 13,10753.5-1.1
Unionist John Charteris 11,38046.5+1.1
Majority1,7277.0-2.2
Turnout 24,487
Liberal hold Swing -1.1
Dunbartonshire [1]
PartyCandidateVotes%±%
Labour William Martin 11,70543.0-6.6
Unionist David Fleming 9,80236.0-14.4
Liberal Stanley Holmes 5,72621.0n/a
Majority1,9037.07.8
Turnout 70.7+1.7
Labour gain from Unionist Swing +3.9
Dundee (2 seats)
PartyCandidateVotes%±%
Scottish Prohibition Edwin Scrymgeour 25,75325.1-2.5
Labour E. D. Morel 23,34522.7-2.9
Liberal John Pratt 23,03122.4+16.7
Unionist Frederick William Wallace20,25319.7n/a
Communist Willie Gallacher 10,38010.1+5.1
Majority2,7222.7
Majority3140.3
Turnout 72.5-8.0
Scottish Prohibition hold Swing
Labour hold Swing
Dunfermline Burghs
PartyCandidateVotes%±%
Labour William McLean Watson 12,60653.6+3.2
Liberal John Wallace 10,93146.4−3.2
Majority1,6757.2+6.4
Turnout 23,53777.7+0.2
Labour hold Swing 3.2
Edinburgh Central [1]
PartyCandidateVotes%±%
Labour William Graham 13,18667.9+10.0
Liberal Thomas Lamb6,22532.1-10.0
Majority6,96135.8+20.0
Turnout 59.7-12.1
Labour hold Swing +10.0
Edinburgh East
PartyCandidateVotes%±%
Liberal James Hogge 10,87668.3+8.5
Unionist Charles John Morris Mancor5,04531.7n/a
Majority5,83136.617.0
Turnout 15,92158.5-7.5
Liberal hold Swing n/a
Edinburgh North [3]
PartyCandidateVotes%±%
Liberal Peter Raffan 13,74455.7+17.5
Unionist Patrick Ford 10,90944.3-17.5
Majority2,83511.435.0
Turnout 24,65366.3
Liberal gain from Unionist Swing +17.5
Edinburgh South [1]
PartyCandidateVotes%±%
Unionist Samuel Chapman 12,80455.7
Liberal William Hope10,19444.3
Majority2,61011.4
Turnout 70.2
Unionist hold Swing
Edinburgh West [3]
PartyCandidateVotes%±%
Liberal Vivian Phillipps 11,01041.3-10.1
Unionist Ian Macintyre 8,77833.0-15.6
Labour George Mathers 6,83625.7n/a
Majority2,2328.3+5.5
Turnout 74.4-5.5
Liberal hold Swing +2.8
Fife East
PartyCandidateVotes%±%
Liberal James Duncan Millar 12,82555.5-0.5
Unionist Alexander Sprot 10,27544.5+0.5
Majority2,55011.0-1.0
Turnout 23,10067.8+0.6
Liberal hold Swing -0.5
Fife West
PartyCandidateVotes%±%
Labour William Adamson 12,20465.4n/a
Independent Labour Philip Hodge6,45934.6n/a
Majority5,74530.8n/a
Turnout 18,66357.4n/a
Labour hold Swing n/a
Forfarshire [1]
PartyCandidateVotes%±%
Liberal James Falconer 7,60552.9-1.9
Unionist William T. Shaw 6,75847.1+1.9
Majority8475.8-3.8
Turnout 60.3-4.7
Liberal hold Swing -1.9
Galloway [1]
PartyCandidateVotes%±%
Liberal Cecil Dudgeon unopposedn/an/a
Liberal hold Swing n/a
Glasgow Bridgeton [4]
PartyCandidateVotes%±%
Labour James Maxton 15,73564.8
Unionist J. B. Black 6,10125.1
Liberal Thomas Randall Anderson2,44510.1
Majority9,63439.7
Turnout 66.5
Labour hold Swing
Glasgow Camlachie [1]
PartyCandidateVotes%±%
Labour Campbell Stephen 14,14356.2
Unionist Henry Keith 11,02743.8
Majority3,11612.4
Turnout 71.8
Labour hold Swing
Glasgow Cathcart [1]
PartyCandidateVotes%±%
Unionist Robert MacDonald 10,81742.3
Labour John Primrose Hay 8,88434.7
Liberal Thomas Graham Robertson 5,89423.0
Majority1,9337.6
Turnout 25,595
Unionist gain from Labour Swing
Glasgow Central [1]
PartyCandidateVotes%±%
Unionist William Alexander 13,39245.8
Labour Edward Mitchell 12,97644.4
Liberal Harold Tennant 2,8709.8
Majority4161.4
Turnout 67.5
Unionist hold Swing
Glasgow Gorbals [1]
PartyCandidateVotes%±%
Labour George Buchanan 17,21167.2
Unionist Robert McLellan8,39232.8n/a
Majority8,81934.4
Turnout 63.5
Labour hold Swing
Glasgow Govan [1]
PartyCandidateVotes%±%
Labour Neil Maclean 13,98766.3
Liberal Harry Watt 7,09533.7
Majority6,89232.6
Turnout 68.5
Labour hold Swing
Glasgow Hillhead [1]
PartyCandidateVotes%±%
Unionist Robert Horne 9,75751.0-11.7
Labour John Laing Kinloch5,05926.4n/a
Liberal Edwin James Donaldson4,33122.6-14.7
Majority4,69824.6-0.8
Turnout 73.2-2.3
Unionist hold Swing n/a
Glasgow Kelvingrove [1]
PartyCandidateVotes%±%
Unionist William Hutchison 11,02542.9-11.9
Communist Aitken Ferguson 10,02139.0n/a
Liberal Alexander James Grieve 4,66218.1-27.1
Majority1,0043.9-5.7
Turnout 68.2+3.7
Unionist hold Swing n/a
Glasgow Maryhill [1]
PartyCandidateVotes%±%
Labour John Muir 12,50848.1
Unionist James Couper 10,34239.7
Liberal Walter Crawford Smith3,17912.2
Majority2,1668.4
Turnout 77.1
Labour hold Swing
Glasgow Partick [1]
PartyCandidateVotes%±%
Labour Andrew Young 8,39744.0n/a
Unionist Allan Smith 6,31533.1n/a
Liberal MacCallum Scott 4,35822.9
Majority2,08210.9
Turnout 71.1
Labour gain from National Liberal Swing n/a
Glasgow Pollok [1]
PartyCandidateVotes%±%
Unionist John Gilmour 14,01367.2
Labour John Rankin 6,83632.8
Majority7,17734.4
Turnout 66.0
Unionist hold Swing
Glasgow Shettleston [1]
PartyCandidateVotes%±%
Labour John Wheatley 12,62459.8
Liberal Francis John Robertson8,47140.2
Majority4,15319.6
Turnout 71.0
Labour hold Swing
Glasgow Springburn
PartyCandidateVotes%±%
Labour George Hardie 14,53562.3+1.8
Unionist David Alexander Guild 8,81437.7−1.8
Majority5,72124.6+3.6
Turnout 23,34968.1−10.4
Labour hold Swing +1.8
Glasgow St Rollox [1]
PartyCandidateVotes%±%
Labour James Stewart 15,24062.3
Unionist Violet Mary Robertson9,20437.7
Majority6,03624.6
Turnout 65.6
Labour hold Swing
Glasgow Tradeston [1]
PartyCandidateVotes%±%
Labour Thomas Henderson 12,78760.1
Liberal Douglas Macdonald8,47939.9
Majority4,30820.2
Turnout 63.1
Labour hold Swing
Greenock
PartyCandidateVotes%±%
Liberal Godfrey Collins 16,33761.3+24.7
Communist Alec Geddes 10,33538.7+4.6
Majority6,00222.6+20.1
Turnout 78.4-6.4
Liberal hold Swing +10.0
Hamilton
PartyCandidateVotes%±%
Labour Duncan Graham 11,85858.4+0.8
Liberal Helen Fraser 8,43641.6n/a
Majority3,42216.8+1.6
Turnout 73.5-4.8
Labour hold Swing n/a
Inverness [2]
PartyCandidateVotes%±%
Liberal Murdoch Macdonald 10,19465.4
Labour Andrew D. Kinloch5,38534.6n/a
Majority4,80930.8
Turnout 46.9
Liberal hold Swing n/a
Kilmarnock [1]
PartyCandidateVotes%±%
Labour Robert Climie 10,99243.2-2.1
Liberal Donald Maclean 8,18532.1-22.6
Unionist Alexander Morrice Mackay 6,29824.7n/a
Majority2,80711.120.5
Turnout 75.7+4.2
Labour gain from Liberal Swing +10.2
Kinross and Western Perthshire [1]
PartyCandidateVotes%±%
Unionist Katharine Stewart-Murray 9,23550.4n/a
Liberal Percy Molteno 9,08549.6n/a
Majority1500.8n/a
Turnout 72.6n/a
Unionist gain from National Liberal Swing
Kirkcaldy Burghs [1]
PartyCandidateVotes%±%
Labour Tom Kennedy 14,22154.4+5.8
Liberal Robert Hutchison 11,93745.6-5.8
Majority2,2848.811.6
Turnout 81.7+2.4
Labour gain from Liberal Swing +5.8
Lanark [1]
PartyCandidateVotes%±%
Labour Thomas Dickson 11,38450.5
Unionist Walter Elliot 11,15449.5
Majority2301.0
Turnout 74.9
Labour gain from Unionist Swing
North Lanarkshire [1]
PartyCandidateVotes%±%
Labour Joseph Sullivan 10,52650.5
Unionist Alexander McClure7,16534.3
Liberal Edward Rolland McNab3,16815.2
Majority3,36116.2
Turnout 65.3
Labour hold Swing
Leith [1]
PartyCandidateVotes%±%
Liberal William Wedgwood Benn 15,00464.5
Labour Robert Freeman Wilson8,26735.5
Majority6,73729.0
Turnout 59.1
Liberal hold Swing
Linlithgowshire [1]
PartyCandidateVotes%±%
Labour Manny Shinwell 13,30450.9
Unionist James Kidd 8,14931.2
Liberal James Johnston4,69117.9
Majority5,15519.7
Turnout 71.7
Labour hold Swing
Midlothian and Peebles Northern [5]
PartyCandidateVotes%±%
Labour Andrew Clarke 8,570
Unionist George Hutchison 6,731
Liberal Charles de Bois Murray 3,578
Majority1,839
Turnout 74.8
Labour gain from Unionist Swing
Montrose Burghs [1]
PartyCandidateVotes%±%
Liberal John Sturrock 8,71755.3
Labour John Carnegie7,03244.7
Majority1,68510.6
Turnout 62.9
Liberal hold Swing
Moray & Nairn
PartyCandidateVotes%±%
Unionist James Stuart 8,11653.4n/a
Liberal Thomas Maule Guthrie 7,08946.6n/a
Majority1,0276.810.4
Turnout 15,21561.3+12.3
Unionist gain from Liberal Swing n/a
Motherwell
PartyCandidateVotes%±%
Unionist Hugh Ferguson 9,79342.0+12.9
Communist Walton Newbold 8,71237.4+4.1
Liberal John Maxwell4,79920.6-1.0
Majority1,0814.614.8
Turnout 77.4-4.1
Unionist gain from Communist Swing +4.4
Orkney and Shetland
PartyCandidateVotes%±%
Liberal Robert Hamilton 5,12954.3+0.8
Unionist Robert Boothby 4,31845.7n/a
Majority8118.6+1.6
Turnout 9,44739.1+1.7
Liberal hold Swing
Paisley [3]
PartyCandidateVotes%±%
Liberal H H Asquith 9,72333.4-17.1
Labour John McLaren Biggar 7,97727.4-22.1
Unionist MacInnes Shaw 7,75826.6N/A
Independent Labour D.D. Cormack3,68512.6n/a
Majority1,7466.0
Turnout
Liberal hold Swing +2.5
Peebles and Southern Midlothian [1]
PartyCandidateVotes%±%
Labour Joseph Westwood 7,88243.0+7.0
Unionist Archibald Crawford 6,20333.8+0.1
Liberal William Mitchell 4,24523.2-7.1
Majority1,6799.2+6.9
Turnout 76.9+1.2
Labour hold Swing +3.4
Perth [1]
PartyCandidateVotes%±%
Liberal Robert Macgregor Mitchell 12,65553.2
Unionist Noel Skelton 11,13446.8
Majority1,5216.4
Turnout 68.7
Liberal gain from Unionist Swing
Renfrewshire East [1]
PartyCandidateVotes%±%
Labour Robert Nichol 9,85744.6
Unionist Frederick Lobnitz 9,34942.3
Liberal William Crawford2,88713.1
Majority5082.3
Turnout 75.9
Labour hold Swing
Renfrewshire West [1]
PartyCandidateVotes%±%
Labour Robert Murray 10,90448.1
Unionist Alexander Thomson Taylor 7,60233.6n/a
Liberal James Scott 4,14918.3n/a
Majority3,30214.5
Turnout 77.0
Labour hold Swing
Ross and Cromarty [1]
PartyCandidateVotes%±%
Liberal Ian Macpherson unopposedn/an/a
Liberal hold Swing n/a
Roxburgh & Selkirk [1]
PartyCandidateVotes%±%
Unionist Walter Montagu Douglas Scott 11,25843.1n/a
Liberal Thomas Henderson 8,04630.8n/a
Labour George Dallas 6,81126.1n/a
Majority3,21212.3n/a
Turnout 26,11578.2+17.3
Unionist gain from Liberal Swing n/a
Rutherglen [1]
PartyCandidateVotes%±%
Labour William Wright 13,02154.5
Unionist Robert McLaren7,65232.1n/a
Liberal John Taylor3,20113.4n/a
Majority5,36922.4
Turnout 72.3
Labour hold Swing
Stirling and Falkirk [3]
PartyCandidateVotes%±%
Liberal George McCrae 10,72150.4+3.7
Labour Hugh Murnin 10,56549.6-3.7
Turnout 71.70.0
Majority1560.87.4
Liberal gain from Labour Swing +3.7
Stirlingshire West [1]
PartyCandidateVotes%±%
Labour Tom Johnston 9,24251.9
Unionist Harry Hope 6,18234.7
Liberal Robert Ian Aonas MacInnes 2,39013.4n/a
Majority3,06017.2
Turnout 74.7
Labour hold Swing
Western Isles
PartyCandidateVotes%±%
Liberal Alexander Livingstone 3,39139.6-6.3
Unionist William Morrison 3,15836.9n/a
Independent Labour Hugh McCowan2,01123.5n/a
Majority2332.7-5.5
Turnout 6,54940.1-14.0
Liberal gain from National Liberal Swing n/a

Wales

Aberavon
PartyCandidateVotes%±%
Labour Ramsay MacDonald 17,43955.6+9.0
Unionist Sidney Hutchinson Byass 13,92744.4+8.3
Majority3,51211.2+0.7
Turnout 87.2+1.4
Labour hold Swing +0.3
Aberdare [6]
PartyCandidateVotes%±%
Labour George Hall 22,37958.2+1.0
Liberal William M. Llewellyn16,05041.8-1.0
Majority6,32916.4+2.0
Turnout 83.3+3.4
Labour hold Swing +1.0
Abertillery [3]
PartyCandidateVotes%±%
Labour George Barker unopposedn/an/a
Labour hold Swing n/a
Anglesey
PartyCandidateVotes%±%
Liberal Robert Thomas unopposedn/an/a
Liberal hold Swing n/a
Bedwellty [6]
PartyCandidateVotes%±%
Labour Charles Edwards 17,56467.6+4.6
Liberal William Henry Williams8,43632.4n/a
Majority9,12835.2+9.2
Turnout 74.2-7.0
Labour hold Swing n/a
Brecon and Radnor
PartyCandidateVotes%±%
Liberal William Jenkins unopposedn/an/a
Liberal hold Swing n/a
Caerphilly [3]
PartyCandidateVotes%±%
Labour Morgan Jones 16,53558.7+1.5
Unionist Gwilym Rowlands 6,49323.0-19.8
Liberal Samuel Roberts Jenkins5,15218.3n/a
Majority10,04235.7+21.3
Turnout 77.0-1.6
Labour hold Swing +10.6
Cardiff Central
PartyCandidateVotes%±%
Unionist James Childs Gould 10,26138.4-11.6
Labour James Edward Edmunds8,56332.0+2.6
Liberal Ieuan Watkins Evans7,92329.6+9.0
Majority1,6986.4-14.2
Turnout 71.4-3.0
Unionist hold Swing -7.1
Cardiff East
PartyCandidateVotes%±%
Liberal Henry Webb 8,53635.8+4.0
Labour Hugh Dalton 7,81232.7+1.3
Unionist Lewis Lougher 7,51331.5-5.3
Majority7243.18.1
Turnout
Liberal gain from Unionist Swing +4.1
Cardiff South [3]
PartyCandidateVotes%±%
Labour Arthur Henderson 7,89937.9+6.0
Unionist James Cory 7,47335.8-0.6
Liberal Walter Layton 5,47426.3-5.9
Majority4262.16.3
Turnout 20,84670.6-4.3
Labour gain from Unionist Swing +3.3
Cardiganshire
PartyCandidateVotes%±%
Independent Liberal Rhys Hopkin Morris 12,46946.9-2.1
Liberal Ernest Evans 7,39127.7-23.3
Unionist Ernest Vaughan 6,77625.4n/a
Majority5,07819.221.2
Turnout 81.0+4.1
Independent Liberal gain from National Liberal Swing +10.6
Carmarthen [6]
PartyCandidateVotes%±%
Liberal Ellis Ellis-Griffith 12,98845.1+32.3
Unionist Alfred Stephens 8,67730.1+0.7
Labour Rowland Williams7,13224.8n/a
Majority4,31115.027.4
Turnout 78.3-4.4
Liberal gain from National Liberal Swing n/a
Carnarvon Boroughs [6]
PartyCandidateVotes%±%
Liberal David Lloyd George 12,49963.1n/a
Unionist Austin Jones 7,32336.9n/a
Majority5,17626.2n/a
Turnout 19,82280.9n/a
Liberal hold Swing n/a
Caernarvonshire [6]
PartyCandidateVotes%±%
Liberal Goronwy Owen 15,04352.7+5.7
Labour Robert Jones 13,52147.3-5.7
Majority1,5225.411.4
Turnout 74.9+4.3
Liberal gain from Labour Swing +5.7
Denbigh [6]
PartyCandidateVotes%±%
Liberal Ellis Davies 12,16459.8+51.6
Unionist Rhys David8,18640.2+2.3
Majority3,97819.635.6
Turnout 63.6-13.1
Liberal gain from National Liberal Swing +24.8
Ebbw Vale
PartyCandidateVotes%±%
Labour Evan Davies 16,49265.6+0.2
Liberal Cyrus Golyddon Davies8,63934.4n/a
Majority7,85331.2+0.4
Turnout 25,13175.8-2.4
Labour hold Swing n/a
Flintshire
PartyCandidateVotes%±%
Liberal Tom Parry 19,60956.8+12.6
Unionist Ernest Roberts 14,92643.2+3.6
Majority4,68313.6+9.0
Turnout 69.4-10.0
Liberal hold Swing +4.5
Gower [6]
PartyCandidateVotes%±%
Labour David Grenfell 14,77159.1+4.9
Liberal Leah Norah Folland 10,21940.9-4.9
Majority4,55218.2+9.8
Turnout 73.0-1.6
Labour hold Swing +4.9
Llandaff and Barry [3]
PartyCandidateVotes%±%
Unionist William Cope 11,05037.9-6.2
Liberal Elfyn William David10,21335.1+9.6
Labour Thomas F. Worrall7,87127.0-3.4
Majority8372.8-10.9
Turnout 72.1-4.7
Unionist hold Swing -7.9
Llanelly
PartyCandidateVotes%±%
Labour John Henry Williams 21,06355.1-3.6
Liberal Richard Thomas Evans 11,76530.7-10.4
Unionist Lionel Beaumont-Thomas 5,44214.2n/a
Majority9,29824.4+5.8
Turnout 76.8-3.5
Labour hold Swing n/a
Merioneth [6]
PartyCandidateVotes%±%
Liberal Henry Haydn Jones 11,00560.5+2.2
Labour John Jones Roberts7,18139.5+2.2
Majority3,82421.0+4.4
Turnout 80.2+3.1
Liberal hold Swing +2.2
Merthyr [6]
PartyCandidateVotes%±%
Labour R. C. Wallhead 19,51160.1+7.1
Liberal David Rowland Thomas7,40322.8n/a
Unionist Arthur Charles Fox-Davies 5,54817.1n/a
Majority12,10837.3+31.3
Turnout
Labour hold Swing n/a
Monmouth [6]
PartyCandidateVotes%±%
Unionist Leolin Forestier-Walker 12,69759.9n/a
Liberal Morgan Griffith8,48740.1n/a
Majority4,21019.8n/a
Turnout 80.9n/a
Unionist hold Swing n/a
Montgomeryshire
PartyCandidateVotes%±%
Liberal David Davies unopposedn/an/a
Liberal hold Swing n/a
Neath [3]
PartyCandidateVotes%±%
Labour William Jenkins 20,76462.3+2.8
Liberal Thomas Elias12,56237.7-2.8
Majority8,20224.6+5.6
Turnout 73.9-1.5
Labour hold Swing +2.8
Newport
PartyCandidateVotes%±%
Unionist Reginald Clarry 14,42439.5-14.8
Labour William Bowen 14,10038.6-7.1
Liberal H. Davies8,01521.9n/a
Majority3240.9-7.7
Turnout 85.2+3.1
Unionist hold Swing -3.8
Ogmore [3]
PartyCandidateVotes%±%
Labour Vernon Hartshorn unopposedn/an/a
Labour hold Swing n/a
Pembrokeshire [6]
PartyCandidateVotes%±%
Liberal Gwilym Lloyd George 13,17338.3-30.7
Unionist Charles Price 11,68234.0n/a
Labour William James Jenkins9,51127.7-3.3
Majority1,4914.3-33.7
Turnout 77.9
Liberal hold Swing n/a
Pontypool [6]
PartyCandidateVotes%±%
Labour Thomas Griffiths 13,77050.6+10.0
Liberal Samuel John Robins13,44449.4+21.4
Majority3261.2-8.0
Turnout 81.6
Labour hold Swing -5.7
Pontypridd [7]
PartyCandidateVotes%±%
Labour Thomas Mardy Jones 16,83754.9+7.7
Liberal Jon David Rees13,83945.1+19.8
Majority2,9989.8−9.9
Turnout 30,67676.0-0.8
Labour hold Swing −6.0
Rhondda East
PartyCandidateVotes%±%
Labour David Watts-Morgan 21,33871.9+16.9
Unionist Alfred John Orchard8,34628.1n/a
Majority12,99243.8+33.8
Turnout 74.6-6.3
Labour hold Swing n/a
Rhondda West
PartyCandidateVotes%±%
Labour William John 18,20665.4+3.3
Liberal John Robert Jones9,64034.6NA
Majority8,56630.8+6.6
Turnout 27,84678.5-5.2
Labour hold Swing n/a
Swansea East [3]
PartyCandidateVotes%±%
Labour David Williams 12,73557.4+6.5
Liberal Thomas Artemus Jones 9,46342.6-6.5
Majority3,27214.8+13.0
Turnout 81.1-0.6
Labour hold Swing +6.5
Swansea West [6]
PartyCandidateVotes%±%
Labour Howel Samuel 9,26034.8+2.7
Liberal Alfred Mond 9,14534.3-1.2
Unionist William Hewins 8,23830.9-1.5
Majority1150.5n/a
Turnout 85.3+1.4
Labour gain from Liberal Swing +1.9
Wrexham
PartyCandidateVotes%±%
Labour Robert Richards 12,91839.0+3.2
Liberal Horace Alexander Morgan11,03733.4+0.8
Unionist Edmund Fleming Bushby 9,13127.6-4.0
Majority1,8815.6+2.4
Turnout 81.1-3.3
Labour hold Swing +1.2

Northern Ireland

Antrim (2 seats)
PartyCandidateVotes%±%
Ulster Unionist Charles Craig unopposedn/an/a
Ulster Unionist Hugh O'Neill unopposedn/an/a
Ulster Unionist hold Swing n/a
Armagh
PartyCandidateVotes%±%
Ulster Unionist William Allen unopposedn/an/a
Ulster Unionist hold Swing n/a
Belfast East
PartyCandidateVotes%±%
Ulster Unionist Herbert Dixon unopposedn/an/a
Ulster Unionist hold Swing n/a
Belfast North
PartyCandidateVotes%±%
Ulster Unionist Thomas McConnell 16,77152.5n/a
Ind. Unionist Tommy Henderson 15,17147.5n/a
Majority1,6005.0n/a
Turnout 31,94268.2n/a
Ulster Unionist hold Swing n/a
Belfast South
PartyCandidateVotes%±%
Ulster Unionist Thomas Moles unopposedn/an/a
Ulster Unionist hold Swing n/a
Belfast West
PartyCandidateVotes%±%
Ulster Unionist Robert Lynn 24,97552.9n/a
Belfast Labour Harry Midgley 22,25547.1n/a
Majority2,7205.8n/a
Turnout 70.3n/a
Ulster Unionist hold Swing
Down (2 seats)
PartyCandidateVotes%±%
Ulster Unionist David Reid unopposedn/an/a
Ulster Unionist John Simms unopposedn/an/a
Ulster Unionist hold Swing n/a
Fermanagh and Tyrone (2 seats)
PartyCandidateVotes%±%
Nationalist Thomas Harbison 44,00327.00.0
Nationalist Cahir Healy 43,66826.80.0
Ulster Unionist James Pringle 37,73323.10.0
Ulster Unionist Charles Falls 37,68223.10.0
Majority5,9353.70.0
Turnout
Nationalist hold Swing 0.0
Londonderry
PartyCandidateVotes%±%
Ulster Unionist Malcolm Macnaghten unopposedn/an/a
Ulster Unionist hold Swing n/a

Universities

Cambridge University (2 seats)
PartyCandidateFPv%Count
12
Unionist John Rawlinson 40.854,207 
Unionist Geoffrey G. Butler 27.612,8443,560
Independent Liberal J. R. M. Butler 31.543,2483,283
Electorate: 14,974  Valid: 10,229  Quota: 3,434  Turnout: 68.78%  
    Combined English Universities (2 seats)
    PartyCandidateVotes%±%
    Unionist Martin Conway 1,71144.1+11.3
    Liberal H. A. L. Fisher 1,31634.0+5.3
    Labour Joseph John Findlay85021.9+9.7
    Turnout 5,00877.4+3.1
    Combined Scottish Universities
    PartyCandidateVotes%±%
    Unionist George Berry unopposedn/an/a
    Liberal Dugald Cowan unopposedn/an/a
    Unionist Henry Craik unopposedn/an/a
    London University
    PartyCandidateVotes%±%
    Unionist Sydney Russell-Wells 4,03750.15-1.4
    Liberal Albert Pollard 2,59332.21+2.9
    Labour H. G. Wells 1,42017.64-1.5
    Majority1,44417.94-4.3
    Turnout 8,05071.3+3.6
    Unionist hold Swing -2.1
    Oxford University (2 seats)
    PartyCandidateFPv%Count
    12
    Unionist Hugh Cecil 43.773,560 
    Unionist Charles Oman 27.122,2062,950
    Liberal Gilbert Murray 29.112,3682,472
    Electorate: 10,814  Valid: 8,134  Quota: 2,712  Turnout: 75.22%  
      Queen's University of Belfast
      PartyCandidateVotes%±%
      Ulster Unionist Thomas Sinclair unopposedn/an/a
      Ulster Unionist hold Swing n/a
      University of Wales
      PartyCandidateVotes%±%
      Christian Pacifist George M. Ll. Davies 57035.7n/a
      Liberal Joseph Jones56035.1-0.8
      Independent Liberal John Edwards46729.2n/a
      Majority100.6n/a
      Turnout 83.1-4.1
      Independent gain from Liberal Swing n/a

      Related Research Articles

      <span class="mw-page-title-main">Swing state</span> Term for any American state where neither partys candidate for election has overwhelming support

      In American politics, a swing state is any state that could reasonably be won by either the Democratic or Republican candidate in a statewide election, most often referring to presidential elections, by a swing in votes. These states are usually targeted by both major-party campaigns, especially in competitive elections. Meanwhile, the states that regularly lean to a single party are known as "safe states", as it is generally assumed that one candidate has a base of support from which a sufficient share of the electorate can be drawn without significant investment or effort by the campaign.

      <span class="mw-page-title-main">Paul Tyler</span> British politician

      Paul Archer Tyler, Baron Tyler, is a Liberal Democrat politician in the United Kingdom. He was a Member of Parliament (MP) from February to October 1974 and from 1992 to 2005, and sat in the House of Lords as a life peer until October 2021.

      <span class="mw-page-title-main">Burnley (UK Parliament constituency)</span> UK Parliament constituency in England since 1868

      Burnley is a constituency centred on the town of Burnley in Lancashire which has been represented since 2019 by Antony Higginbotham, a Conservative.

      <span class="mw-page-title-main">Bassetlaw (UK Parliament constituency)</span> Parliamentary constituency in the United Kingdom, 1885 onwards

      Bassetlaw is a parliamentary constituency in Nottinghamshire, represented in the House of Commons of the UK Parliament since the 2019 general election by Brendan Clarke-Smith, a Conservative. Before that election, the seat had been part of the so-called "red wall", being held by the Labour Party since 1935.

      <span class="mw-page-title-main">North East Derbyshire (UK Parliament constituency)</span> Parliamentary constituency in the United Kingdom, 1885 onwards

      North East Derbyshire is a constituency created in 1885 represented in the House of Commons of the UK Parliament since 2017 by Lee Rowley of the Conservative Party. This was the first time a Conservative candidate had been elected since 1935.

      <span class="mw-page-title-main">Gloucester (UK Parliament constituency)</span> Parliamentary constituency in the United Kingdom, 1885 onwards

      Gloucester is a constituency centred on the cathedral city and county town of the same name, represented in the House of Commons of the UK Parliament by Richard Graham of the Conservative Party.

      <span class="mw-page-title-main">Glasgow Tradeston (UK Parliament constituency)</span> Parliamentary constituency in the United Kingdom, 1885–1955

      Glasgow Tradeston was a burgh constituency represented in the House of Commons of the Parliament of the United Kingdom from 1885 until 1955. It elected one Member of Parliament (MP) using the first-past-the-post voting system.

      <span class="mw-page-title-main">Nelson (New Zealand electorate)</span> Electoral district in Nelson, New Zealand

      Nelson is a New Zealand parliamentary electorate, returning one Member of Parliament to the House of Representatives of New Zealand. From 1853 to 1860, the electorate was called Town of Nelson. From 1860 to 1881, it was City of Nelson. The electorate is the only one that has continuously existed since the 1st Parliament in 1853.

      <span class="mw-page-title-main">Tauranga (New Zealand electorate)</span> Electoral district in Bay of Plenty, New Zealand

      Tauranga is a New Zealand parliamentary electorate, returning one Member of Parliament to the New Zealand House of Representatives. The current MP for Tauranga is Sam Uffindell of the National Party, who won the seat in the 2022 Tauranga by-election, following the resignation of the previous MP, Simon Bridges of the National Party.

      <span class="mw-page-title-main">Wellington Central (New Zealand electorate)</span> Electoral district in Wellington, New Zealand

      Wellington Central is an electorate, represented by a Member of Parliament in the New Zealand House of Representatives. The current MP for Wellington Central is Tamatha Paul of the Green Party. She has held this position since the 2023 general election.

      <span class="mw-page-title-main">United States presidential election</span> Type of election in the United States

      The election of the president and the vice president of the United States is an indirect election in which citizens of the United States who are registered to vote in one of the fifty U.S. states or in Washington, D.C., cast ballots not directly for those offices, but instead for members of the Electoral College. These electors then cast direct votes, known as electoral votes, for president, and for vice president. The candidate who receives an absolute majority of electoral votes is then elected to that office. If no candidate receives an absolute majority of the votes for president, the House of Representatives elects the president; likewise if no one receives an absolute majority of the votes for vice president, then the Senate elects the vice president.

      <span class="mw-page-title-main">1923 New York state election</span>

      The 1923 New York state election was held on November 6, 1923, to elect a judge of the New York Court of Appeals, as well as all members of the New York State Assembly.

      The 1902 Bury by-election was a by-election held in England on 10 May 1902 for the House of Commons constituency of Bury in Lancashire.

      <span class="mw-page-title-main">1890–91 United States Senate elections</span>

      The 1890–91 United States Senate elections were held on various dates in various states. As these U.S. Senate elections were prior to the ratification of the Seventeenth Amendment in 1913, senators were chosen by state legislatures. Senators were elected over a wide range of time throughout 1890 and 1891, and a seat may have been filled months late or remained vacant due to legislative deadlock. In these elections, terms were up for the senators in Class 3.

      <span class="mw-page-title-main">2008 Minnesota elections</span>

      Elections were held in Minnesota on November 4, 2008. Primary elections took place on September 9, 2008.

      <span class="mw-page-title-main">Constituency election results in the 1929 United Kingdom general election</span>

      This is a complete alphabetical list of constituency election results to the 35th Parliament of the United Kingdom at the 1929 general election, held on 30 May 1929.

      This is an in-complete alphabetical list of constituency election results to the 32nd Parliament of the United Kingdom at the 1922 general election, held on Wednesday 15 November 1922.

      <span class="mw-page-title-main">United States presidential elections in Ohio</span>

      Following is a table of United States presidential elections in Ohio, ordered by year. Since its admission to statehood in 1803, Ohio has participated in every U.S. presidential election.

      <span class="mw-page-title-main">2022 Florida elections</span> Index of articles associated with the same name

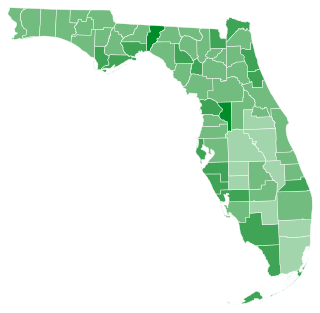
      A general election was held on Tuesday, November 8, 2022, to elect candidates throughout Florida, as part of the 2022 midterm elections. The results of the elections showed strong Republican Party outcomes as nearly every Republican candidate won in a landslide. As a result, Republicans now control every statewide office in the state for the first time since Reconstruction. Political analysts believe the results may be an indication that the state has transitioned from being a swing state into a reliably Republican red state.

      <span class="mw-page-title-main">Constituency election results in England in the 1923 United Kingdom general election</span>

      This is a complete alphabetical list of constituency election results in England to the 33rd Parliament of the United Kingdom at the 1923 general election, held on 5 December 1923. See Constituency election results in the 1923 United Kingdom general election for the rest of the United Kingdom.

      References

      1. 1 2 3 4 5 6 7 8 9 10 11 12 13 14 15 16 17 18 19 20 21 22 23 24 25 26 27 28 29 30 31 32 33 34 35 36 37 38 39 40 41 42 43 44 45 46 47 48 49 The Times, 8 December 1923
      2. 1 2 The Times, 11 December 1923
      3. 1 2 3 4 5 6 7 8 9 10 11 British Parliamentary Election Results 1918–1949, FWS Craig
      4. The Constitutional Year Book, 1932
      5. The Constitutional Year Book 1929
      6. 1 2 3 4 5 6 7 8 9 10 11 12 13 Etholiadau'r ganrif 1885–1997, Beti Jones
      7. House of Commons Information Office Email Dated 18 December 2008