United Kingdom general elections overview

Last updated

This is an overview of United Kingdom general election results since 1922. The 1922 election was the first election in the new United Kingdom of Great Britain and Northern Ireland, after the creation of the Irish Free State removed Southern Ireland from the UK.

Contents

Summary

Table

The table below gives a summary of the results of each general election since 1922 for the main political parties. Parties with the highest vote share and the most seats at each election are highlighted in bold. More comprehensive detail showing all parties which fielded candidates is shown in the subsequent sections. Please refer to notes below the table.

Party --> Conservative 1 Labour Liberal Democrats 2SNP/PC 3N.Ireland 4Other%

Turnout

Total

Seats

Year% voteSeats% voteSeats% voteSeats% voteSeats% voteSeats% voteSeats
1922 538.534429.714228.8115Included in

Other

(no seats won)

Ulster Unionist

included with

Conservative

3.01473.0615
1923 38.025830.719129.71581.6871.1615
1924 46.841233.315117.8402.11277.0615
1929 38.126037.128723.6591.2976.3615
1931 660.752230.6526.5322.2976.4615
1935 653.342938.01546.7212.01171.1615
1945 39.621048.03939.0123.42572.8640
1950 43.429946.13159.191.4283.9625
1951 48.032148.82952.560.7382.6625
1955 49.734546.42772.761.2276.8630
1959 49.436543.42585.961.3178.7630
1964 43.430444.131711.291.3077.1630
1966 41.925348.03648.5121.6175.8630
1970 46.433043.12887.561.711.3572.0630
1974 (Feb) 37.929737.230119.3142.592.3120.8278.8635
1974 (Oct) 35.827739.231918.3133.5142.4120.8072.8635
1979 43.933936.926913.8112.042.2121.2076.0635
1983 42.439727.620925.4231.542.5170.6072.7650
1987 42.237630.822922.6221.762.2170.5075.3650
1992 41.933634.427117.8202.472.3171.2077.7651
1997 30.716543.241916.8462.5102.5184.3171.3659
2001 31.716640.741318.3522.593.1183.7159.4659
2005 32.419835.235622.1622.492.6185.3361.4646
2010 36.130729.025823.0572.392.3187.3165.1650
2015 736.833130.42327.885.3592.31817.4266.4650
2017 42.331840.02627.4123.5392.5184.3168.8650
2019 43.636532.220311.5114.4522.5185.8167.3650

|- !2024

Notes

1Includes Ulster Unionists up to and including the 1970 election, and the autonomous Unionist Party in Scotland until 1964. Also includes the Liberal National Party (and joint candidates) from 1945 to 1966.

2 Liberal Party up to 1979; SDP-Liberal Alliance in 1983 and 1987; Liberal Democrats from 1992.

3 Scottish National Party and Plaid Cymru (Party of Wales) combined. Prior to 1970, these are included in the Other column.

4Northern Ireland parties: up to 1970, party affiliations largely followed those of the rest of the UK (with Ulster Unionists included with the Conservatives); from 1974, Northern Ireland had a completely independent party system and the vote share and seats listed represent the totals for Northern Ireland.

5In 1922 the Liberals were split between the main Liberal Party (18.9%, 62 seats) and the National Liberals (9.9%, 53 seats).

6In 1931 and 1935 the figures for the Conservatives relate to National Government candidates and comprise Conservative, National Labour, Liberal National and National vote share and seats.

7In 2015, Other included record votes shares for both the UK Independence Party 12.6% and the Green Party (3.8%), each winning just 1 seat.

Graphs

United Kingdom votes percentage United Kingdom votes %25.svg
United Kingdom votes percentage
United Kingdom seats United Kingdom seats.svg
United Kingdom seats

2015–2019

The period from 2015 to 2019 was one of the most turbulent periods in British electoral history. Following the Conservative–Liberal Democrat coalition, the Conservatives, led by David Cameron, won the 2015 general election with a small majority, having promised to hold a referendum on continued membership of the European Union. This election saw the Liberal Democrats vote fall from 23% to 8% and MPs elected from 57 to 8. In terms of the popular vote, they were replaced as the third party by the UK Independence Party, who achieved 13%, although they won only 1 seat. The Green Party also achieved their best ever result with 4% of the popular vote. In Scotland, the Scottish National Party gained 50% of the popular vote, winning all but three of the 59 seats, mostly at the expense of the Labour Party.

Following the EU referendum held in June 2016, which resulted in a majority of 52:48 to leave, David Cameron resigned as Prime Minister and was replaced by Theresa May. In June 2017, May called a snap election; but the Conservatives lost their overall majority and had to rely on the support of the 10 MPs from the Democratic Unionist Party to continue in Government. The following two years were dominated by attempts to pass through Parliament a negotiated deal on the terms for leaving the EU, but these were opposed by both Brexiteers and Remainers in the Conservative Party, as well as the Opposition parties. Eventually, Mrs May resigned and Boris Johnson became Prime Minister.

After further government defeats, a general election was held in December 2019 - the first December election since 1923 - which resulted in an 80-seat majority for the Conservatives, gaining many seats which Labour had held since at least 1945. The United Kingdom formally left the European Union on 31 January 2020.

Party 2019 2017 2015
Popular vote (%)SeatsPopular vote (%)SeatsPopular vote (%)Seats
Advance Together 0.00----
Alliance (NI) 0.410.200.20
Alliance for Green Socialism0.000.000.00
Animal Welfare Party 0.000.000.00
Aontu 0.00----
BNP 0.000.000.00
Christian 0.000.000.00
Christian Peoples Alliance 0.000.000.00
Communist ----0.00
Communities United 0.00----
Conservative Party 43.636542.331736.2330
Democratic Unionist Party 0.880.9100.68
English Democrats Party 0.000.000.00
Green Party of England and Wales 2.611.613.81
Green Party of Northern Ireland 0.00----
Gwlad Gwlad 0.00----
Independents 0.800.510.31
Independent Group for Change 0.00----
Justice and Anti-corruption0.00----
Labour Party 32.220340.026230.4232
Liberal Democrats 11.5117.4127.88
Liberal Party 0.000.000.00
Libertarian0.00----
Mebyon Kernow 0.00--0.00
Monster Raving Loony 0.000.000.00
National Front ---0.00
National Health Action --0.100.10
North East Party 0.00----
Peace Party 0.00----
People Before Profit 0.00----
Plaid Cymru 0.540.540.63
RESPECT The Unity Coalition ----0.00
Scottish Family Party0.00----
Scottish Green Party 0.100.000.10
Scottish National Party 3.9483.0354.759
Scottish Socialist Party ----0.00
Sinn Féin 0.670.770.64
SDLP 0.420.300.33
Social Democratic Party 0.000.000.00
Socialist Equality Party 0.00----
Socialist Labour --0.000.00
Socialist Party of GB 0.00----
The Brexit Party 2.00----
The Yorkshire Party 0.10----
Trade Unionist and Socialist Coalition ----0.10
Traditional Unionist Voice --0.000.10
Ulster Unionist 0.300.300.42
UK Independence Party 0.101.8012.61
Veteran and People's Party 0.00----
Women's Equality Party 0.00----
Workers' Party --0.000.00
Workers Revolutionary Party 0.00----
Yeshua0.00----
Young People's Party0.00----

1979–2010

This period saw five prime ministers, with Margaret Thatcher and Tony Blair the two longest serving post-World War II prime ministers [1] in the UK (the other prime ministers during this period being John Major, Gordon Brown and David Cameron). There was also a mini-revival of the Liberal Party which, after a merger with the Social Democratic Party became the Liberal Democrats and increased their seats in parliament from 11 in the 1979 election to 62 in 2005.

Following their victory in 1979, the Conservatives were also successful in the subsequent three general elections, resulting in 18 years of continuous power. The newly formed Social Democratic Party and the Liberal Party contested the 1983 and 1987 elections as the SDP-Liberal Alliance. Although the combined parties achieved a popular vote of 22.6% in 1983, they initially failed to make a breakthrough in terms of seats, winning 22.

The Labour party won a landslide victory in 1997 and were also successful in 2001 and 2005. The now merged Liberal Democrats also improved their seat count in this period. The outcome of the 2010 election brought about the first hung parliament since 1974. The victorious Conservative Party accepted the Liberal Democrats as their coalition partner.

In Northern Ireland, the Good Friday Agreement has led to a reduction in conflict, though the traditional parties who gained power in the 1980s, such as the Ulster Unionist Party, have been replaced as the dominant powers by the likes of Sinn Féin and the Democratic Unionist Party.

The elections of the 1990s and 2000s (decade) also saw a proliferation of smaller parties, with more parties standing at the 2005 general election than ever before. [2] Voter turnout also fell during this period, with the 2001 election seeing a post-World War II low of 59.4%. [3]

Party 2010 2005 2001 1997 1992 1987 1983 1979
Popular vote (%)SeatsPopular vote (%)SeatsPopular vote (%)SeatsPopular vote (%)SeatsPopular vote (%)SeatsPopular vote (%)SeatsPopular vote (%)SeatsPopular vote (%)Seats
Alliance (NI) 0.110.100.100.200.200.200.200.30
Alliance for Green Socialism0.000.000.00----------
BNP 1.900.700.200.100.100.000.00--
Christian 0.10
Christian Peoples0.000.00------------
Communist 0.000.000.000.000.000.100.000.10
Community Action Party --0.00------------
Conservative Party 36.130632.419831.716630.716541.933642.237642.439743.9339
Democratic Unionist 0.680.990.750.320.330.330.530.23
English Democrats Party 0.200.10------------
Green Party of England and Wales / Green Party 0.911.000.600.300.500.300.200.10
Independents 0.210.510.400.110.10--0.10--
Independent Conservative------0.000.10--0.000.00
IKHHC 0.100.110.11----------
Independent Labour------0.000.10--0.100.11
Independent Liberal / Independent Liberal Democrat------0.00--0.000.000.00
Independent SDLP--------------0.00
Irish Independence --------------0.10
Labour Party 29.025835.235640.741243.241834.427130.822927.620936.9269
Legalise Cannabis Alliance --0.000.00----------
Liberal Democrats/
SDP–Liberal Alliance/
Liberal Party (UK)
23.05722.16218.35216.84617.82022.62225.42313.811
Liberal Party (1989) 0.000.100.100.100.20------
Mebyon Kernow 0.000.000.000.000.000.000.00--
Monster Raving Loony 0.000.000.00000.100.000.00--
National Front 0.000.000.000.000.100.000.100.60
National Democrats ------0.00--------
Natural Law Party ------0.100.20------
People's Justice Party ----0.00----------
Plaid Cymru 0.630.630.740.540.540.430.420.41
Progressive Unionist Party ----0.000.10--------
ProLife Alliance ----0.000.10--------
Protestant Unionist ----------0.00----
Referendum Party ------2.6.--------
RESPECT The Unity Coalition 0.100.31------------
Scottish Green Party 00.10.10------------
Scottish Labour Party --------------0.10
Scottish Militant Labour --------0.10------
Scottish National Party 1.761.661.852.061.931.331.111.62
Scottish Socialist Party 0.000.200.300.00--------
Sinn Féin / Independent Republican 0.650.650.740.420.200.310.310.11
SDLP 0.430.530.630.630.540.530.410.41
Social Democratic Party 0.00------0.10See SDP-Liberal Alliance--
Socialist Labour 0.000.100.200.20--------
Socialist Alliance --0.000.000.00--------
Trade Unionist and Socialist Coalition 0.10--------------
Traditional Unionist Voice 0.10--------------
Ulster Popular Unionist / Independent Ulster Unionist--------0.110.110.110.11
Ulster Unionist / Ulster Conservatives and Unionists - New Force0.300.510.860.8100.890.890.810.85
Unionist Party --------------0.00
United Ulster Unionist --------------0.11
UK Independence Party 3.102.301.500.30--------
UK Unionist / Real Unionist ----0.100.11--0.10----
Veritas --0.10-----------
Workers' Party --0.000.000.000.100.100.000.10

1955–1974

The elections of this period took place in the context of the decolonialisation of the British Empire and the UK's declining status as a Great Power. [4] It also saw the UK enter the European Union and some periods of high unemployment. [5] The early years of the period saw Conservative consolidation of power, before Harold Wilson's two general election wins in 1964 and 1966. There was then a series of close fought elections, including two in 1974. This period was also the one in which the Liberal Party was at its all-time low, never having more than 14 seats (though it had been in 1951 when they'd had their lowest ever percentage of the vote).

The Ulster Unionists dominated in Northern Ireland, whilst the Scottish National Party and Plaid Cymru became major players for the first time, the SNP gaining 11 seats in 1974. This period also saw the demise of the autonomous Unionist Party in Scotland and the National Liberal Party, which both merged with the Conservative Party.

Party Oct 1974 Feb 1974 1970 1966 1964 1959 1955
Popular vote (%)SeatsPopular vote (%)SeatsPopular vote (%)SeatsPopular vote (%)Popular vote (%)SeatsPopular vote (%)SeatsPopular vote (%)Seats
Alliance (NI) 0.200.10----------
BNP ------0.00-----
Communist 0.100.100.100.200.200.100.10
Conservative Party 35.827737.929746.433041.925343.430449.436549.7345
Democratic Labour 0.100.11----------
Democratic Party ----0.10--------
Democratic Unionist Party 0.310.21----------
Independents 0.000.100.100.100.100.000.20
Independent Conservative0.000.000.100.000.000.11--
Independent Labour0.200.110.110.00----0.00
Independent Liberal0.000.200.000.000.100.00--
Independent Socialist--0.00----------
Independent Republican / Sinn Féin 0.210.00--0.200.400.200.62
Labour Party 39.231337.230143.128848.036444.131743.425846.4277
Labour Party (Ireland) ------------0.10
Labour Party(NI) 0.000.00----------
Liberal Party 18.31319.3147.568.51211.295.962.76
National Front 0.400.200.10--------
National Democratic ----0.100.000.00--
National Democrats (NI) ----0.10--------
Nationalist (NI) ------0.10------
NI Independent Labour ----------0.10
Plaid Cymru 0.630.520.600.200.200.300.20
Protestant Unionist Party ----0.11--------
Republican Clubs 0.100.00----------
Republican Labour ----0.110.110.10--
Scottish National Party 2.9112.071.110.500.200.100.00
SDLP 0.610.51----------
Ulster Unionist Party 0.960.87Before 1974, The UUP MPs sat in parliament as part of the Conservative Party
Unionist (NI) / Pro-Assembly Unionist 0.100.30----------
Unity --0.000.42--------
Vanguard Progressive Unionist Party 0.330.23----------

1929–1951

This era saw massive social change in the UK, going through the Great Depression of the 1930s, resulting in a National Government; the Coalition Government of the Second World War led by Winston Churchill; and the socialist Labour government of Clement Attlee. [6] This was also the period of the Liberal Party's major collapse and the completion of Labour's rise to power.

The 1929 election resulted in the Labour Party having the greatest number of seats and they formed a Government under Ramsay MacDonald with the support of the Liberals. As a result of the growing economic crisis, McDonald formed a National Government in 1931 with the support of the Conservatives and Liberals, which was not however backed by the majority of Labour MPs. This was followed by a general election at which the National coalition, dominated by the Conservatives, won a landslide victory, with the opposition Labour Party reduced to a rump of 52 seats. It also led to a permanent split in the Liberal Party, with the National Liberals eventually joining the Conservatives. Although Labour recovered somewhat, the (notional) National Government won the 1935 election.

General elections were suspended during the Second World War, when all three major parties entered into a coalition under Churchill. The Labour party gained a landslide victory in 1945. Although they won a small majority in the 1950, they were defeated by the Conservatives in 1951, with Churchill returning to power.

Party 1951 1950 1945 1935 1931 1929
Popular vote (%)SeatsPopular vote (%)SeatsPopular vote (%)SeatsPopular vote (%)SeatsPopular vote (%)SeatsPopular vote (%)Seats
Agricultural Party ----0.000.000.00-
Anti-Partition 0.000.00--------
Common Wealth ----0.51------
Commonwealth Labour ----0.10------
Communist 0.100.300.420.110.300.20
Conservative Party 44.330240.028336.219747.838755.047038.1260
Independent 0.100.200.680.120.010.44
Independent Conservative0.000.100.220.10----
Independent Labour--0.100.320.100.100.11
Independent Labour Party 0.000.000.230.74----
Independent Liberal--0.100.120.000.000.10
Independent Nationalist0.32--0.00--0.00--
Independent Progressive----0.110.00----
Independent Republican------0.20----
Irish Nationalist --0.220.420.220.420.13
Labour Party 48.829546.131547.739338.015430.85237.1287
Labour Party (Ireland) 0.110.20--------
Liberal Party 2.569.199.04126.7216.53223.659
Liberal Party (Lloyd George)-------0.54--
Liverpool Protestant ----0.000.000.00--
National ----0.520.310.54--
National Independent--0.000.320.220.22--
National Labour --0.00--1.581.513--
National Liberal 3.7193.4162.9113.7333.735--
National Party of Scotland --------0.100.00
New Party --------0.20--
Plaid Cymru 0.000.100.000.000.000.00
Scottish National Party 0.000.000.100.20----
Scottish Prohibition --------0.100.11
Sinn Féin 0.100.10--------

1922–1924

In the years after the secession of the Irish Free State, the Conservatives led the House of Commons, followed by a surging Labour Party and a declining Liberal Party. The Communist Party of Great Britain also enjoyed their most prolonged period of success, though still failed to have more than 1 MP at any time.

The 1922 election was won by the Conservatives, with the Labour party in second place and the Liberals split. In 1923, the Conservatives lost their majority and the Labour Party were put into office for the first time with the support of the re-united Liberals. However, this minority government only lasted 10 months and the 1924 election saw the return of the Conservatives with a large majority and the Liberal Party reduced to a rump of 40 MPs, from which they never really recovered.

Party 1924 1923 1922
Popular vote (%)SeatsPopular vote (%)SeatsPopular vote (%)Seats
Agricultural Party ----0.20
Belfast Labour Party 0.20----
Communist 0.210.200.21
Constitutionalist 1.270.100.11
Conservative 46.841238.025838.5344
Independent 0.220.320.83
Independent Conservative0.000.100.93
Independent Labour0.000.200.11
Independent Liberal--0.110.11
Independent Nationalist----0.10
Irish Nationalist 0.010.430.43
Labour Party 33.315130.719129.7142
Labour Party (Northern Ireland) 0.10----
Liberal Party 17.84029.715818.962
National Liberal ----9.953
Scottish Prohibition 0.110.110.11
Sinn Féin 0.20----

See also

Related Research Articles

<span class="mw-page-title-main">2001 United Kingdom general election</span>

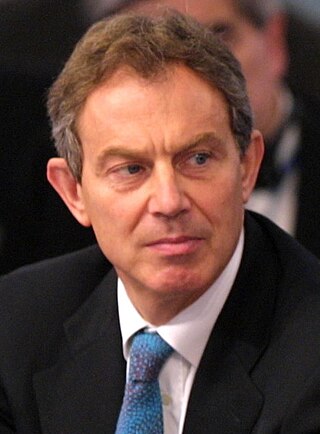
The 2001 United Kingdom general election was held on Thursday 7 June 2001, four years after the previous election on 1 May 1997, to elect 659 members to the House of Commons. The governing Labour Party was re-elected to serve a second term in government with another landslide victory with a 167 majority, returning 412 members of Parliament versus 418 from the 1997 general election, a net loss of six seats, though with a significantly lower turnout than before—59.4%, compared to 71.6% at the previous election. The number of votes Labour received fell by nearly three million. Tony Blair went on to become the only Labour Prime Minister to serve two consecutive full terms in office. As Labour retained almost all of their seats won in the 1997 landslide victory, the media dubbed the 2001 election "the quiet landslide".

<span class="mw-page-title-main">Politics of the United Kingdom</span> Political system of the United Kingdom of Great Britain and Northern Ireland

The politics of the United Kingdom functions within a constitutional monarchy where executive power is delegated by legislation and social conventions to a unitary parliamentary democracy. From this a hereditary monarch, currently King Charles III, serves as head of state while the Prime Minister of the United Kingdom, currently Rishi Sunak since 2022, serves as the elected head of government.

<span class="mw-page-title-main">1997 United Kingdom general election</span>

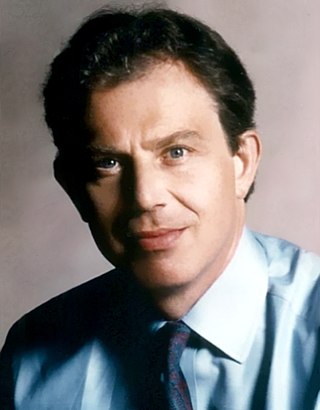
The 1997 United Kingdom general election was held on Thursday, 1 May 1997. The governing Conservative Party led by Prime Minister John Major was defeated in a landslide by the Labour Party led by Tony Blair, achieving a 179-seat majority.

<span class="mw-page-title-main">1987 United Kingdom general election</span>

The 1987 United Kingdom general election was held on Thursday 11 June 1987, to elect 650 members to the House of Commons. The election was the third consecutive general election victory for the Conservative Party, who won a majority of 102 seats and second landslide under the leadership of Margaret Thatcher, who became the first Prime Minister since the Earl of Liverpool in 1820 to lead a party into three successive electoral victories.

<span class="mw-page-title-main">Politics of Scotland</span>

The politics of Scotland operate within the constitution of the United Kingdom, of which Scotland is a country. Scotland is a democracy, being represented in both the Scottish Parliament and the Parliament of the United Kingdom since the Scotland Act 1998. Most executive power is exercised by the Scottish Government, led by the First Minister of Scotland, the head of government in a multi-party system. The judiciary of Scotland, dealing with Scots law, is independent of the legislature and the Scottish Government. Scots law is primarily determined by the Scottish Parliament. The Scottish Government shares some executive powers with the Scotland Office, a British government department led by the Secretary of State for Scotland.

<span class="mw-page-title-main">February 1974 United Kingdom general election</span>

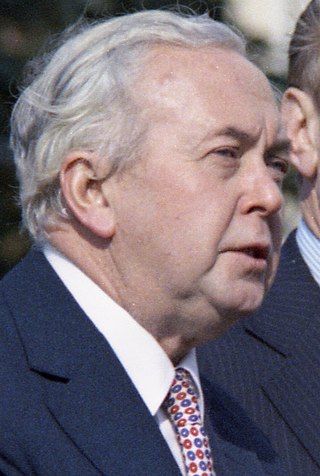
The February 1974 United Kingdom general election was held on Thursday 28 February 1974. The Labour Party, led by Leader of the Opposition and former Prime Minister Harold Wilson, gained 14 seats but was seventeen short of an overall majority. The Conservative Party, led by incumbent Prime Minister Edward Heath, lost 28 seats. That resulted in a hung parliament, the first since 1929. Heath sought a coalition with the Liberals, but the two parties failed to come to an agreement and so Wilson became Prime Minister for a second time, his first with a minority government. Wilson called another early election in September, which was held in October and resulted in a Labour majority. The February election was also the first general election to be held with the United Kingdom as a member state of the European Communities (EC), which was widely known as the "Common Market".

<span class="mw-page-title-main">October 1974 United Kingdom general election</span>

The October 1974 United Kingdom general election took place on Thursday 10 October 1974 to elect 635 members of the British House of Commons. It was the second general election held that year; the first year that two general elections were held in the same year since 1910; and the first time that two general elections were held less than a year apart from each other since the 1923 and 1924 elections, which took place 10 months apart. The election resulted in the Labour Party, led by Prime Minister Harold Wilson, winning a bare majority of three seats. That enabled the remainder of the Labour government to take place, but it saw a gradual loss of its majority.

<span class="mw-page-title-main">1950 United Kingdom general election</span>

The 1950 United Kingdom general election was the first ever to be held after a full term of Labour government. The election was held on Thursday 23 February 1950, and was the first held following the abolition of plural voting and university constituencies. The government's 1945 lead over the Conservative Party shrank dramatically, and Labour was returned to power but with an overall majority reduced from 146 to just 5. There was a 2.8% national swing towards the Conservatives, who gained 90 seats. Labour called another general election in 1951, which the Conservative Party won.

<span class="mw-page-title-main">1951 United Kingdom general election</span> October 1951 general election

The 1951 United Kingdom general election was held twenty months after the 1950 general election, which the Labour Party had won with a slim majority of just five seats. The Labour government called a snap election for Thursday 25 October 1951 in the hope of increasing its parliamentary majority. However, despite winning the popular vote and achieving both the highest-ever total vote until it was surpassed by the Conservative Party in 1992 and again in 2019 and the highest percentage vote share, Labour won fewer seats than the Conservative Party. That was caused mainly by the collapse of the Liberal vote, which enabled the Conservatives to win seats by default. The election marked the return of Winston Churchill as Prime Minister and the beginning of Labour's 13-year spell in opposition. It was the third and final general election to be held during the reign of King George VI, as he died the following year on 6 February and was succeeded by his daughter, Elizabeth II. It was the last election in which the Conservatives did better in Scotland than in England.

<span class="mw-page-title-main">1955 United Kingdom general election</span>

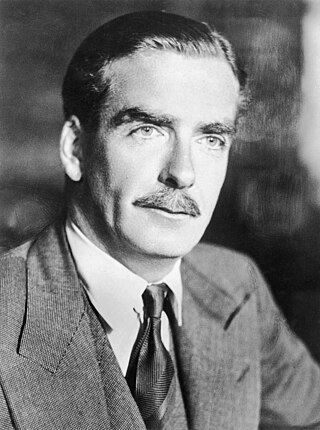
The 1955 United Kingdom general election was held on Thursday 26 May 1955, four years after the previous general election in 1951. It was a snap election: after Winston Churchill retired in April 1955, Anthony Eden took over and immediately called the election in order to gain a mandate for his government. It resulted in a majority of 60 seats for the government; the result remains the largest party share of the vote at a post-war general election. This was the first general election to be held during the reign of Elizabeth II. She had succeeded her father George VI the year after the previous election.

A hung parliament is a term used in legislatures primarily under the Westminster system to describe a situation in which no single political party or pre-existing coalition has an absolute majority of legislators in a parliament or other legislature. This situation is also known as a balanced parliament, or as a legislature under no overall control (NOC), and can result in a minority government.

<span class="mw-page-title-main">2005 United Kingdom general election</span>

The 2005 United Kingdom general election was held on Thursday 5 May 2005, to elect 646 members to the House of Commons. The governing Labour Party, led by Tony Blair, won its third consecutive victory, with Blair becoming the second Labour leader after Harold Wilson to form three majority governments. However, its majority fell to 66 seats; the majority it won four years earlier had been of 167 seats. This was the first time the Labour Party had won a third consecutive election, and as of 2024 remains the party's most recent general election victory.

<span class="mw-page-title-main">2010 United Kingdom general election</span>

The 2010 United Kingdom general election was held on Thursday 6 May 2010, with 45,597,461 registered voters entitled to vote to elect members to the House of Commons. The election took place in 650 constituencies across the United Kingdom under the first-past-the-post system.

<span class="mw-page-title-main">History of the Conservative Party (UK)</span> Aspect of British political history

The Conservative Party is the oldest political party in the United Kingdom and second in the world. The current party was first organised in the 1830s and the name "Conservative" was officially adopted, but the party is still often referred to as the Tory party. The Tories had been a coalition that more often than not formed the government from 1760 until the Reform Act 1832. Modernising reformers said the traditionalistic party of "Throne, Altar and Cottage" was obsolete, but in the face of an expanding electorate 1830s–1860s it held its strength among royalists, devout Anglicans and landlords and their tenants.

Parliamentary by-elections in the United Kingdom occur when a Member of Parliament (MP) vacates a House of Commons seat during the course of a parliament.

In parliamentary politics, balance of power is a situation in which one or more members of a parliamentary or similar chamber can by their uncommitted vote enable a party to attain and remain in minority government. The term may also be applied to the members who hold that position. The members holding the balance of power may guarantee their support for a government by either joining it in a coalition government or by an assurance that they will vote against any motion of no confidence in the government or will abstain in such a vote. In return for such a commitment, such members may demand legislative or policy commitments from the party they are to support. A person or party may also hold a balance of power in a chamber without any commitment to government, in which case both the government and opposition groupings may on occasion need to negotiate for that person's or party's support.

<span class="mw-page-title-main">1979 vote of no confidence in the Callaghan ministry</span> Political event in the UK

A vote of no confidence in the British Labour government, 1974–1979, of James Callaghan occurred on 28 March 1979. The vote was brought by the Official Opposition leader Margaret Thatcher and was lost by the Labour government by one vote, which was announced at 10:19 pm. The result mandated a general election that was won by Thatcher's Conservative Party. The last time an election had been forced by the UK House of Commons was in 1924, when Ramsay MacDonald, the first Labour prime minister, lost a vote of confidence. Labour politician Roy Hattersley later remarked that the vote marked "the last rites" of Old Labour. Labour did not return to government for another 18 years, with New Labour ideology. The BBC has referred to the vote as "one of the most dramatic nights in Westminster history".

This is the results breakdown of the 2005 general election.

<span class="mw-page-title-main">2010 United Kingdom government formation</span>

The events surrounding the formation of the United Kingdom's government in 2010 took place between 7 May and 12 May 2010, following the 2010 general election, which failed to produce an overall majority for either of the country's two main political parties. The election, held on 6 May, resulted in the first hung parliament in the UK in 36 years, sparking a series of negotiations which would form the first coalition government since the Second World War.

<span class="mw-page-title-main">2015 United Kingdom general election</span>

The 2015 United Kingdom general election was held on Thursday 7 May 2015 to elect 650 Members of Parliament to the House of Commons. It was the only general election held under the rules of the Fixed-term Parliaments Act 2011 and was the last general election to be held before the United Kingdom would vote to end its membership of the European Union (EU). Local elections took place in most areas of England on the same day.

References

  1. "Tony Blair's time in power". BBC News. 6 February 2005. Retrieved 31 May 2013.
  2. Electoral commission report on 2005 election
  3. "BBC summary of elections since 1945". BBC News. Retrieved 31 May 2013.
  4. "1959 election". BBC News. 5 April 2005. Retrieved 31 May 2013.
  5. "February 1974 election". BBC News. 5 April 2005. Retrieved 31 May 2013.
  6. "Report on the 1945 election". BBC News. 5 April 2005. Retrieved 31 May 2013.