Derivation
When a sample of blood is exposed to air, either in the alveoli of the lung or in an in vitro laboratory experiment, carbon dioxide in the air rapidly enters into equilibrium with carbon dioxide derivatives and other species in the aqueous solution. Figure 1 illustrates the most important equilibrium reactions of carbon dioxide in blood relating to acid-base physiology:

Note that in this equation, the HB/B- buffer system represents all non-bicarbonate buffers present in the blood, such as hemoglobin in its various protonated and deprotonated states. Because many different non-bicarbonate buffers are present in human blood, the final equilibrium state reached at any given pCO2 is highly complex and cannot be readily predicted using theory alone. By depicting experimental results, the Davenport diagram provides a simple approach to describing the behavior of this complex system.

Figure 2 shows a Davenport diagram as commonly depicted in textbooks and the literature. To understand how the diagram is to be interpreted, it is helpful to understand how the diagram is derived in the first place. Consider the following experiment. A small sample of blood is taken from a healthy patient and placed in a chamber in which the partial pressure of carbon dioxide (PCO2) is held at 40 mmHg. Once equilibrium is reached, the pH and bicarbonate concentration are measured and plotted on a chart as in Fig. 3.

Next, the PCO2 in the chamber is held constant while the pH of the blood sample is changed, first by adding a strong acid, then by adding a strong base. As pH is varied, a titration curve for the sample is produced (Fig. 4). Notice that this titration curve is valid only at a PCO2 of 40 mmHg, because the chamber was held at this partial pressure throughout the experiment.

Next, imagine that the experimenter obtains a new, identical blood sample from the same patient. However, instead of placing the sample in a chamber with a PCO2 of 40 mmHg, the chamber is reset to a PCO2 of 60 mmHg. After equilibration, a new point is reached, indicating a new pH and a new bicarbonate concentration (Fig 5). Note that the bicarbonate concentration at the new, higher PCO2 is larger than in the first measurement, whereas the pH is now smaller. Neither result should come as a surprise. Increasing the PCO2 means that the total amount of carbon dioxide in the system has increased. Because the gaseous carbon dioxide is in equilibrium with the carbon dioxide derivatives in the solution, the concentrations of carbon dioxide derivatives, including bicarbonate, should also increase. The fall in pH is also not surprising, since the formation of a bicarbonate molecule is concomitant with the release of a proton (see Fig. 1).

If this same experiment is repeated at various partial pressures of carbon dioxide, a series of points will be obtained. One can draw a line through these points, called the buffer line (Fig. 6).

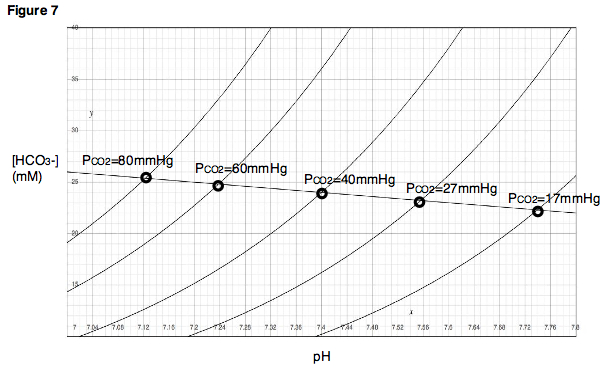
The buffer line can be used to predict the result of varying the PCO2 within a range close to the experimentally determined points. Additionally, for each experimental point, a titration experiment can be performed in which pH is varied while PCO2 is held constant, and titration curves can be generated for each of the partial pressure of carbon dioxide (Fig. 7). In the Davenport diagram, these titration curves are called isopleths, because they are generated at a fixed partial pressure of carbon dioxide.
A key concept in understanding the Davenport diagram is to note that as PCO2 is increased, the magnitude of the resulting change in pH is dependent on the buffering power of the non-bicarbonate buffers present in the solution. If strong non-bicarbonate buffers are present, then they will quickly absorb the vast majority of protons released by the formation of bicarbonate, and pH will change very little for a given rise in bicarbonate concentration. The result will be a buffer line with a very steep slope (Fig. 8). On the other hand, if only weak non-bicarbonate buffers are present (or if no non-bicarbonate buffer is present at all), then a much larger change in pH will be observed for a given change in bicarbonate concentration, and the buffer line will have a slope closer to zero.

It is instructive to note that the slope of the bicarbonate line will never actually reach zero (i.e. will never be horizontal) under equilibrium conditions, even in the complete absence of non-bicarbonate buffers. This is because the production of protons resulting from an increase in PCO2 is concomitant with the production of bicarbonate ions, as mentioned previously. Thus, a decrease in pH resulting from increased PCO2 must always occur with some minimal increase in bicarbonate concentration. Likewise, an increase in pH for similar reasons must occur with some minimal decrease in bicarbonate concentration.
Two-dimensional representation of a three-dimensional surface
Recall that the relationship represented in a Davenport diagram is a relationship between three variables: PCO2, bicarbonate concentration and pH. Thus, Fig. 7 can be thought of as a topographical map—that is, a two-dimensional representation of a three-dimensional surface—where each isopleth indicates a different partial pressure or “altitude.”
A more accurate depiction would involve three axes. Figure 9 shows a Davenport diagram in three dimensions. The light blue lines indicate the isopleths as we would normally encounter them, confined to a two-dimensional plane. The dark blue curves show the actual locations of the isopleths in three dimensions. Thus, the light blue lines are simply the projections of the isopleths in three-dimensional space onto a two-dimensional plane. Again, recall that an isopleth is just a titration curve—that is, the path that is traced if pH is varied while PCO2 is held constant. The green surface describes all combinations of PCO2, [HCO3−] and pH that satisfy equilibrium for the system. All isopleths in their actual three-dimensional orientations must be confined to this surface.

A second key concept is that movement along a buffer line must correspond to a change in PCO2. Thus, like the isopleths, the buffer line as drawn on a typical Davenport diagram (e.g., Fig 6) is actually the projection of a line existing in three-dimensional space onto a two-dimensional plane. As with the isopleths, buffer lines in their actual three-dimensional orientation are confined to the surface representing the values of PCO2, [HCO3−] and pH that satisfy equilibrium for the system. In Fig. 10, the dark red lines are the actual buffer lines in three-dimensional space, while the light red lines are the projections of the buffer lines onto a two-dimensional plane. (We will see later how multiple, parallel buffer lines can be determined for a given system).

One of the most important features of the Davenport diagram is its usefulness in depicting movement from one point on the equilibrium surface to another following changes in respiration and/or metabolism. Four fundamental changes may occur that affect acid-base balance in the body: respiratory acidosis, respiratory alkalosis, metabolic acidosis and metabolic alkalosis. Additionally, a respiratory and a metabolic disturbance may occur simultaneously, such as respiratory acidosis followed by a compensatory shift towards metabolic alkalosis.
Respiratory disturbances
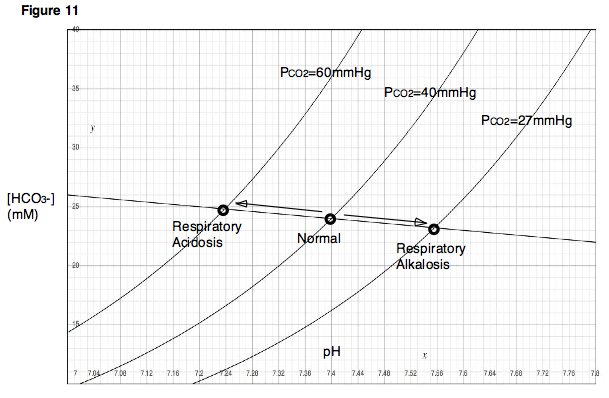
To understand how changes in respiration might affect blood pH, consider the effects of ventilation on PCO2 in the lungs. If one were to hold his or her breath (or breathe very slowly, as in the case of respiratory depression), the blood would continue delivering carbon dioxide to the alveoli in the lungs, and the amount of carbon dioxide in the lungs would increase. On the other hand, if one were to hyperventilate, then fresh air would be drawn into the lungs and carbon dioxide would rapidly be blown out. In the first case, because carbon dioxide is accumulating in the lungs, alveolar PCO2 would become very high. In the second case, because carbon dioxide is rapidly exiting the lungs, alveolar PCO2 would be very low. Note that these two situations, those of respiratory depression and hyperventilation, produce effects that are immediately analogous to the experiment described previously, in which the partial pressures of carbon dioxide were varied and the resulting changes in pH observed. As indicated by the Davenport diagram, respiratory depression, which results in a high PCO2, will lower blood pH. Hyperventilation will have the opposite effects. A decrease in blood pH due to respiratory depression is called respiratory acidosis. An increase in blood pH due to hyperventilation is called respiratory alkalosis (Fig. 11).
Changes in the metabolic composition of blood can also affect blood pH. Again, recall from our initial experiment that if strong acid or strong base is added to the blood sample, pH and bicarbonate concentration will change accordingly, resulting in a titration curve. Hydroxide ions, for example, when added to the solution, will react with free hydrogen ions and increase the pH of the solution. Additionally, hydroxide ions will abstract protons from carbonic acid in solution, causing the bicarbonate concentration to increase. The new position on the diagram following addition of hydroxide ions no longer lies on our original buffer line. However, if the PCO2 is now varied without further addition of strong acid or strong base to the solution, a new buffer line can be determined that lies above and approximately parallel to the original buffer line.
Similarly, in a physiologic system such as a living body, removal of protons, for example, by vomiting the acidic contents of the stomach, will result in an increase in pH and an increase in bicarbonate concentration, bringing the system to a new, higher buffer line. Such a disturbance is called a metabolic alkalosis (Fig. 12). Alternatively, if protons are added to the bloodstream in the form of acidic metabolites, as occurs during diabetic ketoacidosis, then pH will fall, along with bicarbonate concentration. This type of disturbance is called a metabolic acidosis. In the case of metabolic acidosis, the new buffer line lies below the original line.


