Demographics of Bhutan

Last updated

Demographics of Bhutan
Bhutan single age population pyramid 2020.png
Population pyramid of Bhutan in 2020
Population867,775 (2022 est.)
Growth rate0.97% (2022 est.)
Birth rate15.94 births/1,000 population (2022 est.)
Death rate6.22 deaths/1,000 population (2022 est.)
Life expectancy72.31 years
  male71.19 years
  female73.49 years
Fertility rate1.79 children born/woman (2022 est.)
Infant mortality rate27.04 deaths/1,000 live births
Net migration rate0 migrant(s)/1,000 population (2022 est.)
Age structure
0–14 years24.44%
15–64 years69.23%
65 and over6.33%
Sex ratio
Total1.08 male(s)/female (2022 est.)
At birth1.05 male(s)/female
Under 151.05 male(s)/female
65 and over0.97 male(s)/female
Nationality
NationalityBhutanese

This is a demography of the population of Bhutan including population density, ethnicity, education level, health of the populace, economic status, religious affiliations and other aspects of the population.

Contents

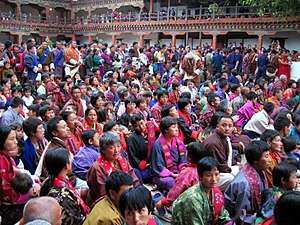
Bhutanese people in national dress at the Wangdi Phodrang festival Bhutanese people.jpg
Bhutanese people in national dress at the Wangdi Phodrang festival

The Royal Government of Bhutan listed the country's population as 752,700 in 2003. [1]

The Bhutanese numbers can be reconstructed from their 9th Five Year Plan documents, [2] which lists the exact number of households in each gewog. If the Bhutanese refugee advocate groups are correct, a spot check of a southern gewog should show a massive under-reporting of population.[ citation needed ]

The CIA World Fact book number has since been adjusted with a note of former inconsistencies, and attributes the difference to the government not including the "first modern census of Bhutan, conducted in 2005". [1] In the 1970s Bhutan was one of the most isolated countries in the world and nobody knew how many people lived there since no census had ever been taken.

Demographic statistics

The following demographic statistics are from the CIA World Factbook, unless otherwise indicated.

Population

708,427 (July 2011 est.)
716,896 (July 2012 est.)
750,125 (July 2016 est.) [3]

Population by Sex and Age Group

Population Estimates by Sex and Age Group (01.VII.2013) (Data refer to projected figures based on the Population and Housing Census 2005 (district projection)): [4]
Age GroupMaleFemaleTotal%
Total381 582351 421733 004100
0-442 72541 99984 72411,56
5-938 39637 72576 12110,38
10-1432 16931 59363 7628,70
15-1935 43234 40369 8359,53
20-2436 52634 74571 2719,72
25-2935 43332 06567 4989,21
30-3433 27928 49161 7708,43
35-3928 76624 06052 8277,21
40-4423 77419 54543 3195,91
45-4919 39116 21335 6044,86
50-5415 24513 20928 4553,88
55-5912 25710 80623 0633,15
60-649 6028 64518 2472,49
65-697 2686 74114 0091,91
70-745 1694 95610 1241,38
75-793 3383 3136 6510,91
80+2 8122 9125 7240,78
Age groupMaleFemaleTotalPercent
0-14113 290111 317224 60730,64
15-64249 705222 182471 88764,38
65+18 58717 92236 5094,98
Population by Sex and Age Group (Census 30.V.2017) (Excluding 8408 non-Bhutanese/tourists found in hotels on the census reference day.): [5]
Age GroupMaleFemaleTotal%
Total380 453346 692727 145100
0–429 17628 29857 4747.90
5–932 03530 95662 9918.66
10–1434 65634 29668 9529.48
15–1934 67933 60768 2869.39
20–2441 07534 34075 41510.37
25–2942 80236 47879 28010.90
30–3435 05930 12165 1808.96
35–3929 68925 86055 5497.64
40–4422 27419 22141 4955.71
45–4918 86516 66835 5334.89
50–5415 45613 86129 3174.03
55–5912 37911 51923 8983.29
60–6410 49810 21320 7112.85
65-697 5857 06914 6542.02
70-745 8765 59211 4681.58
75-793 9653 9067 8711.08
80-842 6512 7465 3970.74
85-891 2621 3382 6000.36
90-943384397770.11
95-991201432630.04
100+132134<0.01
Age groupMaleFemaleTotalPercent
0–1495 86793 550189 41726.05
15–64262 776231 888494 66468.03
65+21 81021 25443 0645.92
Population Estimates by Sex and Age Group (30.VII.2020) (Estimates or projections based on the 2017 Population Census.): [5]
Age GroupMaleFemaleTotal%
Total390 877358 054748 931100
0–429 20828 55757 7657.71
5–930 49529 23559 7307.98
10–1433 15932 38865 5478.75
15–1934 34334 20068 5439.15
20–2436 65533 42870 0839.36
25–2942 54735 45678 00310.42
30–3439 91334 31174 2249.91
35–3932 29428 04760 3418.06
40–4426 25922 90449 1636.56
45–4920 17117 59737 7685.04
50–5417 11515 28932 4044.33
55–5913 70912 41926 1283.49
60–6411 13210 66721 7992.91
65-698 8498 58317 4322.33
70-746 1715 79211 9631.60
75-794 3994 3468 7451.17
80-842 5872 7345 3210.71
85+1 8712 1013 9720.53
Age groupMaleFemaleTotalPercent
0–1492 86290 180183 04224.44
15–64274 138244 318518 45669.23
65+23 87723 55647 4336.33

Median age

Total: 27.2 years
Male: 27.7 years
Female: 26.6 years (2016 est. [6] )

Urbanization [7]

urban population: 38.6% of total population (2015)
rate of urbanization: 3.69% annual rate of change (2010-15 est.)

Vital statistics

Below is a table of Bhutan vital statistics since 1950 published by the United Nations Department of Economic and Social Affairs. [8]

PeriodLive births per yearDeaths per yearNatural change per yearCBR1CDR1NC1TFR1IMR1
1950-19559,0005,0004,00047.927.120.86.67184.8
1955-196010,0006,0005,00049.026.822.36.67181.4
1960-196512,0006,0006,00048.525.722.86.67174.1
1965-197013,0007,0007,00047.824.123.86.67163.1
1970-197516,0007,0008,00047.022.025.16.67149.3
1975-198018,0008,00010,00045.819.626.26.67133.2
1980-198520,0008,00012,00042.717.125.66.39117.1
1985-199021,0008,00013,00040.415.025.36.11104.0
1990-199519,0007,00012,00035.212.522.75.2787.5
1995-200016,0005,00011,00029.29.919.34.1369.7
2000-200515,0005,00011,00025.27.917.23.3052.8
2005-201015,0005,00010,00021.57.214.42.6144.4
1CBR = crude birth rate (per 1000); CDR = crude death rate (per 1000); NC = natural change (per 1000); TFR = total fertility rate (number of children per woman); IMR = infant mortality rate per 1000 births

Births and deaths

[9] [10] (Government estimates) [11]

YearPopulationLive birthsDeathsNatural increaseCrude birth rateCrude death rateRate of natural increaseTFR
2005635,00012,5384,4988,04019.77.112.62.4
2016726,5969,7183,5416,17713.44.98.5
2017727,1459,8413,3676,47413.54.68.91.7
2018734,37410,7113,3647,34714.64.610.0
2019741,6729,6673,2206,44713.04.38.7
2020748,9319,7693,1096,66013.04.28.8
2021756,12910,2483,1927,63813.64.29.4
2022763,2499,7113,6056,10613.34.78.6
Life expectancy in Bhutan Life expectancy in Bhutan.svg
Life expectancy in Bhutan

Life expectancy at birth

Total population: 70.2 years
Male: 68.8 years
Female: 71.7 years (2017 [3] est.)

Life expectancy at birth is 70.2 years, which is an increase from 66.3 years in 2005. Women (71.7 years) live longer than men (68.8).

In 2018, Prime Minister Tshering Tobgay announced that the average life expectancy at birth has surpassed 70. [12]

Ethnic groups

Religions

Buddhism 84.3%
Hinduism 11.3%
Other 4.4%

[1]

Languages

Tshangla (sometimes referred to as Sharchopkha) 28%
Dzongkha (official) 24%
Nepali (locally referred as Lhotshamkha) 22%
Other 26%

[1]

Related Research Articles

<span class="mw-page-title-main">Demographics of Antigua and Barbuda</span> National demographics

This article is a demography of the population of Antigua and Barbuda including population density, ethnicity, religious affiliations and other aspects of the population.

<span class="mw-page-title-main">Demographics of Botswana</span> Demographics of country

Demographic features of the population of Botswana include population density, ethnicity, education level, health of the populace, economic status, religious affiliations and other aspects.

<span class="mw-page-title-main">Demographics of Cameroon</span>

The demographic profile of Cameroon is complex for a country of its population. Cameroon comprises an estimated 250 distinct ethnic groups, which may be formed into five large regional-cultural divisions:
<span class="mw-page-title-main">Demographics of Cape Verde</span>

Demographic features of the population of Cape Verde include population density, ethnicity, education level, health of the populace, economic status, religious affiliations and other aspects of the population.

<span class="mw-page-title-main">Demographics of Ethiopia</span>

The demographics of Ethiopia encompass the demographic features of inhabitants in Ethiopia, including ethnicity, languages, population density, education level, health, economic status, religious affiliations and other aspects of the population.

<span class="mw-page-title-main">Demographics of Guatemala</span>

This is a demography of the population of Guatemala including population density, ethnicity, education level, health of the populace, economic status, religious affiliations and other aspects of the population.

<span class="mw-page-title-main">Demographics of India</span>

India is the most populous country in the world with one-sixth of the world's population. According to estimates from the United Nations (UN), India has overtaken China as the country with the largest population in the world, with a population of 1,425,775,850 at the end of April 2023.

<span class="mw-page-title-main">Demographics of Indonesia</span>

The population of Indonesia was 270.20 million according to the 2020 national census, an increase from 237.64 million in 2010. The official estimate as at mid 2022 was 275,773,800, increasing at a rate of 1.17% per year. Indonesia is the fourth most populous country in the world. Approximately 55% of Indonesia's population resides on Java, which is the most populous island in the world.

<span class="mw-page-title-main">Demographics of Iraq</span>

The Iraqi people are people originating from the country of Iraq.

<span class="mw-page-title-main">Demographics of Laos</span>

Laos is a country in Southeast Asia. The country's population was estimated at about 7.43 million in 2021, dispersed unevenly across the country. Most people live in valleys of the Mekong River and its tributaries. Vientiane Prefecture, which includes Vientiane, the capital and largest city of the country, had 820,924 residents as of the 2015 census. The country's population density is 26.7/km2.

<span class="mw-page-title-main">Demographics of Lesotho</span>

Demographic features of the population of Lesotho include population density, ethnicity, education level, health of the populace, economic status, religious affiliations and other aspects.

<span class="mw-page-title-main">Demographics of Mali</span>

Demographic features of the population of Mali include population density, ethnicity, education level, health of the populace, economic status, religious affiliations and other aspects of the population.
<span class="mw-page-title-main">Demographics of Myanmar</span> Demographic characteristics of Myanmar

This is a demography of Myanmar including statistics such as population, ethnicity, language, education level, and religious affiliations.

<span class="mw-page-title-main">Demographics of Nepal</span>

The current population of Nepal is 29,164,578 as per the 2021 census. The population growth rate is 0.92% per year.

<span class="mw-page-title-main">Demographics of Seychelles</span>

Demographic features of the population of Seychelles include population density, ethnicity, education level, health of the populace, economic status, religious affiliations and other aspects of the population.
<span class="mw-page-title-main">Demographics of Yemen</span>

Demographic features of the population of Yemen include population density, ethnicity, education level, health of the populace, economic status, religious affiliations and other aspects of the population.

<span class="mw-page-title-main">Demographics of Barbados</span>

This is a demography of Barbados including population density, ethnicity, education level, health of the populace, economic status, religious affiliations and other aspects of the population.

<span class="mw-page-title-main">Demographics of Benin</span>

The demographics of Benin include population density, ethnicity, education level, health of the populace, economic status, religious affiliations and other aspects of the population.

<span class="mw-page-title-main">Demographics of the Gambia</span> Demographics of the West African country

The demographic characteristics of the population of The Gambia are known through national censuses, conducted in ten-year intervals and analyzed by The Gambian Bureau of Statistics (GBOS) since 1963. The latest census was conducted in 2013. The population of The Gambia at the 2013 census was 1.8 million. The population density is 176.1 per square kilometer, and the overall life expectancy in The Gambia is 64.1 years. Since the first census of 1963, the population of The Gambia has increased every ten years by an average of 43.2 percent. Since 1950s, the birth rate has constantly exceeded the death rate; the natural growth rate is positive. The Gambia is in the second stage of demographic transition. In terms of age structure, The Gambia is dominated by 15- to 24-year-old segment (57.6%). The median age of the population is 19.9 years, and the gender ratio of the total population is 0.98 males per female.

<span class="mw-page-title-main">Demographics of Brunei</span>

The demographic features of Brunei include population density, ethnicity, education level, health of the populace, economic status, religious affiliations and other aspects of the population. Like neighbouring countries, Brunei is a Malay-majority country. Many cultural and linguistic differences make Brunei Malays distinct from the larger Malay populations in nearby Malaysia and Indonesia, even though they are ethnically related and share the Muslim religion.

References

  1. 1 2 3 4 5 "South Asia ::BHUTAN". CIA The World Factbook. 13 March 2024.
  2. "Reports". Department of Planning, Ministry of Finance . Archived from the original on 2005-09-06. Retrieved 2005-08-19.
  3. 1 2 "The World Factbook — Central Intelligence Agency". cia.gov. Retrieved 19 April 2018.
  4. "Demographic Yearbook – 2020". New York: United Nations Statistics Division . Retrieved 2022-05-18.
  5. 1 2 "Demographic Yearbook – 2020". New York: United Nations Statistics Division . Retrieved 2022-05-18.
  6. "The World Factbook — Central Intelligence Agency". cia.gov. Archived from the original on June 13, 2007. Retrieved 19 April 2018.
  7. "The World Factbook — Central Intelligence Agency". cia.gov. Archived from the original on February 11, 2009. Retrieved 19 April 2018.
  8. "Bhutan: Demographic Profile, Medium Variant 1950–2100". World Population Prospects: The 2010 Revision. United Nations Department of Economic and Social Affairs, Population Division, Population Projections and Estimates Section. Retrieved 2011-10-30. (entry: Bhutan)
  9. "Live births, deaths, and infant deaths, latest available year (2002 - 2016)" (PDF). United Nations Statistics Division . 2 January 2018.
  10. "Vital Statistics Report 2020". Bhutan National Statistics Bureau. Retrieved 30 May 2021.
  11. "Population". Bhutan National Statiscits Bureau. Retrieved 30 May 2021.
  12. KuenselOnline