The demographics of San Marino include population density, ethnicity, education level, economic status, religious affiliations and other aspects of the population.
The population of San Marino consists of native Sammarinese and Italian citizens. Crop farming, sheep farming, and the working of stone from the quarries formed the early backbone of San Marino's economy. It has no mineral resources and most of the land is cultivated or covered by woods.
Average population | Live births | Deaths | Natural change | Crude birth rate (per 1000) | Crude death rate (per 1000) | Natural change (per 1000) | Total fertility rate [3] [4] | |
---|---|---|---|---|---|---|---|---|
1864 | 7,080 | |||||||
1874 | 7,464 | |||||||
1899 | 9,359 | |||||||
1947 | 12,100 | 280 | 143 | 137 | 23.1 | 11.8 | 11.3 | |
1948 | 12,300 | 257 | 107 | 150 | 21.4 | 8.9 | 12.5 | |
1949 | 12,400 | 271 | 102 | 169 | 21.9 | 8.2 | 13.7 | |
1950 | 12,800 | 233 | 118 | 115 | 18.2 | 9.2 | 9.0 | |
1951 | 13,000 | 233 | 91 | 142 | 17.9 | 7.0 | 10.9 | |
1952 | ||||||||
1953 | ||||||||
1954 | ||||||||
1955 | ||||||||
1956 | ||||||||
1957 | ||||||||
1958 | ||||||||
1959 | ||||||||
1960 | 15,400 | 260 | 133 | 127 | 16.9 | 8.6 | 8.3 | |
1961 | 15,600 | 301 | 123 | 178 | 19.3 | 7.9 | 11.4 | |
1962 | 16,700 | 293 | 126 | 167 | 17.5 | 7.5 | 10.0 | |
1963 | 17,000 | 286 | 116 | 170 | 16.8 | 6.8 | 10.0 | |
1964 | 17,300 | 298 | 149 | 149 | 17.2 | 8.6 | 8.6 | |
1965 | 17,400 | 286 | 148 | 138 | 16.4 | 8.5 | 7.9 | |
1966 | 17,700 | 314 | 134 | 180 | 17.7 | 7.6 | 10.1 | |
1967 | 17,900 | 303 | 129 | 174 | 16.9 | 7.2 | 9.7 | |
1968 | 18,300 | 310 | 156 | 154 | 16.9 | 8.5 | 8.4 | |
1969 | 18,800 | 308 | 141 | 167 | 16.4 | 7.5 | 8.9 | |
1970 | 17,800 | 288 | 133 | 155 | 16.2 | 7.5 | 8.7 | |
1971 | 18,400 | 327 | 145 | 182 | 17.8 | 7.9 | 9.9 | |
1972 | 18,700 | 309 | 138 | 171 | 16.5 | 7.4 | 9.1 | |
1973 | 19,000 | 328 | 146 | 182 | 17.3 | 7.7 | 9.6 | |
1974 | 19,300 | 294 | 148 | 146 | 15.2 | 7.7 | 7.5 | |
1975 | 19,800 | 280 | 159 | 121 | 14.1 | 8.0 | 6.1 | |
1976 | 20,100 | 297 | 136 | 161 | 14.8 | 6.8 | 8.0 | |
1977 | 20,500 | 291 | 136 | 155 | 14.2 | 6.6 | 7.6 | |
1978 | 20,800 | 283 | 156 | 127 | 13.6 | 7.5 | 6.1 | |
1979 | 21,000 | |||||||
1980 | 21,300 | 239 | 166 | 73 | 11.2 | 7.8 | 3.4 | |
1981 | 21,800 | 217 | 163 | 54 | 10.0 | 7.5 | 2.5 | |
1982 | 21,900 | 237 | 157 | 80 | 10.8 | 7.2 | 3.6 | |
1983 | 22,000 | 245 | 163 | 82 | 11.1 | 7.4 | 3.7 | |
1984 | 22,200 | 223 | 156 | 67 | 10.0 | 7.0 | 3.0 | |
1985 | 22,300 | 207 | 188 | 19 | 9.3 | 8.4 | 0.9 | |
1986 | 22,500 | 179 | 171 | 8 | 8.0 | 7.6 | 0.4 | |
1987 | 22,600 | 220 | 154 | 66 | 9.7 | 6.8 | 2.9 | |
1988 | 22,700 | 242 | 187 | 55 | 10.7 | 8.2 | 2.5 | |
1989 | 22,900 | 231 | 173 | 58 | 10.1 | 7.6 | 2.5 | |
1990 | 23,100 | 266 | 155 | 111 | 11.5 | 6.7 | 4.8 | |
1991 | 23,400 | 257 | 171 | 86 | 11.0 | 7.3 | 3.7 | |
1992 | 23,800 | 237 | 172 | 65 | 10.0 | 7.2 | 2.8 | |
1993 | 24,100 | 244 | 145 | 99 | 10.1 | 6.0 | 4.1 | |
1994 | 24,500 | 268 | 184 | 84 | 10.9 | 7.5 | 3.4 | |
1995 | 24,900 | 244 | 186 | 58 | 9.8 | 7.5 | 2.3 | |
1996 | 25,300 | 282 | 173 | 109 | 11.1 | 6.8 | 4.3 | |
1997 | 25,700 | 287 | 178 | 109 | 11.2 | 6.9 | 4.3 | |
1998 | 26,100 | 285 | 190 | 95 | 10.9 | 7.3 | 3.6 | |
1999 | 26,400 | 303 | 198 | 105 | 11.5 | 7.5 | 4.0 | |
2000 | 26,800 | 290 | 188 | 102 | 10.8 | 7.0 | 3.8 | |
2001 | 26,941 | 315 | 195 | 120 | 11.4 | 7.1 | 4.3 | |
2002 | 28,166 | 295 | 203 | 92 | 10.4 | 7.1 | 3.2 | |
2003 | 28,753 | 300 | 216 | 84 | 10.3 | 7.5 | 2.9 | 1.250 |
2004 | 29,241 | 306 | 185 | 121 | 10.4 | 6.3 | 4.1 | 1.255 |
2005 | 29,673 | 284 | 219 | 65 | 9.5 | 7.3 | 2.2 | 1.184 |
2006 | 29,999 | 302 | 225 | 77 | 10.0 | 7.5 | 2.6 | 1.244 |
2007 | 30,368 | 292 | 225 | 67 | 9.6 | 7.4 | 2.2 | 1.235 |
2008 | 30,792 | 349 | 190 | 159 | 11.3 | 6.1 | 5.1 | 1.551 |
2009 | 31,269 | 306 | 233 | 73 | 9.7 | 7.4 | 2.3 | 1.334 |
2010 | 31,632 | 334 | 222 | 112 | 10.5 | 7.0 | 3.5 | 1.467 |
2011 | 31,888 | 325 | 222 | 103 | 10.1 | 6.9 | 3.2 | 1.470 |
2012 | 32,193 | 292 | 237 | 55 | 9.0 | 7.3 | 1.7 | 1.359 |
2013 | 32,471 | 320 | 247 | 73 | 9.9 | 7.6 | 2.3 | 1.520 |
2014 | 32,572 | 296 | 252 | 44 | 9.1 | 7.7 | 1.3 | 1.530 |
2015 | 32,789 | 269 | 235 | 34 | 8.2 | 7.2 | 1.0 | 1.362 |
2016 | 33,005 | 262 | 253 | 9 | 7.9 | 7.6 | 0.3 | 1.403 |
2017 | 33,196 | 228 | 278 | -50 | 6.9 | 8.4 | -1.5 | 1.199 |
2018 | 33,328 | 235 | 244 | -9 | 7.0 | 7.3 | -0.3 | 1.291 |
2019 | 33,419 | 232 | 251 | -19 | 6.9 | 7.5 | -0.6 | 1.294 |
2020 | 33,574 | 224 | 343 | -119 | 6.7 | 10.2 | -3.5 | 1.266 |
2021 | 33,627 | 212 | 312 | -100 | 6.3 | 9.3 | -3.0 | 1.206 |
2022 | 33,698 | 205 | 263 | -58 | 6.1 | 7.8 | -1.7 | 1.179 |
2023 | 33,812 | 191 | 279 | -88 | 5.6 | 8.3 | -2.7 |
Period | Live births | Deaths | Natural increase |
---|---|---|---|
January - March 2022 | 44 | 74 | -30 |
January - March 2023 | 46 | 86 | -40 |
Difference | +2 (+4.54%) | +12 (+16.22%) | -10 |
Age Group | Male | Female | Total | % |
---|---|---|---|---|
Total | 16 982 | 17 823 | 34 805 | 100 |
0–4 | 623 | 610 | 1 233 | 3.54 |
5–9 | 812 | 776 | 1 588 | 4.56 |
10–14 | 918 | 866 | 1 784 | 5.13 |
15–19 | 942 | 800 | 1 742 | 5.01 |
20–24 | 910 | 815 | 1 725 | 4.96 |
25–29 | 828 | 819 | 1 647 | 4.73 |
30–34 | 861 | 900 | 1 761 | 5.06 |
35–39 | 1 017 | 1 038 | 2 055 | 5.90 |
40–44 | 1 210 | 1 387 | 2 597 | 7.46 |
45–49 | 1 487 | 1 600 | 3 087 | 8.87 |
50–54 | 1 543 | 1 673 | 3 216 | 9.24 |
55–59 | 1 473 | 1 539 | 3 012 | 8.65 |
60–64 | 1 157 | 1 208 | 2 365 | 6.80 |
65-69 | 904 | 972 | 1 876 | 5.39 |
70-74 | 841 | 891 | 1 732 | 4.98 |
75-79 | 610 | 703 | 1 313 | 3.77 |
80-84 | 462 | 559 | 1 021 | 2.93 |
85-89 | 259 | 411 | 670 | 1.93 |
90-94 | 100 | 195 | 295 | 0.85 |
95-99 | 25 | 53 | 78 | 0.22 |
100+ | 0 | 8 | 8 | 0.02 |
Age group | Male | Female | Total | Percent |
0–14 | 2 353 | 2 252 | 4 605 | 13.23 |
15–64 | 11 428 | 11 779 | 23 207 | 66.68 |
65+ | 3 201 | 3 792 | 6 993 | 20.09 |
0-14 years: 16% (male 2,181; female 2,038)
15-64 years: 68% (male 8,992; female 9,425)
65 years and over: 16% (male 1,849; female 2,452) (2000 est.)
at birth: 1 male(s)/female
under 15 years: 1.07 male(s)/female
15-64 years: 0.95 male(s)/female
65 years and over: 0.75 male(s)/female
total population: 0.94 male(s)/female (2000 est.)
noun: English: Sammarinese (singular and plural); Italian: Sammarinese (singular), Sammarinesi (plural)
adjective: Sammarinese
Sammarinese, Italian
According to a 2021 report, the population is 91.5% Christian, 5.6% agnostic, 1.9% atheist, and 1% 'other'. [7]
Italian (official), Sammarinese variety of Romagnol (not official)
definition: age 10 and over who can read and write
total population: 96%
male: 97%
female: 95% (1976 est.)
Demographic features of the population of Botswana include population density, ethnicity, education level, health of the populace, economic status, religious affiliations and other aspects.
Burkina Faso's 22.1 million people belong to two major West African cultural groups: the Gur (Voltaic) and the Mandé. The Voltaic are far more numerous and include the Mossi, who make up about one-half of the population. The Mossi claim descent from warriors who migrated to present-day Burkina Faso and established an empire that lasted more than 800 years. Predominantly farmers, the Mossi are still bound by the traditions of the Mogho Naba, who hold court in Ouagadougou.
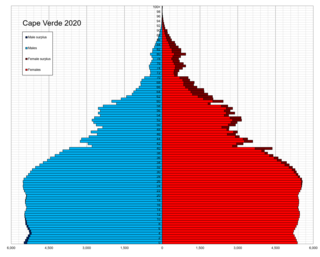
Demographic features of the population of Cape Verde include population density, ethnicity, education level, health of the populace, economic status, religious affiliations and other aspects of the population.
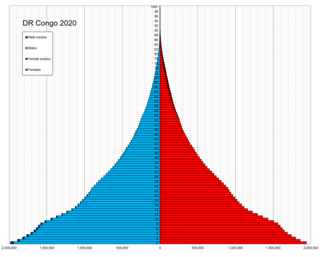
Demographic features of the population of the Democratic Republic of the Congo include ethnicity, education level, health, economic status, religious affiliations and other aspects of the population.
Demographic features of the population of the Faroe Islands include population density, ethnicity, education level, health of the populace, economic status, religious affiliations and other aspects of the population. The vast majority of the population are ethnic Faroese, of North Germanic descent. Ethnic Faroese are, in genetic terms, among the most homogenous groups ever found.
Demographic features of the population of Kiribati include population density, ethnicity, education level, health of the populace, economic status, religious affiliations and other aspects of the population.
Demographic features of the population of Lesotho include population density, ethnicity, education level, health of the populace, economic status, religious affiliations and other aspects.
Demographic features of the population of Liechtenstein include population density, ethnicity, education level, health of the populace, economic status, religious affiliations and other aspects of the population.
The demographics of the Marshall Islands include data such as population density, ethnicity, health of the populace, economic status, religious affiliations and other aspects of the population.
Demographic features of the population of Mayotte include population density, ethnicity, education level, health of the populace, economic status, religious affiliations and other aspects of the population. Mayotte's population density went from 179 persons per square kilometer in 1985 to 251 per square kilometer in 1991. Its capital, Dzaoudzi had a population of 5,865 according to the 1985 census; the island's largest town, Mamoudzou, had 12,026 people.
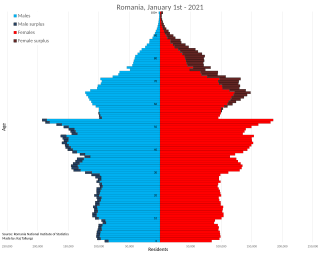
Demographic features of the population of Romania include population density, ethnicity, education level, health of the populace, economic status, religious affiliations, and other aspects of the population.
San Marino, officially the Republic of San Marino and also known as the Most Serene Republic of San Marino, is a European microstate surrounded by Italy. Located on the northeastern side of the Apennine Mountains, San Marino is the fifth-smallest country in the world and covers a land area of just over 61 km2, with a population of 33,660 as of 2022.
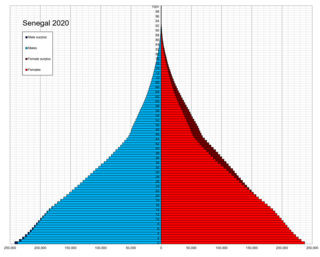
Demographic features of the population of Senegal include population density, ethnicity, education level, health of the populace, economic status, religious affiliations and other aspects of the population.
Demographic features of the population of Seychelles include population density, ethnicity, education level, health of the populace, economic status, religious affiliations and other aspects of the population.
Demographic features of the population of Vanuatu include population density, ethnicity, education level, health of the populace, economic status, religious affiliations and other aspects. 4% of the people living in Vanuatu are Europeans.
Demographic features of the population of Madagascar include population density, ethnicity, education level, health of the populace, economic status, religious affiliations and other aspects of the population.
The demographics of Benin include population density, ethnicity, education level, health of the populace, economic status, religious affiliations and other aspects of the population.
The Republic of San Marino comprises nine castelli as its first-level administrative divisions. Each castle is led by a Castle Captain and a Castle Council, elected every five years.
Sammarinese are citizens and people of the Republic of San Marino.
The following outline is provided as an overview of and topical guide to San Marino: