Slovenia is among the European countries with the most pronounced ageing of population, ascribable to a low birth rate and increasing life expectancy.[10] Almost all Slovenian inhabitants older than 64 are retired, with no significant difference between the genders.[11] The working-age group is diminishing in spite of immigration.[12] The proposal to raise the retirement age from the current 57 for women and 58 for men was rejected in a referendum in 2011.[13] Also the difference among the genders regarding life expectancy is still significant.[11] In 2007, it was 74.6 years for men and 81.8 years for women.[14] In addition, in 2009, the suicide rate in Slovenia was 22 per 100,000 persons per year, which places Slovenia among the highest ranked European countries in this regard.[15]
Slovenia International Migration Statistics (1961-present)[34]
Year
Immigrants from Abroad
Emigrants to Abroad
Net Migration from Abroad
1961
6,537
5,707
830
1962
7,373
5,357
2,016
1963
8,850
6,056
2,794
1964
9,364
5,999
3,365
1965
10,513
6,250
4,263
1966
9,457
5,046
4,411
1967
9,272
5,686
3,586
1968
7,051
6,112
939
1969
7,834
6,705
1,129
1970
7,168
5,665
1,503
1971
7,442
4,913
2,529
1972
7,832
4,475
3,357
1973
8,271
4,956
3,315
1974
9,646
5,281
4,365
1975
11,325
4,479
6,846
1976
12,682
4,570
8,112
1977
13,132
5,113
8,019
1978
12,770
5,432
7,338
1979
13,877
5,780
8,097
1980
11,983
6,710
5,273
1981
11,482
7,220
4,262
1982
10,644
6,207
4,437
1983
9,781
5,977
3,804
1984
9,224
5,910
3,314
1985
8,912
5,386
3,526
1986
9,194
5,294
3,900
1987
8,580
4,124
4,456
1988
7,782
4,089
3,693
1989
7,151
4,730
2,421
1990
7,075
4,908
2,167
1991
5,989
9,060
-3,071
1992
3,461
3,848
-387
1993
2,745
1,390
1,355
1994
1,919
983
936
1995
5,879
3,372
2,507
1996
9,495
2,985
6,510
1997
7,889
5,447
2,442
1998
4,603
6,708
-2,105
1999
4,941
2,606
2,335
2000
6,185
3,570
2,615
2001
7,803
4,811
2,992
2002
9,134
7,269
1,865
2003
9,279
5,867
3,412
2004
10,171
8,269
1,902
2005
15,041
8,605
6,436
2006
20,016
13,749
6,267
2007
29,193
14,943
14,250
2008
30,693
12,109
18,584
2009
30,296
18,788
11,508
2010
15,416
15,937
-521
2011
14,083
12,024
2,059
2012
15,022
14,378
644
2013
13,871
13,384
487
2014
13,846
14,336
-490
2015
15,420
14,913
507
2016
16,623
15,572
1,051
2017
18,808
17,555
1,253
2018
28,455
13,527
14,928
2019
31,319
15,106
16,213
2020
36,110
17,745
18,365
2021
23,624
21,144
2,480
2022
35,613
20,956
14,657
2023
33,939
22,411
11,528
2024
33,023
21,491
11,532
Ethnic groups
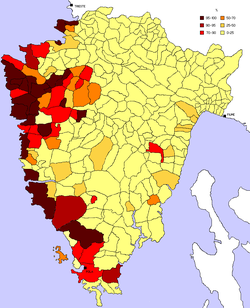
Percentage of people who used Italian as a "language of daily use" in Istria (Istrian Italians) in 1910
The majority of Slovenia's population are ethnic Slovenes (83.06%). Hungarians and Istrian Italians have the status of indigenous minorities under the Constitution of Slovenia, which guarantees them seats in the National Assembly. Most other minority groups, particularly those from other parts of the former Yugoslavia (except for one part of autochthonous community of Serbs and Croats), relocated after World War II for economic reasons. Istrian Italians were more than 50% of the total population of Istria for centuries,[36] while making up about a third of the population in 1900.[37] The Istrian–Dalmatian exodus (Italian: esodo giuliano dalmata; Slovene: istrsko-dalmatinski eksodus; Croatian: istarsko-dalmatinski egzodus) was the post-World War II exodus and departure of local ethnic Italians (Istrian Italians and Dalmatian Italians) as well as ethnic Croats from Yugoslavia. The emigrants, who had lived in the now Yugoslav territories of the Julian March (Karst Region and Istria), Kvarner and Dalmatia, largely went to Italy, but some joined the Italian diaspora in the Americas, Australia and South Africa.[38][39] According to various sources, the exodus is estimated to have amounted to between 230,000 and 350,000 Italians (the others being ethnic Slovenes and Croats who chose to maintain Italian citizenship)[40] leaving the areas in the aftermath of the conflict.[41][42] According to the census organized in Croatia in 2001 and that organized in Slovenia in 2002, the Italians who remained in the former Yugoslavia amounted to 21,894 people (2,258 in Slovenia and 19,636 in Croatia).[43][44] The number of speakers of Italian is larger if taking into account non-Italians who speak it as a second language.
Around 12.4% of the inhabitants of Slovenia were born abroad.[45] According to data from 2008, there were around 100,000 non-EU citizens living in Slovenia, or around 5% of the overall population of the country.[46] The highest number came from Bosnia and Herzegovina, followed by immigrants from Serbia, North Macedonia, Croatia (which has since joined the EU itself) and Kosovo. In April 2019, there were 143,192 foreign citizens living in Slovenia, representing 6.87% of Slovenia's population.[47] The number of people migrating to Slovenia has been steadily rising from 1995;[48] and the rate of immigration itself has been increasing year-on-year, reaching its peak in 2016. Since Slovenia joined the EU in 2004, the yearly inflow of immigrants has doubled by 2006 and tripled by 2009.[49] In 2007, Slovenia was one of the countries with the fastest growth of net migration rate in the European Union.[48]
Population of Slovenia by ethnic group, 1948–20021
Traditionally, Slovenes are predominantly Roman Catholic. Before World War II, 97% of Slovenes declared as Roman Catholics, around 2.5% were Lutheran, and only around 0.5% belonged to other denominations. Catholicism was an important feature of both social and political life in pre-communist Slovenia. After 1945, the country underwent a process of gradual but steady secularization. After a decade of severe persecution of religions, the communist regime adopted a policy of relative tolerance towards the churches, but limited their social functioning. After 1990, the Roman Catholic Church regained some of its former influence, but Slovenia remains a largely secularized society. According to the 2002 census, 57.8% of the population is Roman Catholic. As elsewhere in Europe, affiliation with Roman Catholicism is dropping: in 1991, 71.6% were self-declared Catholics, which means a drop of more than 1% annually.[50] The vast majority of Slovenian Catholics belong to the Latin Church. A small number of Eastern Catholics live in the White Carniola region.[51]
Despite a relatively small number of Protestants (less than 1% in 2002), the Protestant legacy is important because of its historical significance, since the bases of Slovene standard language and Slovene literature were established by the Protestant Reformation in the 16th century. Nowadays, a significant Lutheran minority lives in the easternmost region of Prekmurje, where they represent around a fifth of the population and are headed by a bishop with the seat in Murska Sobota.[52]
Besides these two Christian denominations, a small Jewish community has also been historically present. After the losses during the Holocaust in Slovenia, Judaism has a few hundred adherents, mostly living in Ljubljana, site of the sole remaining active synagogue in the country.[citation needed]
In the 2002, around 10% of Slovenes declared themselves as atheists, another 10% professed no specific denomination, and around 16% decided not to answer the question about their religious affiliation. According to the Eurobarometer Poll 2005,[54] 37% of Slovenian citizens responded that "they believe there is a god", whereas 46% answered that "they believe there is some sort of spirit or life force" and 16% that "they do not believe there is any sort of spirit, god, or life force".
According to the published data from the 2002 Slovenian census, out of a total of 47,488 Muslims (2.4% of the total population) 2,804 Muslims (5.90% of the total Muslims in Slovenia) declared themselves as ethnic Slovenian Muslims.[55]
The official language in Slovenia is Slovene, which is a member of the South Slavic language group. In 2002, Slovene was the native language of around 88% of Slovenia's population according to the census, with more than 92% of the Slovenian population speaking it in their home environment.[56][57] This places Slovenia among the most homogeneous countries in the EU in terms of the share of speakers of predominant mother tongue.[58] Slovene is sometimes characterized as the most diverse Slavic language in terms of dialects,[59] with different degrees of mutual intelligibility.[citation needed] Accounts of the number of dialects range from as few as seven[60][61][62] dialects, often considered dialect groups or dialect bases that are further subdivided into as many as 50 dialects.[63] Other sources characterize the number of dialects as nine[64] or eight.[65]
urban population: 50% of total population (2012 est.)
rate of urbanization: 0.2% annual rate of change (2010-2015 est.)
Sex ratio
at birth: 1.07 male(s)/female under 15 years: 1.06 male(s)/female 15–64 years: 1.01 male(s)/female 65 years and over: 0.66 male(s)/female total population: 0.95 male(s)/female (2011 est.)
Infant mortality rate
4.12 deaths/1,000 live births (2010)
Life expectancy at birth
total population: 80 years male: 77 years female: 83 years (2013 est)
↑Medvešek, Mojca (2007). "Kdo so priseljenci z območja nekdanje Jugoslavije"[Who Are the Immigrants from the Area of Former Yugoslavia](PDF). Razprave in Gradivo (in Slovenian). No.53–54. Institute for Ethnic Studies. p.34.
↑Šabec, Ksenija (2009). Poročilo: Italijanska narodna skupnost v Slovenski Istri[Report: The Italian National Community in the Slovenian Istria](PDF) (in Slovenian). Center for Cultural and Religious Studies, University of Ljubljana. p.7. Archived from the original(PDF) on 11 May 2011. Retrieved 1 February 2011.
↑Gajšek, Nina (2004). Pravice romske skupnosti v Republiki Sloveniji[Rights of the Roma Community in the Republic of Slovenia](PDF) (in Slovenian). Faculty of Social Science, University of Ljubljana.
↑McDonald, Gordon C. 1979. Yugoslavia: A Country Study. Washington, DC: American University, p. 93
↑Greenberg, Marc L. 2009. "Slovene." In Keith Brown & Sarah Ogilvie (eds.), Concise Encyclopedia of Languages of the World, pp. 981–984. Oxford: Elsevier, p. 981.
↑Brown, E. K. & Anne Anderson. 2006. Encyclopedia of Language & Linguistics: Sca-Spe. Oxford: Elsevier, p. 424
↑Sussex, Roland, & Paul V. Cubberley. 2006. The Slavic languages. Cambridge: Cambridge University Press, p. 502.
↑Sławski, Franciszek. 1962. Zarys dialektologii południowosłowiańskiej. Warsaw: PAN.
↑Priestly, Tom M. S. 1993. "On 'Drift' in Indo-European Gender Systems.' Journal of Indo-European Studies 11: 339–363.
This page is based on this Wikipedia article Text is available under the CC BY-SA 4.0 license; additional terms may apply. Images, videos and audio are available under their respective licenses.