Demographics of Serbia and Montenegro

Last updated
Ethnic map of Serbia in 2002 Serbia ethnic02.png
Ethnic map of Serbia in 2002
Ethnic map of Montenegro Montenegro ethnic map 2003.png
Ethnic map of Montenegro

Serbia and Montenegro was a country that existed from 1992 to 2006. It consisted of two constituent states, the Republic of Serbia and the Republic of Montenegro.

Contents

The total population of Serbia and Montenegro at the time of its dissolution in 2006 was approximately 9,746,130 with Serbia having 9,131,105 and Montenegro having 615,025 then. In 2000, in Serbia, 19.95% of the population was 14 and under (male 1,028,355; female 963,366); in Montenegro, it was 22.05% (male 77,582; female 72,395). 65.22% of Serbians (male 3,187,746; female 3,322,425) and 66.16% of Montenegrins (male 222,095; female 227,923) were between 15 and 64. 14.83% of Serbians (male 638,204; female 841,833) and 11.79% of Montenegrins (male 32,400; female 47,763) were 65 and over.

Estimates in 2000 placed Serbia's population growth rate at 0.739% and Montenegro's at -12.22%. The respective birth rates were 12.20/1000 (Serbia) and 14.9/1000 (Montenegro); death rates were 11.08/1000 (Serbia) and 7.9/1000 (Montenegro). The net migration rate was 6.29/1000 in Serbia and -29.18/1,000 in Montenegro. Total fertility rates were 1.7 children/woman in Serbia and 2.0 children/woman in Montenegro.

Demographics of Serbia and Montenegro, Data of FAO, year 2005; Number of inhabitants in thousands. Serbia and Montenegro demo.png
Demographics of Serbia and Montenegro, Data of FAO, year 2005; Number of inhabitants in thousands.

In 2000, Serbia's infant mortality rate was 20.13 deaths/1,000 live births; Montenegro's was 10.97 deaths/1,000 live births. Total life expectancy at birth was 72.39 years in Serbia (69.31 for males, 75.72 for females) and 75.46 in Montenegro (71.45 for males, 79.82 for females).

Ethnic groups in the region were represented as follows: Serb 62.6%, Albanian 16.5%, Montenegrin 5%, Yugoslav 3.4%, Hungarian 3.3%, other 9.2% (as of 2001). In terms of religion, 65% of inhabitants were Eastern Orthodox, 19% Muslim, 4% Roman Catholic, 1% Protestant 1%, and 11% other. The main languages spoken in Serbia and Montenegro are Serbian, Albanian, Croatian, Bosnian and Hungarian.

In 2002, 96.4% of the population aged 15 and over could read and write (98.9% of males, 94.1% of females).

Historical population
YearPop.±%
1880 2,089,183    
1890 2,642,142+26.5%
1900 3,204,240+21.3%
1910 3,826,034+19.4%
1921 5,337,714+39.5%
1931 6,048,272+13.3%
1948 6,727,766+11.2%
1953 7,244,433+7.7%
1961 8,114,121+12.0%
1971 9,276,125+14.3%
1981 10,014,936+8.0%
1991 10,532,601+5.2%
2002 10,402,186−1.2%
2011 10,625,593+2.1%
2015 10,729,223+1.0%

Vital statistics

Vital statistics 1992 - 2006

Average populationLive birthsDeathsNatural changeCrude birth rate (per 1000)Crude death rate (per 1000)Natural change (per 1000)Total fertility rateFemale fertile population (15–49 years)
199210,389,875140,819105,87234,94713.610.23.41.982,450,655
199310,390,945140,985107,39633,58913.610.33.21.972,476,910
199410,392,747137,629105,33832,29113.210.13.11.922,504,244
199510,393,841140,504107,53532,96913.510.33.21.952,533,427
199610,398,138137,683111,74425,93913.210.72.51.902,556,347
199710,399,279131,394111,84519,54912.610.81.91.812,566,228
199810,304,594127,293112,81114,48212.410.91.41.762,550,985
199910,214,585121,070114,4066,66411.911.20.71.682,534,790
200010,128,515121,635116,5695,06612.011.50.51.702,516,066
200110,057,754124,686111,11113,57512.411.01.31.752,500,209
20029,996,503122,736113,9528,78412.311.40.91.732,483,841
20039,919,214119,363116,0673,29612.011.70.31.692,457,449
20049,842,578121,098116,4264,67212.311.80.51.722,431,740
20059,798,810116,750119,817-3,06711.912.2-0.31.662,405,756
20069,746,130112,715116,331-3,61611.611.9-0.41.622,381,783

Marriages and divorces 1992 - 2006

Average populationMarriagesDivorcesCrude marriage rate (per 1000)Crude divorce rate (per 1000)Divorces per 1000 marriages
199210,389,87563,5637,1366.10.7112.3
199310,390,94562,0457,3946.00.7119.2
199410,392,74759,8037,0055.80.7117.1
199510,393,84160,3257,9625.80.8132.0
199610,398,13856,7197,8965.50.8139.2
199710,399,27956,2037,9475.40.8141.4
199810,304,59456,1058,0025.40.8142.6
199910,214,58555,6007,3785.40.7132.7
200010,128,51562,1668,9046.10.9143.2
200110,057,75462,2969,2366.20.9148.3
20029,996,50364,02111,5256.41.2180.0
20039,919,21462,9989,5976.41.0152.3
20049,842,57862,45910,6436.31.1170.4
20059,798,81057,8699,6055.91.0166.0
20069,746,13059,04310,1546.11.0172.0

See also

Related Research Articles

<span class="mw-page-title-main">Demographics of Bosnia and Herzegovina</span>

Demographic features of the population of Bosnia and Herzegovina include population density, ethnicity, education level, health of the populace, economic status, religious affiliations and other aspects of the population.

<span class="mw-page-title-main">Demographics of Botswana</span> Demographics of country

Demographic features of the population of Botswana include population density, ethnicity, education level, health of the populace, economic status, religious affiliations and other aspects.

<span class="mw-page-title-main">Demographics of Croatia</span> Characteristics of Croatian population

The demographic characteristics of the population of Croatia are known through censuses, normally conducted in ten-year intervals and analysed by various statistical bureaus since the 1850s. The Croatian Bureau of Statistics has performed this task since the 1990s. The latest census in Croatia was performed in autumn of 2021. According to final results published on 22 September 2022 the permanent population of Croatia at the 2021 census had reached 3.87 million. The population density is 68.7 inhabitants per square kilometre, and the overall life expectancy in Croatia at birth was 78,2 years in 2018. The population rose steadily from 2.1 million in 1857 until 1991, when it peaked at 4.7 million. Since 1991, Croatia's death rate has continuously exceeded its birth rate; the natural growth rate of the population is negative. Croatia is in the fourth stage of the demographic transition. In terms of age structure, the population is dominated by the 15 to 64 year‑old segment. The median age of the population is 43.4, and the gender ratio of the total population is 0.93 males per 1 female.

<span class="mw-page-title-main">Demographics of Indonesia</span>

The population of Indonesia was 270.20 million according to the 2020 national census, an increase from 237.64 million in 2010. The official estimate as at mid 2022 was 275,773,800, increasing at a rate of 1.17% per year. Indonesia is the fourth most populous country in the world. Approximately 55% of Indonesia's population resides on Java, which is the most populous island in the world.

Demographic features of the population of Liechtenstein include population density, ethnicity, education level, health of the populace, economic status, religious affiliations and other aspects of the population.

<span class="mw-page-title-main">Demographics of Luxembourg</span>

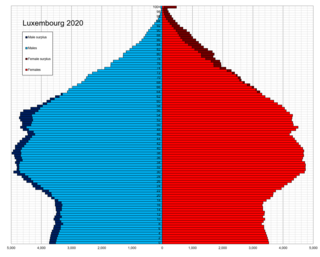
Demographic features of the population of Luxembourg include population density, education level, health of the populace, economic status, religious affiliations and other aspects of the population.

<span class="mw-page-title-main">Demographics of North Macedonia</span> Overview of the demographics of North Macedonia

Demographic features of the population of North Macedonia include population density, ethnicity, education level, health of the populace, economic status, religious affiliations and other aspects of the population.

<span class="mw-page-title-main">Demographics of Mauritania</span>

Demographic features of the population of Mauritania include population density, ethnicity, education level, health of the populace, economic status, religious affiliations and other aspects.

<span class="mw-page-title-main">Demographics of the Republic of the Congo</span> National demographics

Demographic features of the population of the Republic of the Congo include population density, ethnicity, education level, health of the populace, economic status, religious affiliations and other aspects of the population.

<span class="mw-page-title-main">Demographics of São Tomé and Príncipe</span>

Demographic features of the population of São Tomé and Príncipe include population density, ethnicity, education level, health of the populace, economic status, religious affiliations and other aspects.

<span class="mw-page-title-main">Demographics of Slovenia</span>

Demographic features of the population of Slovenia include population density, ethnicity, education level, health of the populace, economic status, religious affiliations and other aspects of the population.

<span class="mw-page-title-main">Demographics of Norway</span>

Demographic features of the population of Norway include population density, ethnicity, education level, health of the populace, economic status, religious affiliations and other aspects.

<span class="mw-page-title-main">Demographics of Bulgaria</span> Demographics of Bulgaria

The demography of the Republic of Bulgaria is monitored by the National Statistical Institute of Bulgaria. Demographic features of the population of Bulgaria include population density, ethnicity, education level, health of the populace, economic status, religious affiliations and others.

<span class="mw-page-title-main">Montenegrins</span> South Slavic ethnic group

Montenegrins are a South Slavic ethnic group that share a common ancestry, culture, history, and language, identified with the country of Montenegro.

The demographic history of Montenegro can be shown through census results and official documents which mention demographic composition.

<span class="mw-page-title-main">Demographics of Serbia</span>

Demographic features of the population of Serbia include vital statistics, ethnicity, religious affiliations, education level, health of the populace, and other aspects of the population.

This article presents the demographic history of Serbia through census results. See Demographics of Serbia for a more detailed overview of the current demographics from 2011 census.

<span class="mw-page-title-main">Demographics of Montenegro</span>

Demographic features of the population of Montenegro include population density, ethnicity, education level, health of the populace, economic status, religious affiliations and other aspects.

<span class="mw-page-title-main">Demographics of Kosovo</span>

The Kosovo Agency of Statistics monitors various demographic features of the population of Kosovo, such as population density, ethnicity, education level, health of the populace, economic status, religious affiliations and other aspects of the population. Censuses, normally conducted at ten-year intervals, record the demographic characteristics of the population. According to the first census conducted after the 2008 declaration of independence in 2011, the permanent population of Kosovo had reached 1,810,366.

Montenegro is a country with an area of 13,812 square kilometres and a population of 620,029, according to the 2011 census. The country is bordered by Croatia, the Adriatic Sea, Bosnia, Herzegovina, Serbia, Kosovo and Albania. The most common health issues faced are non-communicable diseases accounting for 95% of all deaths. This is followed by 4% of mortality due to injury, and 1% due to communicable, maternal, perinatal and nutritional conditions. Other health areas of interest are alcohol consumption, which is the most prevalent disease of addiction within Montenegro and smoking. Montenegro has one of the highest tobacco usage rates across Europe. Life expectancy for men is 74 years, and life expectancy for women is 79.

References

PD-icon.svg This article incorporates public domain material from The World Factbook. CIA.