Economic statistics of Singapore

Last updated

This article contains economic statistics of the country Singapore. The GDP, GDP Per Capita, GNI Per Capita, Total Trade, Total Imports, Total Exports, Foreign Reserves, Current Account Balance, Average Exchange Rate, Operating Revenue and Total Expenditure are mentioned in the table below for years 1965 through 2018.

Contents

1965 to 2014

Economy Statistics Since Year 1965 To Year 2014
Source: [1] [2] [3] [4] [5] [6] [7] [8] [9] [10]
YearGDP
(Billion)
GDP Per CapitaGNI
(Billion)
GNI Per CapitaTotal Trade (Billion)Total Imports (Billion)Total Exports (Billion)Foreign Reserves
(Billion)
Current Account Balance
(Billion)
Average Exchange Rate
US$ to S$
Operating Revenue (Billion)Total Expenditure (Billion)
2014 S$390.089 S$71,318 S$378.329 S$69,168 S$982.701 S$463.779 S$518.922 S$340.438 S$74.466 S$1.2671 S$59.995 S$56.648
2013 S$378.200 S$70,047 S$366.618 S$67,902 S$980.153 S$466.762 S$513.391 S$344.729 S$67.674 S$1.2513 S$57.020 S$51.727
2012 S$362.332 S$68,205 S$351.765 S$66,216 S$984.883 S$474.554 S$510.329 S$316.744 S$62.200 S$1.2498 S$55.814 S$49.003
2011 S$346.353 S$66,816 S$338.452 S$65,292 S$974.396 S$459.655 S$514.741 S$308.403 S$76.172 S$1.2573 S$51.077 S$46.563
2010 S$322.361 S$63,498 S$320.526 S$63,137 S$902.062 S$423.221 S$478.840 S$288.954 S$76.278 S$1.3635 S$46.060 S$45,338
2009 S$279.858 S$56,111 S$266.889 S$53,511 S$747.417 S$356.299 S$391.118 S$263.955 S$47.068 S$1.4545 S$39.546 S$41.890
2008 S$271.980 S$56,201 S$259.712 S$53,666 S$927.654 S$450.892 S$478.840 S$250.346 S$39.251 S$1.4148 S$41.086 S$38.090
2005 S$212.074 S$49,715 S$198.050 S$46,428 S$192.813 S$46.382 S$1.6646 S$28.116 S$28.781
2000 S$165.217 S$41,018 S$164.205 S$40,767 S$138.927 S$17.511 S$1.7239 S$33.527 S$28.015
1995 S$124.575 S$35,346 S$125.475 S$35,601 S$97.330 S$20.434 S$1.4174 S$24.782 S$15.505
1990 S$70.507 S$23,139 S$69.798 S$22,907 S$48.478 S$5.614 S$1.8125 S$13.102 S$11.280
1985 S$40.823 S$14,921 S$41.161 S$15,045 S$27.070 S$1.274 S$2.2001
1980 S$25.863 S$10,714 S$24.536 S$10,165 S$13.757 S$-3.376 S$2.1413
1975 S$13.728 S$6,067 S$13.851 S$6,122 S$7.486 S$2.3713
1970 S$5.876 S$2,832 S$5.932 S$2,860 S$5.358 S$3.0620
1965 S$2.982 S$1,580 S$3.078 S$1,631
Using 2014 Market Prices

2014 to 2018

Economic statistics: 2014 to 2018
Sources: [11] [12] [13] [14] [15] [16] [17] [18] [19]
YearGDP

nominal

(billion)

GDP

nominal

per capita

GDP real

(billion)

GNI nominal

(billion)

GNI

nominal

per capita

Foreign

reserves

(billion)

Average

exchange rate

(1US$ to S$)

2014 S$398.987 S$72,937 S$411.540 S$385,070 S$70,400 S$340.438 S$1.2671
2015 S$423.444 S$76,502 S$423.444 S$394.551 S$71,283 S$350.991 S$1.3748
2016 S$439.412 S$78,364 S$435.988 S$408.820 S$72,909 S$356.254 S$1.3815
2017 S$467.306 S$83,265 S$452.119 S$434.806 S$77,474 S$373.994 S$1.3807
2018 S$491.174 S$87,108 S$466.313 S$457.983 S$81,222 S$392.096 S$1.3491

See also

Related Research Articles

<span class="mw-page-title-main">Gross domestic product</span> Market value of goods and services produced within a country

Gross domestic product (GDP) is a monetary measure of the market value of all the final goods and services produced in a specific time period by a country or countries. GDP is most often used by the government of a single country to measure its economic health. Due to its complex and subjective nature, this measure is often revised before being considered a reliable indicator.

A variety of measures of national income and output are used in economics to estimate total economic activity in a country or region, including gross domestic product (GDP), gross national product (GNP), net national income (NNI), and adjusted national income. All are specially concerned with counting the total amount of goods and services produced within the economy and by various sectors. The boundary is usually defined by geography or citizenship, and it is also defined as the total income of the nation and also restrict the goods and services that are counted. For instance, some measures count only goods & services that are exchanged for money, excluding bartered goods, while other measures may attempt to include bartered goods by imputing monetary values to them.

The gross world product (GWP), also known as gross world income (GWI), is the combined gross national income of all the countries in the world. Because imports and exports balance exactly when considering the whole world, this also equals the total global gross domestic product (GDP). According to the World Bank, the 2013 nominal GWP was approximately 75.59 trillion United States dollars. In 2017, according to the CIA's World Factbook, the GWP was around $80.27 trillion in nominal terms and totaled approximately 127.8 trillion international dollars in terms of purchasing power parity (PPP). The per capita PPP GWP in 2017 was approximately 17,500 international dollars according to the World Factbook. According to the World Bank, the 2020 GWP in current dollars was approximately $84.705 trillion.

<span class="mw-page-title-main">Economy of Singapore</span>

The economy of Singapore is a highly developed free-market economy with dirigiste characteristics. Singapore's economy has been consistently ranked as the most open in the world, the joint 4th-least corrupt, and the most pro-business. Singapore has low tax-rates and the highest per-capita GDP in the world in terms of purchasing power parity (PPP). The Asia-Pacific Economic Cooperation (APEC) is headquartered in Singapore.

In economics, the GDP deflator is a measure of the money price of all new, domestically produced, final goods and services in an economy in a year relative to the real value of them. It can be used as a measure of the value of money. GDP stands for gross domestic product, the total monetary value of all final goods and services produced within the territory of a country over a particular period of time.

<span class="mw-page-title-main">Lists of countries by GDP per capita</span> Lists of countries by GDP per capita

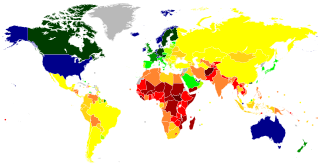
Lists of countries by GDP per capita list the countries in the world by their gross domestic product (GDP) per capita. The lists may be based on nominal or purchasing power parity GDP. Gross national income (GNI) per capita accounts for inflows and outflows of foreign capital. Income inequality metrics measure the distribution of income between rich and poor.

<span class="mw-page-title-main">Gross national income</span> Total domestic and foreign economic output claimed by residents of a country

The gross national income (GNI), previously known as gross national product (GNP), is the total domestic and foreign output claimed by residents of a country, consisting of gross domestic product (GDP), plus factor incomes earned by foreign residents, minus income earned in the domestic economy by nonresidents.

<span class="mw-page-title-main">Economy of the European Union</span>

The economy of the European Union is the joint economy of the member states of the European Union (EU). It is the second largest economy in the world in nominal terms, after the United States and the third one in purchasing power parity (PPP) terms, after China and the United States. The European Union's GDP estimated to be around $19.35 trillion (nominal) in 2024 representing around one sixth of the global economy. Germany has by far the biggest national GDP of all EU countries, followed by France and Italy.

This is a list of first-level country subdivisions by nominal gross state product. This list shows top 100 largest subdivisions by GDP nominal and PPP. Those subdivisions which are the largest in their respective countries are shown in bold.

Income in India discusses the financial state in India. With rising economic growth and prosperity, India’s income is also rising rapidly. As an overview, India's per capita net national income or NNI was around 1.97 lakh rupees in 2022. The per-capita income is a crude indicator of the prosperity of a country. In contrast, the gross national income at constant prices stood at over 128 trillion rupees. The same year, GRI growth rate at constant prices was around 6.6 percent. While GNI and NNI are both indicators for a country's economic performance and welfare, the GNI is related to the GDP or the Gross Domestic Product plus the net receipts from abroad, including wages and salaries, property income, net taxes and subsidies receivable from abroad. On the other hand, the NNI of a country is equal to its GNI net of depreciation.

<span class="mw-page-title-main">Modified gross national income</span> Metric to measure the Irish economy by excluding globalisation effects

Modified gross national income is a metric used by the Central Statistics Office (Ireland) to measure the Irish economy rather than GNI or GDP. GNI* is GNI minus the depreciation on Intellectual Property, depreciation on leased aircraft and the net factor income of redomiciled PLCs.

<span class="mw-page-title-main">Health spending as percent of gross domestic product (GDP) by country</span> Health economics

This article includes 2 lists of countries of the world and their total expenditure on health as a percent of gross domestic product (GDP). Total expenditure includes both public and private expenditures. See also: List of countries by total health expenditure per capita.

References

  1. "Gross Domestic Product (S$)". Department of Statistics, Singapore. Archived from the original on 13 November 2015. Retrieved 25 September 2015.
  2. "Gross Domestic Product Per Capita (S$)". Department of Statistics, Singapore. Archived from the original on 7 August 2015. Retrieved 25 September 2015.
  3. "Gross National Income (S$)". Department of Statistics, Singapore. Archived from the original on 13 November 2015. Retrieved 25 September 2015.
  4. "Gross National Income Per Capita (S$)". Department of Statistics, Singapore. Archived from the original on 13 November 2015. Retrieved 25 September 2015.
  5. "Total Trade, Total Imports, Total Exports (S$)". Department Of Statistics Singapore. Archived from the original on 11 September 2015. Retrieved 25 September 2015.
  6. "Foreign Reserves". Monetary Authority Of Singapore. Retrieved 25 September 2015.
  7. "Current Account Balance (S$)". Department Of Statistics Singapore. Archived from the original on 13 November 2015. Retrieved 25 September 2015.
  8. "Exchange Rates". Department of Statistics, Singapore. Archived from the original on 27 September 2015. Retrieved 25 September 2015.
  9. "Operating Revenue & Total Expenditure (S$)". Department of Statistics, Singapore. Archived from the original on 25 September 2015. Retrieved 25 September 2015.
  10. Operating Revenue & Total Expenditure (S$) for Year 1990, 1995, 2000. Economic Survey Of Singapore. 29 October 2002. ISBN   9781781008201 . Retrieved 26 September 2015.
  11. "Gross Domestic Product Per Capita (S$)". Department of Statistics, Singapore. Archived from the original on 7 August 2015. Retrieved 18 September 2015.
  12. "GDP per capita (current LCU) | Data". data.worldbank.org. Retrieved 2019-09-01.
  13. "Singapore Department Of Statistics | SingStat Table Builder - Gross Domestic Product In Chained (2015) Dollars, By Industry (SSIC 2015), Annual". www.tablebuilder.singstat.gov.sg. Retrieved 2019-09-01.
  14. "Singapore Department Of Statistics | SingStat Table Builder - Exchange Rates (Average For The Year), Annual". Singapore Department Of Statistics. Retrieved 2 September 2019.
  15. "Real Gross Domestic Product (S$), Gross National Income (S$), GNI Per Capita (S$)" (PDF). Department of Statistics Singapore. Archived from the original (PDF) on 1 July 2015. Retrieved 18 September 2015.
  16. "Singapore Department Of Statistics | SingStat Table Builder - Gross Domestic Product At Current Prices, By Industry (SSIC 2015), Annual". www.tablebuilder.singstat.gov.sg. Retrieved 2019-09-02.
  17. "Official Foreign Reserves". www.mas.gov.sg. Retrieved 2019-09-01.
  18. "Per Capita GNI And Per Capita GDP At Current Prices, Annual". Data.gov.sg. Retrieved 2019-09-01.
  19. "Singapore Department Of Statistics | SingStat Table Builder - Output, Saving & Investment At Current Prices, Annual". www.tablebuilder.singstat.gov.sg. Retrieved 2019-09-01.