Statistics | |
---|---|
Population | 2 billion [1] [2] |
GDP | |
GDP growth | 5.9% (2024 est.) [4] |
GDP per capita | |
7.2% (2022) [3] | |
Unemployment | 7% (2022) [3] |
Public finances | |
78.8% of GDP (2023 est.) [3] | |
Most numbers are from the International Monetary Fund. IMF South Asia Datasets All values, unless otherwise stated, are in US dollars. |
The economy of South Asia comprises 2 billion people (25% of the world population) living in eight countries (though Afghanistan is sometimes excluded). [5] [6] The Indian subcontinent was historically one of the richest regions in the world, comprising 25% of world GDP as recently as 1700, [7] [8] but experienced significant de-industrialisation and a doubling of extreme poverty during the colonial era of the late 18th to mid-20th century. [9] In the post-colonial era, South Asia has grown significantly, with India advancing because of economic liberalisation from the 1980s onwards, [10] and extreme poverty now below 15% in the region. [11] South Asia has been the fastest-growing region of the world since 2014. [12]
India was one of the richest countries in the world, for about two and a half millennia starting around the end of 1st millennium BC and ending around the beginning of British rule in India. [13]
Around 500 BC, the Mahajanapadas minted punch-marked silver coins. The period was marked by intensive trade activity and urban development. By 300 BC, the Maurya Empire had united most of the Indian subcontinent including Tamilakam, which was ruled by Three Crowned Kings. The resulting political unity and military security allowed for a common economic system and enhanced trade and commerce, with increased agricultural productivity.
The Maurya Empire was followed by classical and early medieval kingdoms, including the Cholas, Pandyas, Cheras, Guptas, Western Gangas, Harsha, Palas, Rashtrakutas and Hoysalas. The Indian subcontinent had the largest economy of any region in the world for most of the interval between the 1st and 18th centuries. [14] [15] [16] [17] From 1-1000 AD India constituted roughly 30% of the world's GDP. In the year 1000, Maddison estimates 28.5% of the world's population lived in India. [15]
India experienced per-capita GDP growth in the high medieval era, coinciding with the Delhi Sultanate. By the late 17th century, most of the Indian subcontinent had been reunited under the Mughal Empire, which for a time again became the largest economy and manufacturing power in the world, producing about a quarter of global GDP, before fragmenting and being conquered over the next century. [18] Bengal Subah, the empire's wealthiest province, that solely accounted for 40% of Dutch imports outside the west, [19] had an advanced, productive agriculture, textile manufacturing and shipbuilding, in a period of proto-industrialization. [20] [21]
By the 18th century, the Mysoreans had embarked on an ambitious economic development program that established the Kingdom of Mysore as a major economic power. Sivramkrishna analyzing agricultural surveys conducted in Mysore by Francis Buchanan in 1800–1801, arrived at estimates, using "subsistence basket", that aggregated millet income could be almost five times subsistence level. [22] The Maratha Empire also managed an effective administration and tax collection policy throughout the core areas under its control and extracted chauth from vassal states. [23]
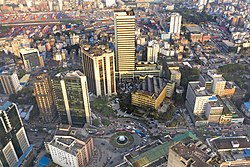
India is the largest economy in the region (US$4.11 trillion) and makes up almost 80% of the South Asian economy; it is the world's 5th largest economy in nominal terms and the world's 3rd largest economy by purchasing power adjusted exchange rates (US$14.26 trillion). [24] India is the member of G-20 major economies and BRICS from the region. It is the fastest-growing major economy in the world and one of the world's fastest registering a growth of 7.2% in FY 2022-23. [25]
India is followed by Bangladesh, which has a GDP of ($446 billion).
a. It is one of the emerging and growth-leading economies of the world, and is also listed among the Next Eleven countries. It is also one of the fastest-growing middle-income countries. It has the world's 33rd largest GDP in nominal terms and is th5 27th largest by purchasing power adjusted exchange rates (476015 trillion). Bangladesh's economic growth was 6.4% in 2022. [26] Pakistan has an economy of ($40 billio nominal GDPn.. [27] Next is Sri Lanka, which has the 2nd highest GDP per capita and the 4th largest economy in the region.
Certain parts of South Asia are significantly wealthier than others; the four Indian states of Maharashtra, Tamil Nadu, Gujarat and Karnataka are projected to account for almost 50% of India's GDP by 2030, while the five South Indian states comprising 20% of India's population are expected to contribute 35% of India's GDP by 2030. [28]
The major stock exchanges in the region are Bombay Stock Exchange (BSE) with market Capitalization of $3.8 trillion (8th largest in the world), National Stock Exchange of India (NSE) with market capitalization of $3.27 trillion (9th largest in the world), Dhaka Stock Exchange (DSE), Colombo Stock Exchange (CSE), and Pakistan Stock Exchange (PSX) with market capitalization of $72 billion. Economic data is sourced from the International Monetary Fund, current as of April 2017, and is given in US dollars. [29]
India is home to the Indian Premier League, which is the second-most valued sports league in the world on a per-match basis. [30]
English Belt (Anglosphere): United States of America (USA), United Kingdom (England), Canada, Australia and New Zealand
India (Indian Union) is a "Union-cum-Country", Pakistan (Pakistani Union) is also a "Union-cum-Country". Bangladesh (East Bengal) is a "State-cum-Country", Nepal is also a "State-cum-Country", Sri Lanka is also a "State-cum-Country".
Maharashtra is a "State-only", not a "State-cum-Country", Tamil Nadu is also a "State-only", not a "State-cum-Country", West Bengal is also a "State-only", not a "State-cum-Country".
Dravidian Belt: Tamil Nadu, Karnataka, Telangana, Andhra Pradesh and Kerala
Hindu Belt: India (Indian Union) and Nepal
Bengali Belt: Bangladesh (East Bengal), West Bengal and Tripura
Hindustani (Hindi-Urdu) Belt: Uttar Pradesh, Rajasthan, Madhya Pradesh, Delhi, Haryana, Bihar, Chhattisgarh, Jharkhand, Jammu & Kashmir, Uttarakhand and Himachal Pradesh
Islamic Belt: Bangladesh (East Bengal), Pakistan (Pakistani Union), Afghanistan and Maldives
Punjabi Belt: Pakistan's Punjab (West Punjab) and India's Punjab (East Punjab)
Buddhist Belt: Myanmar (Burma), Sri Lanka and Bhutan
Continents, Unions, Countries, Belts, Regions, States and Cities by Nominal GDP Per Capita (2023–2024) and Nominal GDP (2023-2024)
Rank | Union/Belt/Region/State/City | Real Economy (Nominal GDP Per Capita) | Nominal Economy (Nominal GDP) | Population (2021) | Language |
---|---|---|---|---|---|
1 | United States of America's New York (NY) | $1,00,000 (720%) | $2.3 Trillion | 2.3 crore | English |
2 | United States of America (USA) | $84,800 (610%) | $28 Trillion (25%) | 33 crore (4%) | English |
3 | English Belt (Anglosphere) | $77,400 (560%) | $36 Trillion (33%) | 46.5 crore (6%) | English |
4 | Europe's Germany | $55,200 | $4.7 Trillion | 8.5 crore | German |
5 | United Kingdom (England) | $53,700 | $3.6 Trillion | 6.7 crore | English |
6 | Europe's France | $47,700 | $3.2 Trillion | 6.7 crore | French |
7 | Europe (European Union) | $44,400 (320%) | $20 Trillion (18%) | 45 crore (5.5%) | English |
8 | Japan | $33,000 | $4.3 Trillion | 13 crore | Japanese |
9 | Saudi Arabia | $30,500 | $1.1 Trillion | 3.6 crore | Arabic |
10 | India's Delhi (National Capital Territory) | $14,000 (520%) | $294 Billion | 2.1 crore | Hindi |
11 | World | $13,900 (100%) | $110 Trillion (100%) | 790 crore (100%) | English |
12 | China | $13,400 (96%) | $19 Trillion (17%) | 141 crore (18%) | Chinese |
13 | Russia | $12,600 | $1.9 Trillion | 15 crore | Russian |
14 | Maharashtra's Mumbai (Bombay) | $12,300 (450%) | $320 Billion | 2.6 crore | Marathi |
15 | Non-English Belt (Non-Anglosphere) | $9,900 (71%) | $74 Trillion (67%) | 743.5 crore (94%) | English |
16 | Tamil Nadu's Chennai (Madras) | $9,000 | $100 Billion | 1.1 crore | Tamil |
17 | Asia | $8,900 (64%) | $43 Trillion (39%) | 480 crore (60%) | English |
18 | Karnataka's Bengaluru (Bangalore) | $8,300 | $100 Billion | 1.2 crore | Kannada |
19 | Telangana's Hyderabad | $8,000 | $80 Billion | 1 crore | Telugu |
20 | Bangladesh's Dhaka (Dacca) | $7,800 | $180 Billion | 2.3 crore | Bengali |
21 | Arabic Belt (Arabia) | $7,400 | $3.5 Trillion | 47 crore | Arabic |
22 | West Bengal's Kolkata (Calcutta) | $6,800 | $110 Billion | 1.6 crore | Bengali |
23 | India's Gujarat | $4,900 | $320 Billion | 6.5 crore | Gujarati |
24 | India's Haryana | $4,600 | $140 Billion | 3 crore | Hindi |
25 | India's Karnataka | $4,500 | $320 Billion | 7 crore | Kannada |
26 | India's Telangana | $4,500 | $180 Billion | 4 crore | Telugu |
27 | India's Dravidian Belt | $4,200 (155%) | $1.2 Trillion (30%) | 28.5 crore (20%) | English |
28 | India's Tamil Nadu | $4,200 | $360 Billion | 8.5 crore | Tamil |
29 | India's Kerala | $4,200 | $150 Billion | 3.5 crore | Malayalam |
30 | India's Maharashtra | $4,000 (145%) | $520 Billion (13%) | 13 crore (9%) | Marathi |
31 | Sindh's Karachi | $3,900 | $90 Billion | 2.3 crore | Sindhi |
32 | India's Non-Hindustani (Non Hindi-Urdu) Belt | $3,600 (130%) | $2.6 Trillion (67%) | 71.5 crore (51%) | English |
33 | India's Andhra Pradesh | $3,200 | $180 Billion | 5.5 crore | Telugu |
34 | Sri Lanka | $3,100 | $70 Billion | 2.2 crore | Sinhala |
35 | Africa | $3,000 | $3 Trillion | 100 crore | English |
36 | India's Punjab (East Punjab) | $3,000 | $90 Billion | 3 crore | Punjabi |
37 | India (Indian Union) | $2,700 (100%) | $3.9 Trillion (100%) | 141 crore (100%) | English |
38 | Bangladesh (East Bengal) | $2,700 | $460 Billion | 17 crore | Bengali |
39 | Bengali Belt (Bengal) | $2,500 | $710 Billion | 27.5 crore | Bengali |
40 | India's Rajasthan | $2,500 | $200 Billion | 8 crore | Hindi |
41 | India's West Bengal | $2,400 | $240 Billion | 10 crore | Bengali |
42 | India's Odisha | $2,300 | $110 Billion | 4.7 crore | Odia |
43 | India's Madhya Pradesh | $2,100 | $180 Billion | 8.5 crore | Hindi |
44 | India's Assam | $2,000 | $70 Billion | 3.5 crore | Assamese |
45 | India's Chhattisgarh | $2,000 | $60 Billion | 3 crore | Hindi |
46 | Punjabi Belt (Punjab) | $1,900 | $290 Billion | 15 crore | Punjabi |
47 | India's Hindustani (Hindi-Urdu) Belt | $1,800 (66%) | $1.3 Trillion (33%) | 69.5 crore (49%) | Hindi |
48 | Pakistan's Punjab (West Punjab) | $1,600 | $200 Billion | 12 crore | Punjabi |
49 | Pakistan's Sindh | $1,600 | $100 Billion | 6 crore | Sindhi |
50 | Pakistan (Pakistani Union) | $1,400 | $350 Billion | 24 crore | Urdu |
51 | Myanmar | $1,400 | $80 Billion | 5.5 crore | Burmese |
52 | Nepal | $1,300 | $40 Billion | 3 crore | Nepali |
53 | India's Uttar Pradesh | $1,200 | $310 Billion | 24 crore | Hindi |
54 | India's Jharkhand | $1,200 | $50 Billion | 4 crore | Hindi |
55 | India's Bihar | $840 | $110 Billion | 13 crore | Hindi |
56 | Afghanistan | $370 | $15 Billion | 4 crore | Pashtun |
Country | GDP | Inflation (2022) [35] | HDI | |||||
---|---|---|---|---|---|---|---|---|
Nominal GDP(in millions) (2022) (%Share) [36] | GDP per capita (2022) [37] | GDP (PPP)(in millions) (2022) (%Share) | GDP (PPP) per capita (2022) | GDP growth (2022) [38] | HDI (2019) [39] | Inequality-adjusted HDI (2019) [40] | ||
Afghanistan [41] | $20,136 (2020) | $611 (2020) | $80,912 (2020) | $2,456 (2020) | -2.4% (2020) | 5.6% (2020) | 0.478 (low) | No data |
Bangladesh | $460,751 (10.41%) | $2,734 | $1,345,646 (8.97%) | $7,985 | 7.2% | 6.1% | 0.661 (medium) | 0.465 (low) |
Bhutan | $2,707 (0.06%) | $3,562 | $9,937 (0.07%) | $13,077 | 4.0% | 7.7% | 0.666 (medium) | 0.450 (low) |
India | $3,468,566 (78.35%) | $2,466 | $11,665,490 (77.74%) | $8,293 | 6.8% | 6.9% | 0.633 (medium) | 0.538 (low) |
Maldives | $5,900 (0.13%) | $15,097 | $12,071 (0.08%) | $30,888 | 8.7% | 4.3% | 0.747 (high) | 0.568 (medium) |
Nepal | $39,028 (0.88%) | $1,293 | $141,161 (0.94%) | $4,677 | 4.2% | 6.3% | 0.602 (medium) | 0.430 (low) |
Pakistan | $376,493 (8.50%) | $1,658 | $1,512,476 (10.08%) | $6,662 | 6.0% | 12.10% | 0.544 (low) | 0.386 (low) |
Sri Lanka | $73,739 (1.67%) | $3,293 | $318,690 (2.12%) | $14,230 | -8.7% | 48.2% | 0.782 (high) | 0.686 (medium) |
South Asia [42] | $4,427,184 (100%) | $2,385 | $15,005,471 (100%) | $8,085 | 6.4% | 8.1% | 0.639 (medium) | - |
Nominal GDP Per Capita (2023–2024) and Nominal GDP (2023-2024) of Indian sub continent
Rank | Union/Belt/Region/State/City | Real Economy (Nominal GDP Per Capita) | Nominal Economy (Nominal GDP) | Population (2021) | Language | Language Family |
---|---|---|---|---|---|---|
1 | Maharashtra's Mumbai (Bombay) | $12,300 (450%) | $320 Billion | 2.6 crore | Marathi | Indo-European |
2 | Tamil Nadu's Chennai (Madras) | $9,000 | $100 Billion | 1.1 crore | Tamil | Dravidian |
3 | Karnataka's Bengaluru (Bangalore) | $8,300 | $100 Billion | 1.2 crore | Kannada | Dravidian |
4 | Telangana's Hyderabad | $8,000 | $80 Billion | 1 crore | Telugu | Dravidian |
5 | Bangladesh's Dhaka (Dacca) | $7,800 | $180 Billion | 2.3 crore | Bengali | Indo-European |
6 | India's Delhi (National Capital Territory) | $7,100 | $150 Billion | 2.1 crore | Hindi (Hindustani) | Indo-European |
7 | West Bengal's Kolkata (Calcutta) | $6,800 | $110 Billion | 1.6 crore | Bengali | Indo-European |
8 | India's Gujarat | $4,900 | $320 Billion | 6.5 crore | Gujarati | Indo-European |
9 | India's Haryana | $4,600 | $140 Billion | 3 crore | Hindi (Hindustani) | Indo-European |
10 | India's Karnataka | $4,500 | $320 Billion | 7 crore | Kannada | Dravidian |
11 | India's Telangana | $4,500 | $180 Billion | 4 crore | Telugu | Dravidian |
12 | India's Dravidian Belt (Deccan) | $4,200 (155%) | $1.2 Trillion (30%) | 28.5 crore (20%) | English | Indo-European |
13 | India's Tamil Nadu | $4,200 | $360 Billion | 8.5 crore | Tamil | Dravidian |
14 | India's Kerala | $4,200 | $150 Billion | 3.5 crore | Malayalam | Dravidian |
15 | India's Maharashtra | $4,000 (145%) | $520 Billion (13%) | 13 crore (9%) | Marathi | Indo-European |
16 | Sindh's Karachi | $3,900 | $90 Billion | 2.3 crore | Sindhi | Indo-European |
17 | India's Non-Hindustani (Non Hindi-Urdu) Belt | $3,600 (130%) | $2.6 Trillion (67%) | 71.5 crore (51%) | English | Indo-European |
18 | India's Andhra Pradesh | $3,200 | $180 Billion | 5.5 crore | Telugu | Dravidian |
19 | Sri Lanka | $3,100 | $70 Billion | 2.2 crore | Sinhala | Indo-European |
20 | India's Punjab (East Punjab) | $3,000 | $90 Billion | 3 crore | Punjabi | Indo-European |
21 | Hindu Belt | $2,700 | $3.94 Trillion | 144 crore | English | Indo-European |
22 | India (Indian Union) | $2,700 (100%) | $3.9 Trillion (100%) | 141 crore (100%) | English | Indo-European |
23 | Bangladesh (East Bengal) | $2,700 | $460 Billion | 17 crore | Bengali | Indo-European |
24 | Bengali Belt | $2,500 | $710 Billion | 27.5 crore | Bengali | Indo-European |
25 | India's Rajasthan | $2,500 | $200 Billion | 8 crore | Hindi (Hindustani) | Indo-European |
26 | India's West Bengal | $2,400 | $240 Billion | 10 crore | Bengali | Indo-European |
27 | India's Odisha | $2,300 | $110 Billion | 4.7 crore | Odia | Indo-European |
28 | India's Madhya Pradesh | $2,100 | $180 Billion | 8.5 crore | Hindi (Hindustani) | Indo-European |
29 | India's Assam | $2,000 | $70 Billion | 3.5 crore | Assamese | Indo-European |
30 | India's Chhattisgarh | $2,000 | $60 Billion | 3 crore | Hindi (Hindustani) | Indo-European |
31 | Punjabi Belt | $1,900 | $290 Billion | 15 crore | Punjabi | Indo-European |
32 | Buddhist Belt | $1,900 | $150 Billion | 7.7 crore | English | Indo-European |
33 | India's Hindustani (Hindi-Urdu) Belt | $1,800 (66%) | $1.3 Trillion (33%) | 69.5 crore (49%) | Hindi (Hindustani) | Indo-European |
34 | Islamic Belt | $1,800 | $830 Billion | 45 crore | English | Indo-European |
35 | Pakistan's Punjab (West Punjab) | $1,600 | $200 Billion | 12 crore | Punjabi | Indo-European |
36 | Pakistan's Sindh | $1,600 | $100 Billion | 6 crore | Sindhi | Indo-European |
37 | Pakistan (Pakistani Union) | $1,400 | $350 Billion | 24 crore | Urdu (Hindustani) | Indo-European |
38 | Myanmar (Burma) | $1,400 | $80 Billion | 5.5 crore | Burmese | Sino-Tibetan |
39 | Nepal | $1,300 | $40 Billion | 3 crore | Nepali | Indo-European |
40 | India's Uttar Pradesh | $1,200 | $310 Billion | 24 crore | Hindi (Hindustani) | Indo-European |
41 | India's Jharkhand | $1,200 | $50 Billion | 4 crore | Hindi (Hindustani) | Indo-European |
42 | Pakistan's Khyber Pakhtunkhwa (Afghan Pradesh) | $870 | $35 Billion | 4 crore | Pashtun | Indo-European |
43 | India's Bihar | $840 | $110 Billion | 13 crore | Hindi (Hindustani) | Indo-European |
44 | Afghanistan | $370 | $15 Billion | 4 crore | Pashtun | Indo-European |
Poverty rates vary greatly throughout the region, with a majority of Afghanistan relying on humanitarian aid, [43] and 40% of Sri Lankans slipping into poverty due to the economic crisis that started in 2019. [44]
Country | Population below poverty line (at $1.9/day) | Global Hunger Index (2021) [45] | Population under-nourished (2015) [46] | Life expectancy (2019) [47] (global rank) | Global wealth report (2019) [48] [49] [50] | |||||
---|---|---|---|---|---|---|---|---|---|---|
World Bank [51] (year) | 2022 Multidimensional Poverty Index Report (MPI source year) [52] | Population in Extreme poverty (2022) [53] | CIA Factbook (2015) [54] | Total national wealth in billion USD (global rank) | Wealth per adult in USD | Median wealth per adult in USD (global rank) | ||||
Afghanistan | 54.5% (2016) | 55.91% (2015–16) | 18% | 36% | 28.3 (103rd) | 26.8% | 63.2 (160th) | 25 (116th) | 1,463 | 640 (156th) |
Bangladesh | 24.3% (2016) | 24.64% (2019) | 4% | 31.5% | 19.1 (76th) | 16.4% | 74.3 (82nd) | 697 (44th) | 6,643 | 2,787 (117th) |
Bhutan | 8.2% (2017) | 37.34% (2010) | 4% | 12% | No data | No data | 73.1 (99th) | No Data | No Data | No Data |
India | 21.9% (2011) | 14.9% (2019–21) | 0.9% | 29.8% | 27.5 (101st) | 15.2% | 70.8 (117th) | 12,614 (7th) | 14,569 | 3,042 (115th) |
Maldives | 8.2% (2016) | 0.77% (2016–17) | 4% | 16% | No data | 5.2% | 79.6 (33rd) | 7 (142nd) | 23,297 | 8,555 (74th) |
Nepal | 25.2% (2010) | 17.50% (2019) | 8% | 25.2% | 19.1 (76th) | 7.8% | 70.9 (116th) | 68 (94th) | 3,870 | 1,510 (136th) |
Pakistan | 24.3% (2015) | 38.33% (2017–18) | 5% | 12.4% | 24.7 (94th) | 22% | 69.3 (144th) | 465 (49th) | 4,096 | 1,766 (128th) |
Sri Lanka | 4.1% (2016) | 2.92% (2016) | 5% | 8.9% | 16 (65th) | 22% | 76.9 (54th) | 297 (60th) | 20,628 | 8,283 (77th) |
The economy of India has transitioned from a mixed planned economy to a mixed middle-income developing social market economy with notable public sector in strategic sectors. [57] It is the world's fifth-largest economy by nominal GDP and the third-largest by purchasing power parity (PPP); on a per capita income basis, India ranked 136th by GDP (nominal) and 125th by GDP (PPP). [58] From independence in 1947 until 1991, successive governments followed the Soviet model and promoted protectionist economic policies, with extensive Sovietization, state intervention, demand-side economics, natural resources, bureaucrat driven enterprises and economic regulation. This is characterised as dirigism, in the form of the Licence Raj. [59] [60] The end of the Cold War and an acute balance of payments crisis in 1991 led to the adoption of a broad economic liberalisation in India and indicative planning. [61] [62] Since the start of the 21st century, annual average GDP growth has been 6% to 7%. [57]
Nearly 70% of India's GDP is driven by domestic consumption; [63] country remains the world's fourth-largest consumer market. [64] Apart from private consumption, India's GDP is also fueled by government spending, investments, and exports. [65] In 2022, India was the world's 8th-largest importer and the 10th-largest exporter. [66] India has been a member of the World Trade Organization since 1 January 1995. [67] It ranks 63rd on the Ease of doing business index and 40th on the Global Competitiveness Index. [68] With 476 million workers, the Indian labour force is the world's second-largest. [69] India has one of the world's highest number of billionaires and extreme income inequality. [70] [71]
During the 2008 global financial crisis, the economy faced a mild slowdown. India endorsed Keynesian policy and initiated stimulus measures (both fiscal and monetary) to boost growth and generate demand. In subsequent years, economic growth revived. [72] The period between 2004 and 2014 is referred to as India's lost decade as India fell behind other BRIC economies. [73] [74]
In 2021–22, the foreign direct investment (FDI) in India was $82 billion. The leading sectors for FDI inflows were the service sector, the computer industry, and the telecom industry. [75] India has free trade agreements with several nations and blocs, including ASEAN, SAFTA, Mercosur, South Korea, Japan, Australia, UAE, and several others which are in effect or under negotiating stage. [76] [77]
The service sector makes up more than 50% of GDP and remains the fastest growing sector, while the industrial sector and the agricultural sector employs a majority of the labor force. [78] The Bombay Stock Exchange and National Stock Exchange are some of the world's largest stock exchanges by market capitalisation. [79] India is the world's sixth-largest manufacturer, representing 2.6% of global manufacturing output. [80] Nearly 65% of India's population is rural, [81] and contributes about 50% of India's GDP. [82] India faces high unemployment, rising income inequality, and a drop in aggregate demand. [83] [84] India's gross domestic savings rate stood at 29.3% of GDP in 2022. [85] In recent years, independent economists and financial institutions have accused the government of manipulating various economic data, especially GDP growth. [86] [87] India's overall social spending as a share of GDP in 2021–22 will be 8.6%, which is much lower than the average for OECD nations. [88] [89]The economy of Bangladesh is a major developing market economy. [90] As the second-largest economy in South Asia, [91] [92] Bangladesh's economy is the 35th largest in the world in nominal terms, and 25th largest by purchasing power parity. Bangladesh is seen by various financial institutions as one of the Next Eleven. It has been transitioning from being a frontier market into an emerging market. Bangladesh is a member of the South Asian Free Trade Area and the World Trade Organization. In fiscal year 2021–2022, Bangladesh registered a GDP growth rate of 7.2% after the global pandemic. [93] Bangladesh is one of the fastest growing economies in the world.
Industrialisation in Bangladesh received a strong impetus after the partition of India due to labour reforms and new industries. [94] Between 1947 and 1971, East Bengal generated between 70% and 50% of Pakistan's exports. [95] [96] Modern Bangladesh embarked on economic reforms in the late 1970s which promoted free markets and foreign direct investment. By the 1990s, the country had a booming ready-made garments industry. As of 16 March 2024, Bangladesh has the highest number of green garment factories in the world with Leadership in Energy and Environmental Design (LEED) certification from the United States Green Building Council (USGBC), where 80 are platinum-rated, 119 are gold-rated, 10 are silver, and four are without any rating. [97] As of 06 March 2024, Bangladesh is home to 54 of the top 100 LEED Green Garment Factories globally, including 9 out of the top 10, and 18 out of the top 20. [98] As of 27 April 2024, Bangladesh has a growing pharmaceutical industry with 12 percent average annual growth rate. Bangladesh is the only nation among the 48 least-developed countries that is almost self-sufficient when it comes to medicine production as local companies meet 98 percent of the domestic demand for pharmaceuticals. [99] Remittances from the large Bangladeshi diaspora became a vital source of foreign exchange reserves. [100] Agriculture in Bangladesh is supported by government subsidies and ensures self-sufficiency in food production. [101] [102] Bangladesh has pursued export-oriented industrialisation. [103] [104]
Bangladesh experienced robust growth after the pandemic with macroeconomic stability, improvements in infrastructure, a growing digital economy, and growing trade flows. [105] Tax collection remains very low, with tax revenues accounting for only 7.7% of GDP. [106] Bangladesh's banking sector has a large amount of non-performing loans or loan defaults, which have caused a lot of concern. [106] [107] The private sector makes up 80% of GDP. [108] [109] The Dhaka Stock Exchange and Chittagong Stock Exchange are the two stock markets of the country. [110] Most Bangladeshi businesses are privately owned small and medium-sized enterprises (SME) which make up 90% of all businesses. [111]The economy of Pakistan is categorized as a developing economy. It ranks as the 24th-largest based on GDP using purchasing power parity (PPP) and the 46th largest in terms of nominal GDP. With a population of 241.5 million people as of 2023, Pakistan’s position at per capita income ranks 161st by GDP (nominal) and 138th by GDP (PPP) according to the International Monetary Fund (IMF).
In its early years, Pakistan's economy relied heavily on private industries. The nationalization of a significant portion of the sector, including financial services, manufacturing, and transportation, began in the early 1970s under Zulfikar Ali Bhutto. During Zia-ul Haq's regime in the 1980s, an "Islamic" economy was adopted, outlawing economic practices forbidden in Sharīʿah and mandating traditional religious practices. The economy started privatizing again in the 1990s.
The economic growth centers in Pakistan are located along the Indus River; these include the diversified economies of Karachi and major urban centers in Punjab (such as Faisalabad, Lahore, Sialkot, Rawalpindi, and Gujranwala), alongside less developed areas in other parts of the country. Pakistan was classified as a semi-industrial economy for the first time in the late 1990s, albeit an underdeveloped country with a heavy dependence on agriculture, particularly the textile industry relying on cotton production. Primary export commodities include textiles, leather goods, sports equipment, chemicals, and carpets/rugs.
Pakistan is presently undergoing economic liberalization, including the privatization of all government corporations, aimed at attracting foreign investment and reducing budget deficits. However, the country continues to grapple with challenges such as a rapidly growing population, high illiteracy, political instability, a hostile neighborhood, and heavy foreign debt.The economy of Afghanistan is listed as the 155th largest in the world in terms of nominal gross domestic product (GDP), and 137th largest in the world in terms of purchasing power parity (PPP). With a population of around 41 million people, Afghanistan's GDP (nominal) stands at $6.81 billion as of 2024, amounting to a GDP per capita of $200 (according to a World Bank report). Its annual exports exceed $1.0 billion, with agricultural, mineral and textile products accounting for 94% of total exports. The nation's total external debt is $8.0 billion as of 2024. Afghanistan’s (GDP) nominal is projected to fall to $5.79 billion & GDP per capita $142 (according to IMF report) for the financial year 2025.
The Afghan economy continues to improve due to the influx of expats, establishment of more trade routes with neighboring and regional countries, and expansion of the nation's agriculture, energy and mining sectors. The billions of dollars in assistance that came from expats and the international community saw this increase when there was more political reliability after NATO became involved in Afghanistan.
Despite holding over one trillion dollars in proven untapped mineral deposits, Afghanistan remains one of the least developed countries in the world. Its unemployment rate is over 23% and about half of its population lives below the poverty line. The main factor behind this has been the continuous war in the country, which deterred business investors and left much of the population fighting among each other instead of catching up with the rest of the world. Afghanistan has long sought foreign investment in order to improve its economy. The population of Afghanistan increased by more than 50% between 2001 and 2014, while its GDP grew eightfold. After the U.S. withdrawal from Afghanistan and the Taliban's return to power in 2021, the Biden administration decided to confiscate or withhold $5.3 billion worth of assets from the Afghanistan Central Bank to stop the Taliban from accessing it.
The official currency of Afghanistan is the afghani (AFN), which has an exchange rate of around 70 afghanis to 1 United States dollar. The country has a central bank called Da Afghanistan Bank (DAB). A number of local banks also operate in the country, including the Afghanistan International Bank, Azizi Bank, New Kabul Bank and Pashtany Bank.The economy of Bhutan is based on agriculture and forestry, which provide the main livelihood for more than 60% of the population. Agriculture consists largely of subsistence farming and animal husbandry. Rugged mountains dominate the terrain and make the building of roads and other infrastructure difficult. Bhutan is among the richest by gross domestic product (nominal) per capita in South Asia, at $3,491 as of 2022, but it still places 153rd, and among the poorest in the world. The total gross domestic product is only $2,653 million, and 178th according to IMF.
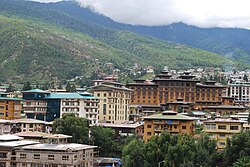
Bhutan's economy is closely aligned with India's through strong trade and monetary links and dependence on India's financial assistance. Most production in the industrial sector is of the cottage industry type. Most development projects, such as road construction, rely on Indian migrant labour. Model education, social, and environment programs are underway with support from multilateral development organisations.
Each economic program takes into account the government's desire to protect the country's environment and cultural traditions. For example, the government, in its cautious expansion of the tourist sector, encourages visits by upscale, environmentally conscientious tourists. Detailed controls and uncertain policies in areas such as industrial licensing, trade, labour, and finance continue to hamper foreign investment. Hydropower exports to India have boosted Bhutan's overall growth, even though GDP fell in 2008 as a result of a slowdown in India, its predominant export market.
Since 1961, the government of Bhutan has guided the economy through five-year plans in order to promote economic development. [112]
On 8 December 2023, Bhutan graduated from the UN's list of least developed countries (LDCs), making it only the 7th country to do so and the first in 3 years. [113] [114]In ancient times, Maldives were renowned for cowries, coir rope, dried tuna fish (Maldive fish), ambergris (maavaharu) and coco de mer (tavakkaashi). Local and foreign trading ships used to load these products in the Maldives and bring them abroad.
Nowadays, the mixed economy of Maldives is based on the principal activities of tourism, fishing and shipping. This results from the Maldives' strategic geographic positioning near crucial sea routes essential for China's energy provisions. Consequently, China has persistently utilized its economic resources to enhance its sway over the Maldivian government.
Tourism is the largest industry in the Maldives, accounting for 28% of GDP and more than 60% of the Maldives' foreign exchange receipts. It powered the current GDP per capita to expand 265% in the 1980s and a further 115% in the 1990s. Over 90% of government tax revenue flows in from import duties and tourism-related taxes.
Fishing is the second leading sector in the Maldives. The economic reform program by the government in 1989 lifted import quotas and opened some exports to the private sector. Subsequently, it has liberalized regulations to allow more foreign investment.
Agriculture and manufacturing play a minor role in the economy, constrained by the limited availability of cultivable land and shortage of domestic labour. Most staple foods are imported.
Industry in the Maldives consists mainly of garment production, boat building, and handicrafts. It accounts for around 18% of GDP. Maldivian authorities are concerned about the impact of erosion and possible global warming in the low-lying country.
Among the 1,190 islands in the Maldives, only 198 are inhabited. The population is scattered throughout the country, and the greatest concentration is on the capital island, Malé. Limitations on potable water and arable land, plus the added difficulty of congestion are some of the problems faced by households in Malé.
Development of the infrastructure in the Maldives is mainly dependent on the tourism industry and its complementary tertiary sectors, transport, distribution, real estate, construction, and government. Taxes on the tourist industry have been plowed into infrastructure and it is used to improve technology in the agricultural sector.The economy of Nepal is developing category and largely dependent on agriculture and remittances. Until the mid-20th century Nepal was an isolated pre-industrial society, which entered the modern era in 1951 without schools, hospitals, roads, telecommunications, electric power, industry, or civil service. The country has, however, made progress toward sustainable economic growth since the 1950s. The country was opened to economic liberalization, leading to economic growth and improvement in living standards when compared to the past. The biggest challenges faced by the country in achieving higher economic development are the frequent changes in political leadership, as well as corruption.
Nepal has consistently been ranked as one of the poorest countries in the world.
Nepal has used a series of five-year plans in an attempt to make progress in economic development. It completed its ninth economic development plan in 2002; its currency has been made convertible, and 17 state enterprises have been privatised. Foreign aid to Nepal accounts for more than half of the development budget. Government priorities over the years have been result in the development of transportation and communication facilities, agriculture, and industry. Since 1975, improved government administration and rural development efforts have been emphasised.
Agriculture remains Nepal's principal economic activity, employing about 65% of the population and providing 31.7% of GDP. Only about 20% of the total area is cultivable; another 40.7% is forested (i.e., covered by shrubs, pastureland and forest); most of the rest is mountainous. Fruits and vegetables (apples, pears, tomatoes, various salad greens, peach, nectarine, potatoes), as well as rice and wheat are the main food crops. The lowland Terai region produces an agricultural surplus, part of which supplies the food-deficient hill areas.
GDP is heavily dependent on remittances (9.1%) of foreign workers. Subsequently, economic development in social services and infrastructure in Nepal has not made dramatic progress. A countrywide primary education system is under development, and Tribhuvan University has several campuses. Although eradication efforts continue, malaria had been controlled in the fertile but previously uninhabitable Terai region in the south. Kathmandu is linked to India and nearby hill regions by road and an expanding highway network. The capital was almost out of fuel and supplies, due to a crippling general strike in southern Nepal on 17 February 2008.
Major towns are connected to the capital by telephone and domestic air services. The export-oriented carpet and garment industries have grown rapidly in recent years. Together, they account for approximately 70% of the country's merchandise exports.
The Cost of Living Index in Nepal is comparatively lower than many countries but not the least. The quality of life has declined to a much less desirous value in recent years. In the 2021 Global Hunger Index, Nepal ranks 76th out of the 116 countries with sufficient data to calculate 2021 GHI scores. With a score of 19.1, Nepal has a level of hunger that is moderate. Nepal has the worst road infrastructure in Asia.The mixed economy of Sri Lanka was worth $84 billion by nominal gross domestic product (GDP) in 2019 [115] and $296.959 billion by purchasing power parity (PPP). [116] The country had experienced an annual growth of 6.4 percent from 2003 to 2012, well above its regional peers. This growth was driven by the growth of non-tradable sectors, which the World Bank warned to be both unsustainable and unequitable. Growth has slowed since then. In 2019 with an income per capita of 13,620 PPP Dollars [117] or 3,852 (2019) nominal US dollars, [118] [119] Sri Lanka was re-classified as a lower middle income nation with the population around 22 million (2021) [120] by the World Bank from a previous upper middle income status. [121]
Sri Lanka has met the Millennium Development Goal (MDG) target of halving extreme poverty and is on track to meet most of the other MDGs, outperforming other South Asian countries. Sri Lanka's poverty headcount index was 4.1% by 2016. Since the end of the three-decade-long Sri Lankan Civil War, Sri Lanka has begun focusing on long-term strategic and structural development challenges, and has financed several infrastructure projects.
High foreign debt, economic mismanagement under the governments of Gotabhaya and Mahinda Rajapaksa, [122] and lower tourism revenue led to the country defaulting on its sovereign debt in April 2022. [123] The economy contracted 7.8% in 2022, and the percentage of the population earning less than $3.65 a day doubled to around 25% of the population. On March 20, 2023, the IMF has loaned US$3 billion to the country as part of a 48-month debt relief program. [124]In the South Asia Development Update for April 2024, the World Bank reports that South Asia is projected to sustain its position as a leading growth region among emerging markets, largely propelled by India's robust economic performance. Nonetheless, the region's dependency on the public sector for economic progress, combined with a lag in private investment and the presence of macroeconomic challenges such as high levels of debt and fiscal deficits, poses risks to its stability and growth. These factors may impede the region's capacity to effectively address climate-related issues and to make the most of the demographic dividend offered by its young population. The World Bank emphasizes the critical need for policy reforms aimed at stimulating job creation, particularly for women and in non-agricultural sectors, and for fostering private sector development to ensure continued economic growth and to leverage the demographic dividend. The update highlights that strategic responses to climate change and a focus on creating a resilient job market are indispensable for maintaining the momentum of South Asia's development trajectory. [125] [126]
Asia is the largest continent in the world by both land area and population. It covers an area of more than 44 million square kilometers, about 30% of Earth's total land area and 8% of Earth's total surface area. The continent, which has long been home to the majority of the human population, was the site of many of the first civilizations. Its 4.7 billion people constitute roughly 60% of the world's population.
The economy of Kenya is market-based with a few state enterprises. Kenya has an emerging market and is an averagely industrialised nation ahead of its East African peers. Currently a lower middle income nation, Kenya plans to be a newly industrialised nation by 2030. Major industries within the Kenyan market include financial services, agriculture, real estate, manufacturing, logistics, tourism, retail and energy. As of 2020, Kenya had the third largest economy in Sub-Saharan Africa, behind Nigeria and South Africa. Regionally, Kenya has had a stronger and more stable economy compared to its neighboring countries within East Africa.By 2023, the country had become Africa's largest start-up hub by both funds invested and number of projects.
In ancient times, Maldives were renowned for cowries, coir rope, dried tuna fish, ambergris (maavaharu) and coco de mer (tavakkaashi). Local and foreign trading ships used to load these products in the Maldives and bring them abroad.
The mixed economy of Sri Lanka was worth $84 billion by nominal gross domestic product (GDP) in 2019 and $296.959 billion by purchasing power parity (PPP). The country had experienced an annual growth of 6.4 percent from 2003 to 2012, well above its regional peers. This growth was driven by the growth of non-tradable sectors, which the World Bank warned to be both unsustainable and unequitable. Growth has slowed since then. In 2019 with an income per capita of 13,620 PPP Dollars or 3,852 (2019) nominal US dollars, Sri Lanka was re-classified as a lower middle income nation with the population around 22 million (2021) by the World Bank from a previous upper middle income status.
The economy of Thailand is dependent on exports, which accounted in 2021 for about 58 per cent of the country's gross domestic product (GDP). Thailand itself is a newly industrialized country, with a GDP of 17.367 trillion baht (US$495 billion) in 2022, the 9th largest economy in Asia. As of 2018, Thailand has an average inflation of 1.06% and an account surplus of 7.5% of the country's GDP. Its currency, the Thai Baht, ranked as the tenth most frequently used world payment currency in 2017.
The economy of Bangladesh is a major developing market economy. As the second-largest economy in South Asia, Bangladesh's economy is the 35th largest in the world in nominal terms, and 25th largest by purchasing power parity. Bangladesh is seen by various financial institutions as one of the Next Eleven. It has been transitioning from being a frontier market into an emerging market. Bangladesh is a member of the South Asian Free Trade Area and the World Trade Organization. In fiscal year 2021–2022, Bangladesh registered a GDP growth rate of 7.2% after the global pandemic. Bangladesh is one of the fastest growing economies in the world.
The category of newly industrialized country (NIC), newly industrialized economy (NIE) or middle income country is a socioeconomic classification applied to several countries around the world by political scientists and economists. They represent a subset of developing countries whose economic growth is much higher than that of other developing countries; and where the social consequences of industrialization, such as urbanization, are reorganizing society.
The world economy or global economy is the economy of all humans in the world, referring to the global economic system, which includes all economic activities conducted both within and between nations, including production, consumption, economic management, work in general, financial transactions and trade of goods and services. In some contexts, the two terms are distinct: the "international" or "global economy" is measured separately and distinguished from national economies, while the "world economy" is simply an aggregate of the separate countries' measurements. Beyond the minimum standard concerning value in production, use and exchange, the definitions, representations, models and valuations of the world economy vary widely. It is inseparable from the geography and ecology of planet Earth.
The South Asian Association for Regional Cooperation (SAARC) is the regional intergovernmental organization and geopolitical union of states in South Asia. Its member states are Afghanistan, Bangladesh, Bhutan, India, Maldives, Nepal, Pakistan, and Sri Lanka. SAARC comprises 3% of the world's land area, 21% of the world's population and 5.21% of the global economy, as of 2021.
The economy of Africa consists of the trade, industry, agriculture, and human resources of the continent. As of 2019, approximately 1.3 billion people were living in 53 countries in Africa. Africa is a resource-rich continent. Recent growth has been due to growth in sales, commodities, services, and manufacturing. West Africa, East Africa, Central Africa and Southern Africa in particular, are expected to reach a combined GDP of $29 trillion by 2050.
The economy of Asia comprises about 4.7 billion people living in 50 different nations. Asia is the fastest growing economic region, as well as the largest continental economy by both GDP Nominal and PPP in the world. Moreover, Asia is the site of some of the world's longest modern economic booms.
An emerging market is a market that has some characteristics of a developed market, but does not fully meet its standards. This includes markets that may become developed markets in the future or were in the past. The term "frontier market" is used for developing countries with smaller, riskier, or more illiquid capital markets than "emerging". As of 2006, the economies of China and India are considered to be the largest emerging markets. According to The Economist, many people find the term outdated, but no new term has gained traction. Emerging market hedge fund capital reached a record new level in the first quarter of 2011 of $121 billion. Emerging market economies’ share of global PPP-adjusted GDP has risen from 27 percent in 1960 to around 53 percent by 2013. The ten largest emerging economies by nominal GDP are 4 of the 9 BRICS countries along with Mexico, South Korea, Indonesia, Turkey, Saudi Arabia, and Poland. The inclusion of South Korea, Poland, and sometimes Taiwan are questionable given they are no longer considered emerging markets by the IMF and World Bank If we ignore those three, the top ten would include Argentina and Thailand.
The economy of India has transitioned from a mixed planned economy to a mixed middle-income developing social market economy with notable public sector in strategic sectors. It is the world's fifth-largest economy by nominal GDP and the third-largest by purchasing power parity (PPP); on a per capita income basis, India ranked 136th by GDP (nominal) and 125th by GDP (PPP). From independence in 1947 until 1991, successive governments followed the Soviet model and promoted protectionist economic policies, with extensive Sovietization, state intervention, demand-side economics, natural resources, bureaucrat driven enterprises and economic regulation. This is characterised as dirigism, in the form of the Licence Raj. The end of the Cold War and an acute balance of payments crisis in 1991 led to the adoption of a broad economic liberalisation in India and indicative planning. Since the start of the 21st century, annual average GDP growth has been 6% to 7%.
The Bay of Bengal Initiative for Multi-Sectoral Technical and Economic Cooperation (BIMSTEC) is an international organisation of seven South Asian and Southeast Asian nations, housing 1.73 billion people and having a combined gross domestic product of US$5.2 trillion (2023). The BIMSTEC member states – Bangladesh, Bhutan, India, Myanmar, Nepal, Sri Lanka, and Thailand – are among the countries dependent on the Bay of Bengal.
Several commentators suggest that India has the potential to become a global superpower, a state with an extensive ability to exert influence or to project power in much of the world. Factors that contribute to a nation acquiring such a status can be economic, political, demographic, military, and cultural.
South Asia is the southern subregion of Asia, which is defined in both geographical and ethnic-cultural terms. As commonly conceptualized, the modern states of South Asia include Afghanistan, Bangladesh, Bhutan, India, Maldives, Nepal, Pakistan, and Sri Lanka. South Asia borders East Asia to the northeast, Central Asia to the northwest, West Asia to the west and Southeast Asia to the east. Topographically, it is dominated by the Indian subcontinent and is bounded by the Indian Ocean in the south, and the Himalayas, Karakoram, and Pamir Mountains in the north.
The economy of Dhaka is the largest in the Peoples Republic of Bangladesh, contributing $213.3 billion in nominal gross state product and $740 billion in purchasing power parity terms as of 2022. The economy of Dhaka contributes 40% of Bangladesh's gross domestic product. If Dhaka were a sovereign nation, it would rank as the 50th largest economy in the world and fourth largest economy in South Asia, ahead of Myanmar, Sri Lanka, Nepal, Bhutan, Maldives, Afghanistan and behind India, Bangladesh and Pakistan. Dhaka also boast the highest per capita GDP in South Asia.
Debt-trap diplomacy is a term to describe an international financial relationship where a creditor country or institution extends debt to a borrowing nation partially, or solely, to increase the lender's political leverage. The creditor country is said to extend excessive credit to a debtor country with the intention of extracting economic or political concessions when the debtor country becomes unable to meet its repayment obligations. The conditions of the loans are often not publicized. The borrowed money commonly pays for contractors and materials sourced from the creditor country.
The Sri Lankan economic crisis is an ongoing crisis in Sri Lanka that started in 2019. It is the country's worst economic crisis since its independence in 1948. It has led to unprecedented levels of inflation, near-depletion of foreign exchange reserves, shortages of medical supplies, and an increase in prices of basic commodities. The crisis is said to have begun due to multiple compounding factors like tax cuts, money creation, a nationwide policy to shift to organic or biological farming, the 2019 Sri Lanka Easter bombings, and the impact of the COVID-19 pandemic in Sri Lanka. The subsequent economic hardships resulted in the 2022 Sri Lankan protests. Sri Lanka received a lifeline in the form of an Indian line of credit amounting to $4 billion. This substantial credit infusion served to cover the costs of importing essential goods and fuel. As a result, the foreign currency reserves of debt-ridden Sri Lanka experienced a notable improvement, reaching $2.69 billion.