Electoral history of Margaret Thatcher

Last updated

This is a summary of the electoral history of Margaret Thatcher , who served as Prime Minister of the United Kingdom from 1979 to 1990 and Leader of the Conservative Party from 1975 to 1990. She was the Member of Parliament (MP) for Finchley from 1959 to 1992.

Contents

Parliamentary elections

1950 general election, Dartford

General election 1950: Dartford [1]
PartyCandidateVotes%±%
Labour Co-op Norman Dodds 38,128 56.38
Conservative Margaret Roberts 24,49036.21
Liberal Anthony H. Giles5,0117.41New
Majority13,63820.17
Turnout 67,62985.51
Labour Co-op hold Swing

1951 general election, Dartford

General election 1951: Dartford [2]
PartyCandidateVotes%±%
Labour Co-op Norman Dodds 40,094 59.09
Conservative Margaret Roberts 27,76040.91
Majority12,33418.18
Turnout 67,85485.22
Labour Co-op hold Swing +3.71

1959 general election, Finchley

General election 1959: Finchley
PartyCandidateVotes%±%
Conservative Margaret Thatcher 29,697 53.2 ―1.4
Labour Eric Deakins 13,43724.1―7.3
Liberal Henry Ivan Spence12,70122.7+8.7
Majority16,26029.1+6.0
Turnout 55,83580.8+2.5
Conservative hold Swing +3.0

1964 general election, Finchley

General election 1964: Finchley
PartyCandidateVotes%±%
Conservative Margaret Thatcher 24,591 46.6 ―6.6
Liberal John Pardoe 15,78929.9+7.2
Labour Albert Edward Tomlinson12,40823.5―0.6
Majority8,80216.7―12.4
Turnout 52,78878.2―2.6
Conservative hold Swing

1966 general election, Finchley

General election 1966: Finchley
PartyCandidateVotes%±%
Conservative Margaret Thatcher 23,968 46.5 ―0.1
Labour Yvonne Sieve14,50428.1+4.6
Liberal Frank Davis13,07025.4― 4.5
Majority9,46418.4+1.7
Turnout 51,54275.3―2.9
Conservative hold Swing ―2.4

1970 general election, Finchley

General election 1970: Finchley
PartyCandidateVotes%±%
Conservative Margaret Thatcher 25,480 53.8 +7.3
Labour Michael Freeman14,29530.2+2.1
Liberal Graham Mitchell7,61416.1―9.3
Majority11,18523.6+5.2
Turnout 47,38965.6―9.7
Conservative hold Swing +2.6

February 1974 general election, Finchley

General election February 1974: Finchley
PartyCandidateVotes%±%
Conservative Margaret Thatcher 18,180 43.7 ―8.6
Labour Martin O'Connor12,20229.3―2.3
Liberal Laurence Brass11,22127.0+10.9
Majority5,97814.4
Turnout 41,60378.0
Conservative hold Swing ―3.1

October 1974 general election, Finchley

General election October 1974: Finchley
PartyCandidateVotes%±%
Conservative Margaret Thatcher 16,498 44.0 +0.3
Labour Martin O'Connor12,58733.6+4.3
Liberal Laurence Brass7,38419.7―7.3
National Front Janet Godfrey9932.7New
Majority3,91110.4―4.0
Turnout 37,46269.5―8.5
Conservative hold Swing ―2.0

1979 general election, Finchley

General election 1979: Finchley
PartyCandidateVotes%±%
Conservative Margaret Thatcher 20,918 52.5 +8.5
Labour Richard May 13,04032.7―0.9
Liberal Anthony Paterson5,25413.2―6.5
National Front William Verity5341.3―1.4
Independent DemocratElizabeth Lloyd860.2New
Majority7,87819.8+9.4
Turnout 39,83272.5+3.0
Conservative hold Swing +4.7

1983 general election, Finchley

General election 1983: Finchley [3]
PartyCandidateVotes%±%
Conservative Margaret Thatcher 19,616 51.1 ―1.4
Labour Laurence Spigel10,30226.8―5.9
Liberal Margaret Joachim 7,76320.2+7.0
Ecology Simone Wilkinson2790.7New
Monster Raving Loony Screaming Lord Sutch 2350.6New
Ban Every Licensing Law SocietyAnthony Noonan750.2New
Rail Not MotorwayHelen Anscomb420.1New
Law and Order in Gotham CityAnthony Whitehead370.1New
Anti-Censorship David Webb 280.1New
Party of Associates with LicenseesBrian Wareham270.1New
Belgrano Blood-HungerBenjamin Wedmore130.0New
Majority9,31424.3+4.5
Turnout 38,41769.0―3.5
Conservative hold Swing +2.2

1987 general election, Finchley

General election 1987: Finchley [4]
PartyCandidateVotes%±%
Conservative Margaret Thatcher 21,603 53.9 +2.8
Labour John Davies12,69031.7+4.9
Liberal David Howarth5,58013.9―7.3
Gremloid Party Lord Buckethead 1310.3New
Gold PartyMichaelle St Vincent590.2New
Majority8,91322.2―2.1
Turnout 40,06369.4+0.4
Conservative hold Swing ―1.0

Conservative Party leadership elections

1975 leadership election

First ballot: 4 February 1975
CandidateVotes%
Margaret Thatcher 13047.1
Edward Heath 11943.1
Hugh Fraser 165.8
Second ballot required
Second ballot: 11 February 1975
CandidateVotes%
Margaret Thatcher 14652.9
William Whitelaw 7928.6
Geoffrey Howe 196.9
Jim Prior 196.9
John Peyton 114
Margaret Thatcher elected

1989 leadership election

Only ballot: 5 December 1989
CandidateVotes%
Margaret Thatcher 31484.0
Sir Anthony Meyer 338.8
Abstentions30.8
Spoilt 246.4
Majority28175.1
Turnout374N/A
Margaret Thatcher re-elected

1990 leadership election

First ballot: 20 November 1990
CandidateVotes [5] %
Margaret Thatcher 20454.8
Michael Heseltine 15240.9
Abstentions164.3
Majority5214.0
Turnout372100
Second ballot required

United Kingdom general elections

1979 general election

UK General Election 1979
CandidatesVotes
PartyLeaderStoodElectedGainedUnseatedNet % of total %No.Net %
  Conservative Margaret Thatcher 62233963 1 +6253.443.913,697,923+8.1
  Labour James Callaghan 623269 [lower-alpha 1] 454−5042.436.911,532,218−2.3
  Liberal David Steel 57711 1 3−21.713.84,313,804−4.5
  SNP William Wolfe 71209−90.311.6504,259−1.3
  Ulster Unionist Harry West 115 1 2−10.790.8254,578−0.1
  National Front John Tyndall 3030000N/A0.6191,719+0.2
  Plaid Cymru Gwynfor Evans 3620 1 −10.310.4132,544−0.2
  SDLP Gerry Fitt 9 1 0000.160.4126,325−0.2
  Alliance Oliver Napier 120000N/A0.382,892+0.1
  DUP Ian Paisley 5320+20.470.270,795−0.1
  Ecology Jonathan Tyler 530000N/A0.139,918+0.1
  UUUP Ernest Baird 2 1 1 0+10.160.139,856N/A
  Ulster Popular Unionist James Kilfedder 1 1 1 0+10.160.136,989+0.1
  Independent Labour N/A110000N/A0.126,058−0.1
  Irish Independence Fergus McAteer and Frank McManus 40000N/A0.123,086N/A
  Independent Republican N/A 1 1 000N/A0.122,398−0.1
  Independent N/A620000N/A0.119,531+0.1
  Communist Gordon McLennan 380000N/A0.116,8580.0
  SLP Jim Sillars 30000N/A0.113,737N/A
  Workers Revolutionary Michael Banda 600000N/A0.112,631+0.1
  Workers' Party Tomás Mac Giolla 70000N/A0.112,0980.0
  Independent SDLP N/A 1 0000N/A0.010,785N/A
  Unionist Party NI Anne Dickson 30000N/A0.08,021−0.1
  Ind. Conservative N/A70000N/A0.04,8410.0
  NI Labour Alan Carr 30000N/A0.04,4410.0
  Mebyon Kernow Richard Jenkin 30000N/A0.04,1640.0
  Democratic Labour Dick Taverne 20000N/A0.03,785−0.1
  Wessex Regionalist Viscount Weymouth 70000N/A0.03,090N/A
  Socialist Unity N/A100000N/A0.02,834N/A
  United Labour Paddy Devlin 1 0000N/A0.01,895N/A
 Independent DemocraticN/A50000N/A0.01,087N/A
  United Country Edmund Iremonger20000N/A0.01,033N/A
  Independent Liberal N/A20000N/A0.01,0230.0
 Independent SocialistN/A20000N/A0.07700.0
  Workers (Leninist) Royston Bull20000N/A0.07670.0
  New Britain Dennis Delderfield20000N/A0.07170.0
  Fellowship Ronald Mallone20000N/A0.05310.0
  More Prosperous Britain Tom Keen60000N/A0.05180.0
  United English National John Kynaston20000N/A0.02380.0
  Cornish Nationalist James Whetter 1 0000N/A0.0227N/A
  Social Democrat Donald Kean 1 0000N/A0.01440.0
  English National Frank Hansford-Miller 1 0000N/A0.01420.0
 The Dog Lovers' Party Auberon Waugh 1 0000N/A0.0790.0
  Socialist (GB) N/A 1 0000N/A0.0780.0
All parties shown. [lower-alpha 2] [lower-alpha 3]
Government's new majority43
Total votes cast31,221,362
Turnout76%

1983 general election

1983 UK general election
CandidatesVotes
PartyLeaderStoodElectedGainedUnseatedNet % of total %No.Net %
  Conservative Margaret Thatcher 6333974710+3761.142.413,012,316−1.5
  Labour Michael Foot 633209455−5132.227.68,456,934−9.3
  Alliance David Steel & Roy Jenkins 636 [lower-alpha 4] 23120+124.525.47,794,770+11.6
  SNP Gordon Wilson 7220000.31.1331,975−0.5
  Ulster Unionist James Molyneaux 161131+21.70.8259,9520.0
  DUP Ian Paisley 1432 1 +10.50.5152,749+0.3
  SDLP John Hume 17 1 0 1 −10.20.4137,0120.0
  Plaid Cymru Dafydd Wigley 3820000.30.4125,3090.0
  Sinn Féin Ruairí Ó Brádaigh 14 1 1 1 00.20.3102,701N/A
  Alliance Oliver Napier 1200000.00.261,275−0.1
  Ecology Jonathon Porritt 10900000.00.254,299+0.1
  Independent N/A7300000.00.130,422N/A
  National Front Andrew Brons 6000000.00.127,065−0.5
  UPUP James Kilfedder 1 1 1 0+10.20.122,861N/A
  Independent Labour N/A800000.00.116,4470.0
  Workers' Party Tomás Mac Giolla 1400000.00.014,650−0.1
  BNP John Tyndall 5400000.00.014,621N/A
  Communist Gordon McLennan 3500000.00.011,606−0.1
  Independent Socialist N/A 1 00000.00.010,326N/A
  Ind. Conservative N/A1000000.00.09,4420.0
 Independent CommunistN/A200000.00.04,760N/A
  Workers Revolutionary Michael Banda 2100000.00.03,798−0.1
  Monster Raving Loony Screaming Lord Sutch 1100000.00.03,015N/A
  Wessex Regionalist N/A1000000.00.01,7500.0
  Mebyon Kernow Richard Jenkin 200000.00.01,151N/A
  Independent DUP N/A 1 00000.00.01,134N/A
  Licensees N/A400000.00.0934N/A
  Nationalist Party N/A500000.00.0874N/A
  Labour and Trade Union Peter Hadden 1 00000.00.0584N/A
  Revolutionary Communist Frank Furedi 400000.00.0581N/A
  Freedom Party N/A100000.00.0508N/A
All parties with more than 500 votes shown. [lower-alpha 5] [lower-alpha 6] [lower-alpha 7] [lower-alpha 8]
Government's new majority144
Total votes cast30,671,137
Turnout72.7%

1987 general election

UK general election 1987
CandidatesVotes
PartyLeaderStoodElectedGainedUnseatedNet % of total %No.Net %
  Conservative Margaret Thatcher 633376 [lower-alpha 9] 9302157.8542.213,760,5830.2
  Labour Neil Kinnock 633229266+2035.2330.810,029,807+3.2
  Alliance David Owen & David Steel 633225613.3822.67,341,6332.8
  SNP Gordon Wilson 72332+10.461.3416,473+0.2
  Ulster Unionist James Molyneaux 1290221.380.8276,2300.0
  SDLP John Hume 13320+20.460.5154,067+0.1
  Plaid Cymru Dafydd Elis-Thomas 383 1 0+10.460.4123,5990.0
  Green N/A13300000.389,753+0.1
  DUP Ian Paisley 430000.460.385,6420.2
  Sinn Féin Gerry Adams 14 1 0000.150.383,3890.0
  Alliance John Alderdice 1600000.272,6710.0
  Workers' Party Tomás Mac Giolla 1400000.119,294+0.1
  UPUP James Kilfedder 1 1 0000.150.118,4200.0
  Real Unionist Robert McCartney 1 00000.114,467N/A
  Communist Gordon McLennan 1900000.06,0780.0
  Protestant Unionist George Seawright 1 00000.05,671N/A
  Red Front N/A1400000.03,177N/A
  Orkney and Shetland Movement John Goodlad 1 00000.03,095N/A
  Moderate Labour Brian Marshall200000.02,269N/A
  Monster Raving Loony Screaming Lord Sutch 500000.01,9510.0
  Workers Revolutionary Sheila Torrance1000000.01,7210.0
  Independent Liberal N/A 1 00000.06860.0
  BNP John Tyndall 200000.05530.0
 Spare the EarthN/A 1 00000.0522N/A
All parties gaining over 500 votes listed.
Government's new majority102
Total votes cast32,529,578
Turnout75.3%

Notes

  1. The seat and vote count figures for Labour given here include the Speaker of the House of Commons
  2. The Vanguard Progressive Unionist Party had folded in 1978. Of its three MPs, two joined the Ulster Unionist Party (one held his seat, the other lost to the Democratic Unionist Party) and the third defended and held his seat for the United Ulster Unionist Party.
  3. James Kilfedder had been previously elected as an Ulster Unionist MP, but left the party, defending and holding his seat as an Independent Ulster Unionist. He subsequently founded the Ulster Popular Unionist Party but did not use that label in this election.
  4. Includes official Liberal candidates who were not given national Alliance endorsement in three constituencies: Liverpool Broadgreen, Hackney South and Shoreditch, and Hammersmith.
  5. The SDP–Liberal Alliance vote is compared with the Liberal Party vote in the 1979 election.
  6. The Independent Unionist elected in the 1979 election defended and held his seat for the Ulster Popular Unionist Party. The United Ulster Unionist Party dissolved and its sole MP did not re-stand.
  7. The Independent Republican elected in the 1979 election died in 1981. In the ensuring by-election the seat was won by Bobby Sands, an Anti-H-Block/Armagh Political Prisoner who then died and was succeeded by an Anti-H-Block Proxy Political Prisoner candidate Owen Carron. He defended and lost his seat standing for Sinn Féin who contested seats in Northern Ireland for the first time since 1959.
  8. This election was fought under revised boundaries. The changes reflect those comparing to the notional results on the new boundaries. One significant change was the increase in the number of seats allocated to Northern Ireland from 12 to 17.
  9. The seat and vote count figures for the Conservatives given here include the Speaker of the House of Commons

Related Research Articles

<span class="mw-page-title-main">Ulster Unionist Party</span> Political party in Northern Ireland

The Ulster Unionist Party (UUP) is a unionist political party in Northern Ireland. The party was founded as the Ulster Unionist Council in 1905, emerging from the Irish Unionist Alliance in Ulster. Under Edward Carson, it led unionist opposition to the Irish Home Rule movement. Following the partition of Ireland, it was the governing party of Northern Ireland between 1921 and 1972. It was supported by most unionist voters throughout the conflict known as the Troubles, during which time it was often referred to as the Official Unionist Party (OUP).

<span class="mw-page-title-main">1979 United Kingdom general election</span>

The 1979 United Kingdom general election was held on Thursday 3 May 1979 to elect 635 members to the House of Commons.

<span class="mw-page-title-main">1983 United Kingdom general election</span> British 1983 election

The 1983 United Kingdom general election was held on Thursday 9 June 1983. It gave the Conservative Party under the leadership of Margaret Thatcher the most decisive election victory since that of the Labour Party in 1945, with a majority of 144 seats and the first of two consecutive landslide victories.

<span class="mw-page-title-main">1987 United Kingdom general election</span>

The 1987 United Kingdom general election was held on Thursday 11 June 1987, to elect 650 members to the House of Commons. The election was the third consecutive general election victory for the Conservative Party, who won a majority of 102 seats and second landslide under the leadership of Margaret Thatcher, who became the first Prime Minister since the Earl of Liverpool in 1820 to lead a party into three successive electoral victories.

<span class="mw-page-title-main">October 1974 United Kingdom general election</span>

The October 1974 United Kingdom general election took place on Thursday 10 October 1974 to elect 635 members of the British House of Commons. It was the second general election held that year; the first year that two general elections were held in the same year since 1910; and the first time that two general elections were held less than a year apart from each other since the 1923 and 1924 elections, which took place 10 months apart. The election resulted in the Labour Party, led by Prime Minister Harold Wilson, winning a bare majority of three seats. That enabled the remainder of the Labour government to take place, but it saw a gradual loss of its majority.

<span class="mw-page-title-main">1959 United Kingdom general election</span> 8 October 1959

The 1959 United Kingdom general election was held on Thursday, 8 October 1959. It marked a third consecutive victory for the ruling Conservative Party, now led by Prime Minister Harold Macmillan. For the second time in a row, the Conservatives increased their overall majority in Parliament, this time to a landslide majority of 100 seats, having gained 20 seats for a return of 365. The Labour Party, led by Hugh Gaitskell, lost 19 seats and returned 258. The Liberal Party, led by Jo Grimond, again returned only six MPs to the House of Commons, but managed to increase its overall share of the vote to 5.9%, compared to just 2.7% four years earlier.

<span class="mw-page-title-main">Fermanagh and South Tyrone (UK Parliament constituency)</span>

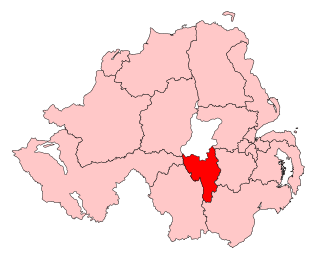
Fermanagh and South Tyrone is a parliamentary constituency in the British House of Commons. The current MP is Michelle Gildernew of Sinn Féin.

<span class="mw-page-title-main">Belfast North (UK Parliament constituency)</span> Parliamentary constituency in the United Kingdom, 1885–1918 and since 1922

Belfast North is a parliamentary constituency in the United Kingdom House of Commons. The current MP is John Finucane of Sinn Féin.

<span class="mw-page-title-main">Belfast South (UK Parliament constituency)</span> Parliamentary constituency in the United Kingdom, 1885–1918 and since 1922

Belfast South is a parliamentary constituency in the United Kingdom House of Commons. The current MP is Claire Hanna of the SDLP.

<span class="mw-page-title-main">South Down (UK Parliament constituency)</span> Parliamentary constituency in the United Kingdom, 1950 onwards

South Down is a parliamentary constituency in the United Kingdom House of Commons. The current MP for the constituency is Chris Hazzard of Sinn Féin.

<span class="mw-page-title-main">Upper Bann (UK Parliament constituency)</span> Parliamentary constituency in the United Kingdom, 1983 onwards

Upper Bann is a parliamentary constituency in Northern Ireland, which is represented in the United Kingdom House of Commons. The current MP is Carla Lockhart of the DUP.

<span class="mw-page-title-main">North Down (UK Parliament constituency)</span> Parliamentary constituency in the United Kingdom, 1950 onwards

North Down is a parliamentary constituency in the United Kingdom House of Commons. The current MP is Stephen Farry of the Alliance Party. Farry was elected to the position in the 2019 general election, replacing the incumbent Sylvia Hermon. Hermon had held the position since being elected to it in the 2001 general election, but chose not to contest in 2019.

<span class="mw-page-title-main">Bristol East (UK Parliament constituency)</span> Parliamentary constituency in the United Kingdom, 1983 onwards

Bristol East is a constituency recreated in 1983 covering the eastern part of the City of Bristol, represented in the House of Commons of the UK Parliament since 2005 by Kerry McCarthy of the Labour Party.

<span class="mw-page-title-main">Dartford (UK Parliament constituency)</span> UK Parliament constituency since 1885

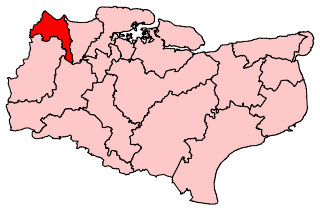
Dartford is a constituency in Kent represented in the House of Commons of the UK Parliament since 2010 by Gareth Johnson of the Conservative Party. It is the longest bellwether constituency in the country: the party of the winning candidate has gone on to form the government at every UK general election since 1964. Candidates for the largest two parties nationally have polled first and second since 1923 in Dartford.

<span class="mw-page-title-main">2005 United Kingdom general election</span>

The 2005 United Kingdom general election was held on Thursday 5 May 2005, to elect 646 members to the House of Commons. The governing Labour Party, led by Tony Blair, won its third consecutive victory, with Blair becoming the second Labour leader after Harold Wilson to form three majority governments. However, its majority fell to 66 seats; the majority it won four years earlier had been of 167 seats. This was the first time the Labour Party had won a third consecutive election, and remains the party's most recent general election victory.

Parliamentary by-elections in the United Kingdom occur when a Member of Parliament (MP) vacates a House of Commons seat during the course of a parliament.

In the United Kingdom, general elections occur at least every five years. About 650 constituencies return a member of Parliament. Prior to 1945, electoral competition in the United Kingdom exhibited features which make meaningful comparisons with modern results difficult. Hence, unless otherwise stated, records are based on results since the 1945 general election, and earlier exceptional results are listed separately.

<span class="mw-page-title-main">1979 vote of no confidence in the Callaghan ministry</span> 1979 political event in the UK

A vote of no confidence in the British Labour government, 1974–1979, of James Callaghan occurred on 28 March 1979. The vote was brought by the Official Opposition leader Margaret Thatcher and was lost by the Labour government by one vote, which was announced at 10:19 pm. The result mandated a general election that was won by Thatcher's Conservative Party. The last time an election had been forced by the UK House of Commons was in 1924, when Ramsay MacDonald, the first Labour prime minister, lost a vote of confidence. Labour politician Roy Hattersley later remarked that the vote marked "the last rites" of Old Labour. Labour did not return to government for another 18 years, with New Labour ideology. The BBC has referred to the vote as "one of the most dramatic nights in Westminster history".

References

  1. "Dartford :: UK General Election 1950". Archived from the original on 22 July 2021. Retrieved 22 July 2021.
  2. "Dartford :: UK General Election 1951". Archived from the original on 22 July 2021. Retrieved 22 July 2021.
  3. "Election Data 1983". Electoral Calculus. Archived from the original on 15 October 2011. Retrieved 28 June 2017.
  4. "Election Data 1987". Electoral Calculus. Archived from the original on 15 October 2011. Retrieved 28 June 2017.
  5. "1990: Thatcher fails to win party mandate". On This Day. BBC News. Retrieved 13 July 2011.