Finchley | |
---|---|
Former Borough constituency for the House of Commons | |
County | 1918–1965 Middlesex 1965–1997 Greater London |
1950–1997 | |
Seats | One |
Replaced by | Finchley & Golders Green (newly created seat) Chipping Barnet (in part) |
1918–1950 | |
Seats | One |
Type of constituency | County constituency |
Created from | Hornsey (bulk of seat formed former western part of) Enfield (as to the Friern Barnet part) |
Finchley was a constituency represented in the House of Commons of the Parliament of the United Kingdom. It elected one Member of Parliament (MP) by first-past-the-post voting; its longest-serving and best-known MP was Margaret Thatcher, Prime Minister from 1979 to 1990. Although boundary changes meant that she never again attained the large majority by which she won in 1959, her constituents nonetheless returned her by comfortable (9,000) majorities at general elections throughout her premiership.
The seat was abolished in 1997 and split between the Finchley and Golders Green and Chipping Barnet constituencies.
In 1918 the constituency was created as a county division of Middlesex, centred on the town of Finchley, which before 1918 had been located in the Hornsey constituency. In 1934 the Finchley district became a Municipal Borough.
In 1945 there was an interim redistribution of parliamentary constituencies to split those with more than 100,000 electors, prior to the general redistribution of 1950. Middlesex was significantly affected by the interim changes.
In 1950 the seat was re-classified as a borough constituency, with the boundaries reverting to those of 1918.
In 1965 the area of the constituency changed counties from Middlesex to London. Specifically its areas joined with others to form the London Borough of Barnet of Greater London.
Event | Member | Party | ||
---|---|---|---|---|
1918 | John Newman | Unionist | ||
1923 | Atholl Robertson | Liberal | ||
1924 | Edward Cadogan | Unionist | ||
1935 | John Crowder | Conservative | ||
1959 | Margaret Thatcher | |||
1992 | Hartley Booth | |||
1997 | constituency abolished |
Party | Candidate | Votes | % | ±% | |
---|---|---|---|---|---|
C | Unionist | John Pretyman Newman | 11,849 | 68.9 | |
Labour | John Leslie | 3,140 | 18.2 | ||
Liberal | Walter Edwin Martin | 2,221 | 12.9 | ||
Majority | 8,709 | 50.7 | |||
Turnout | 17,210 | 59.7 | |||
Registered electors | 28,848 | ||||
Unionist win (new seat) | |||||
Cindicates candidate endorsed by the coalition government. |
Party | Candidate | Votes | % | ±% | |
---|---|---|---|---|---|
Unionist | John Pretyman Newman | 11,883 | 53.2 | −15.7 | |
Liberal | T. Atholl Robertson | 10,440 | 46.8 | +33.9 | |
Majority | 1,443 | 6.4 | −44.3 | ||
Turnout | 22,323 | 72.4 | +12.7 | ||
Registered electors | 30,843 | ||||
Unionist hold | Swing | −24.8 | |||
Party | Candidate | Votes | % | ±% | |
---|---|---|---|---|---|
Liberal | T. Atholl Robertson | 13,159 | 54.7 | +7.9 | |
Unionist | John Pretyman Newman | 10,883 | 45.3 | −7.9 | |
Majority | 2,276 | 9.4 | N/A | ||
Turnout | 24,042 | 76.0 | +3.6 | ||
Registered electors | 31,650 | ||||
Liberal gain from Unionist | Swing | +7.9 | |||
Party | Candidate | Votes | % | ±% | |
---|---|---|---|---|---|
Unionist | Edward Cadogan | 15,277 | 58.3 | +13.0 | |
Liberal | T. Atholl Robertson | 10,942 | 41.7 | −13.0 | |
Majority | 4,335 | 16.6 | N/A | ||
Turnout | 26,219 | 79.5 | +3.5 | ||
Registered electors | 32,984 | ||||
Unionist gain from Liberal | Swing | +13.0 | |||
Party | Candidate | Votes | % | ±% | |
---|---|---|---|---|---|
Unionist | Edward Cadogan | 18,920 | 48.8 | −9.5 | |
Liberal | T. Atholl Robertson | 14,065 | 36.2 | −5.5 | |
Labour | J. George Stone | 5,824 | 15.0 | New | |
Majority | 4,855 | 12.6 | −4.0 | ||
Turnout | 38,809 | 77.2 | −2.3 | ||
Registered electors | 50,243 | ||||
Unionist hold | Swing | −2.0 | |||
Party | Candidate | Votes | % | ±% | |
---|---|---|---|---|---|
Conservative | Edward Cadogan | 34,286 | 84.2 | +35.4 | |
Labour | J. George Stone | 6,440 | 15.8 | +0.8 | |
Majority | 27,846 | 68.4 | +55.8 | ||
Turnout | 40,726 | 74.3 | ―2.9 | ||
Conservative hold | Swing | +17.3 | |||
Liberal candidate Lady Domini Crosfield withdrew following the formation of the National Government.
Party | Candidate | Votes | % | ±% | |
---|---|---|---|---|---|
Conservative | John Crowder | 26,960 | 63.6 | ―20.6 | |
Liberal | T. Atholl Robertson | 8,920 | 21.0 | New | |
Labour | Cyril G Lacey | 6,533 | 15.4 | ―0.4 | |
Majority | 18,040 | 42.6 | ―31.8 | ||
Turnout | 42,413 | 70.2 | ―4.1 | ||
Conservative hold | Swing | N/A | |||
General Election 1939–40 Another General Election was required to take place before the end of 1940, but it was postponed after the outbreak of World War II. The political parties had been making preparations for an election to take place from 1939, and by the end of that year the following candidates had been selected:
Party | Candidate | Votes | % | ±% | |
---|---|---|---|---|---|
Conservative | John Crowder | 24,256 | 48.5 | ―15.1 | |
Labour | Cyril G Lacey | 18,611 | 37.2 | +21.8 | |
Liberal | David Goldblatt | 7,164 | 14.3 | ―6.7 | |
Majority | 5,645 | 11.28 | ―31.3 | ||
Turnout | 50,031 | 74.2 | +4.0 | ||
Conservative hold | Swing | +18.4 | |||
Party | Candidate | Votes | % | ±% | |
---|---|---|---|---|---|
Conservative | John Crowder | 32,262 | 52.9 | +4.4 | |
Labour | Dorothy Pickles | 19,683 | 32.3 | ―5.0 | |
Liberal | Andrew McFadyean | 9,094 | 14.9 | +0.6 | |
Majority | 12,579 | 20.6 | +9.3 | ||
Turnout | 60,999 | 84.9 | +10.7 | ||
Conservative hold | Swing | +4.2 | |||
Party | Candidate | Votes | % | ±% | |
---|---|---|---|---|---|
Conservative | John Crowder | 33,308 | 54.9 | +2.0 | |
Labour | Jack Ashley | 20,520 | 33.8 | +1.6 | |
Liberal | Walter John Done | 6,853 | 11.3 | ―3.6 | |
Majority | 12,788 | 21.1 | +0.5 | ||
Turnout | 60,411 | 84.0 | ―0.9 | ||
Conservative hold | Swing | +0.3 | |||
Party | Candidate | Votes | % | ±% | |
---|---|---|---|---|---|
Conservative | John Crowder | 30,233 | 54.5 | ―0.4 | |
Labour | Terence Lancaster | 17,408 | 31.4 | ―2.4 | |
Liberal | Manuela Sykes | 7,775 | 14.0 | +2.7 | |
Majority | 12,825 | 23.1 | +2.0 | ||
Turnout | 55,416 | 78.3 | ―5.7 | ||
Conservative hold | Swing | ―1.0 | |||
Party | Candidate | Votes | % | ±% | |
---|---|---|---|---|---|
Conservative | Margaret Thatcher | 29,697 | 53.2 | ―1.3 | |
Labour | Eric Deakins | 13,437 | 24.1 | ―7.3 | |
Liberal | Henry Ivan Spence | 12,701 | 22.7 | +8.7 | |
Majority | 16,260 | 29.1 | +6.0 | ||
Turnout | 55,835 | 80.8 | +2.5 | ||
Conservative hold | Swing | +3.0 | |||
Party | Candidate | Votes | % | ±% | |
---|---|---|---|---|---|
Conservative | Margaret Thatcher | 24,591 | 46.6 | ―6.6 | |
Liberal | John Pardoe | 15,789 | 29.9 | +7.2 | |
Labour | Albert Edward Tomlinson | 12,408 | 23.5 | ―0.6 | |
Majority | 8,802 | 16.7 | ―12.4 | ||
Turnout | 52,788 | 78.2 | ―2.6 | ||
Conservative hold | Swing | ||||
Party | Candidate | Votes | % | ±% | |
---|---|---|---|---|---|
Conservative | Margaret Thatcher | 23,968 | 46.5 | ―0.1 | |
Labour | Yvonne Sieve | 14,504 | 28.1 | +4.6 | |
Liberal | Frank Davis | 13,070 | 25.4 | ― 4.5 | |
Majority | 9,464 | 18.4 | +1.7 | ||
Turnout | 51,542 | 75.3 | ―2.9 | ||
Conservative hold | Swing | ―2.4 | |||
Party | Candidate | Votes | % | ±% | |
---|---|---|---|---|---|
Conservative | Margaret Thatcher | 25,480 | 53.8 | +7.3 | |
Labour | Michael Freeman | 14,295 | 30.2 | +2.1 | |
Liberal | Graham Mitchell | 7,614 | 16.1 | ―9.3 | |
Majority | 11,185 | 23.6 | +5.2 | ||
Turnout | 47,389 | 65.6 | ―9.7 | ||
Conservative hold | Swing | +2.6 | |||
Party | Candidate | Votes | % | ±% | |
---|---|---|---|---|---|
Conservative | Margaret Thatcher | 18,180 | 43.7 | ―8.6 | |
Labour | Martin O'Connor | 12,202 | 29.3 | ―2.3 | |
Liberal | Laurence Brass | 11,221 | 27.0 | +10.9 | |
Majority | 5,978 | 14.4 | |||
Turnout | 41,603 | 78.0 | |||
Conservative hold | Swing | ―3.1 | |||
Party | Candidate | Votes | % | ±% | |
---|---|---|---|---|---|
Conservative | Margaret Thatcher | 16,498 | 44.0 | +0.3 | |
Labour | Martin O'Connor | 12,587 | 33.6 | +4.3 | |
Liberal | Laurence Brass | 7,384 | 19.7 | ―7.3 | |
National Front | Janet Godfrey | 993 | 2.7 | New | |
Majority | 3,911 | 10.4 | ―4.0 | ||
Turnout | 37,462 | 69.5 | ―8.5 | ||
Conservative hold | Swing | ―2.0 | |||
Party | Candidate | Votes | % | ±% | |
---|---|---|---|---|---|
Conservative | Margaret Thatcher | 20,918 | 52.5 | +8.5 | |
Labour | Richard May | 13,040 | 32.7 | ―0.9 | |
Liberal | Anthony Paterson | 5,254 | 13.2 | ―6.5 | |
National Front | William Verity | 534 | 1.3 | ―1.4 | |
Independent Democrat | Elizabeth Lloyd | 86 | 0.2 | New | |
Majority | 7,878 | 19.8 | +9.4 | ||
Turnout | 39,832 | 72.5 | +3.0 | ||
Conservative hold | Swing | +4.7 | |||
Party | Candidate | Votes | % | ±% | |
---|---|---|---|---|---|
Conservative | Margaret Thatcher | 19,616 | 51.1 | ―1.4 | |
Labour | Laurence Spigel | 10,302 | 26.8 | ―5.9 | |
Liberal | Margaret Joachim | 7,763 | 20.2 | +7.0 | |
Ecology | Simone Wilkinson | 279 | 0.7 | New | |
Monster Raving Loony | Screaming Lord Sutch | 235 | 0.6 | New | |
Ban Every Licensing Law Society | Anthony Noonan | 75 | 0.2 | New | |
Rail Not Motorway | Helen Anscomb | 42 | 0.1 | New | |
Law and Order in Gotham City | Anthony Whitehead | 37 | 0.1 | New | |
Anti-Censorship | David Webb | 28 | 0.1 | New | |
Party of Associates with Licensees | Brian Wareham | 27 | 0.1 | New | |
Belgrano Blood-Hunger | Benjamin Wedmore | 13 | 0.0 | New | |
Majority | 9,314 | 24.3 | +4.5 | ||
Turnout | 38,417 | 69.0 | ―3.5 | ||
Conservative hold | Swing | +2.2 | |||
Party | Candidate | Votes | % | ±% | |
---|---|---|---|---|---|
Conservative | Margaret Thatcher | 21,603 | 53.9 | +2.8 | |
Labour | John Davies | 12,690 | 31.7 | +4.9 | |
Liberal | David Howarth | 5,580 | 13.9 | ―7.3 | |
Gremloid Party | Lord Buckethead | 131 | 0.3 | New | |
Gold Party | Michaelle St Vincent | 59 | 0.2 | New | |
Majority | 8,913 | 22.2 | ―2.1 | ||
Turnout | 40,063 | 69.4 | +0.4 | ||
Conservative hold | Swing | ―1.0 | |||
Party | Candidate | Votes | % | ±% | |
---|---|---|---|---|---|
Conservative | Hartley Booth | 21,039 | 51.2 | ―2.7 | |
Labour | Ann Marjoram | 14,651 | 35.7 | +4.0 | |
Liberal Democrats | Hilary Leighter | 4,568 | 11.1 | ―2.8 | |
Green | Ashley Gunstock | 564 | 1.4 | New | |
Monster Raving Loony | Sally Johnson | 130 | 0.3 | New | |
Natural Law | James Macrae | 129 | 0.3 | New | |
Majority | 6,388 | 15.5 | ―6.7 | ||
Turnout | 41,081 | 77.6 | +8.2 | ||
Conservative hold | Swing | ―3.3 | |||
Chipping Barnet is a constituency created in 1974 and represented in the House of Commons of the UK Parliament since 2005 by Theresa Villiers of the Conservative Party. It is part of the London Borough of Barnet, on the border with Hertfordshire.
Romford is a constituency in Greater London represented in the House of Commons of the UK Parliament since 2001 by Andrew Rosindell, a Conservative.
Spelthorne is a constituency in Surrey represented in the House of Commons of the UK Parliament since 2010 by Kwasi Kwarteng, a Conservative, who served as Chancellor of the Exchequer for 38 days in September and October 2022.
St Albans is a constituency represented in the House of Commons of the UK Parliament since 2019 by Daisy Cooper, a Liberal Democrat.
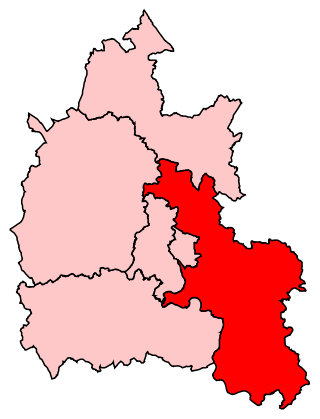
Henley is a constituency in Oxfordshire represented in the House of Commons of the UK Parliament since 2008 by John Howell, a Member of Parliament from the Conservative Party.
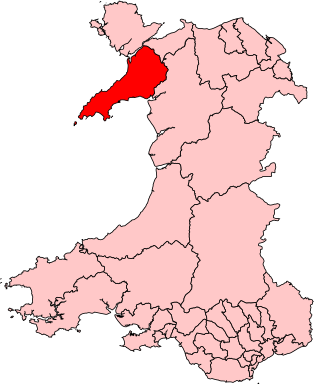
Caernarfon was a parliamentary constituency centred on the town of Caernarfon in Wales. It elected one Member of Parliament (MP) by the first past the post system.
Llanelli is a constituency of the House of Commons of the Parliament of the United Kingdom. From 1918 to 1970 the official spelling of the constituency name was Llanelly. It elects one Member of Parliament (MP) by the first past the post system of election. Since 2005, it is currently represented by Nia Griffith of the Labour Party.
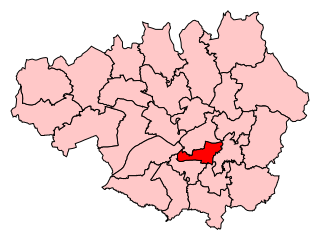
Manchester Gorton is a constituency represented in the House of Commons of the UK Parliament by Labour's Afzal Khan, who was elected at the 2017 general election. It is the safest Labour seat in Greater Manchester by numerical majority and one of the safest in the country.
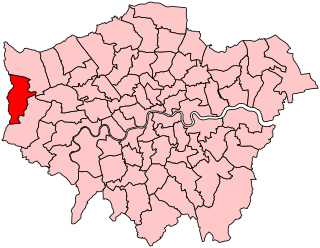
Uxbridge was a seat returning one Member of Parliament (MP) of the House of Commons of the UK Parliament from 1885 to 2010. Its MPs elected were: Conservative Party candidates for 107 years and Labour Party candidates for 18 years. The closing 40 years of the seat's history saw Conservative victory — in 1997 on a very marginal majority in relative terms.
Hornsey and Wood Green is a constituency in Greater London created in 1983 and represented in the House of Commons of the UK Parliament since 2015 by Catherine West, of the Labour Party. To date it has drawn together for general elections parts of the London Borough of Haringey.
Edmonton is a constituency in Greater London, created in 1918 and represented in the House of Commons of the UK Parliament since 2015 by Kate Osamor, who was elected for the Labour Co-operative party but has since lost the Labour whip. Edmonton is a North London constituency based around district of Edmonton in the London Borough of Enfield.
Finchley and Golders Green is a constituency created in 1997 represented in the House of Commons of the UK Parliament. Mike Freer of the Conservative Party was first elected for the seat in 2010, and in January 2024 he announced that he would not stand at the forthcoming general election.
Hendon is a constituency in Greater London represented in the House of Commons of the UK Parliament since 2010 by Matthew Offord of the Conservative Party, who announced in May 2023 that he would stand down at the next general election. It was created for the 1997 general election; an earlier version of the seat existed between 1918 and 1945.
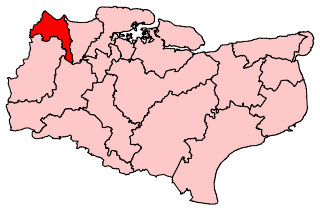
Dartford is a constituency in Kent represented in the House of Commons of the UK Parliament since 2010 by Gareth Johnson of the Conservative Party. It is the longest bellwether constituency in the country: the party of the winning candidate has gone on to form the government at every UK general election since 1964. Candidates for the largest two parties nationally have polled first and second since 1923 in Dartford.
Chelsea was a borough constituency, represented in the House of Commons of the Parliament of the United Kingdom.
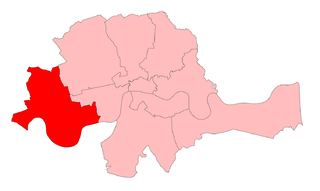
Dulwich was a borough constituency in the Dulwich area of South London, which returned one Member of Parliament (MP) to the House of Commons of the Parliament of the United Kingdom.
Hornsey was a constituency that returned one Member of Parliament (MP) to the House of Commons of the UK Parliament, 1885 — 1983. It was then largely replaced by Hornsey & Wood Green. Its voters using the first-past-the-post system elected the Conservative Party candidate at each election. Its closest result was a 1.29% majority at the 1966 election which saw the start of the Second Wilson Ministry. From 1945 onwards the runners-up in the seat were the Labour Party candidates.
Brentford and Chiswick was a constituency 1918 – 1974 centred on the Brentford and Chiswick districts of Middlesex which became parts of west London in 1965. It returned one member (MP) to the House of Commons of the UK Parliament.
Enfield was a constituency for the House of Commons of the UK Parliament from 1885 until 1950. The area sloping to the River Lea in the east was in the far north of Middlesex centred on the town of Enfield. The area formed part of the London conurbation and was much reduced over the course of its existence, in 1918 and then insignificantly in 1945 due to suburbanisation and urbanisation. It returned one Member of Parliament (MP).
Finsbury Central was a parliamentary constituency that covered the Clerkenwell district of Central London. It returned one Member of Parliament (MP) to the House of Commons of the Parliament of the United Kingdom, elected by the first past the post system.