Edmonton | |
---|---|
Borough constituency for the House of Commons | |
County | Greater London |
Electorate | 64,356 (December 2010) [1] |
Major settlements | Bush Hill Park, Edmonton and Ponders End |
Current constituency | |
Created | 1918 |
Member of Parliament | Kate Osamor (Labour) |
Seats | One |
Created from | Enfield |
Edmonton is a constituency [n 1] in Greater London, created in 1918 and represented in the House of Commons of the UK Parliament since 2015 by Kate Osamor, who was elected for the Labour Co-operative party; she briefly lost the Labour whip between January and May 2024. [2] [n 2] Edmonton is a North London constituency based around district of Edmonton in the London Borough of Enfield.
Further to the completion of the 2023 Periodic Review of Westminster constituencies, the seat will be subject to boundary changes which will incorporate the areas of Winchmore Hill and Grange Park from the abolished constituency of Enfield Southgate, offset by the transfer of Ponders End back to Enfield North. As a consequence, it will be renamed Edmonton and Winchmore Hill , to be first contested at the next general election. [3]
The seat dates back to 1918 at which time it was at an extremity of the largely urbanised London postal district outside of the County of London (1889–1965). It was a railway commuter town core outweighed by businesses beside the River Lea engaged in manufacturing, storage, distribution, and construction industries, among others. [4] Population and housing were significantly less before the middle of the 19th century. [5]
The seat was won by successive Labour party candidates since 1935 until narrowly gained by a Conservative at the 1983 United Kingdom general election. The latter's majority increased in 1987 then reduced to a marginal majority in 1992. After 1997 a trend of increased Labour majorities developed. Osamor's majority of 2015, 37.3%, made it the 43rd-safest Labour seat in ranking in 2015. [6] Likewise, save for a Conservative-leaning ward, Bush Hill Park, Edmonton's other wards usually elect Labour Party councillors since 1997.[ citation needed ]
1918–1950: The Urban District of Edmonton.
1950–1974: The Municipal Borough of Edmonton.
1974–1983: The London Borough of Enfield wards of Angel Road, Bush Hill South, Church Street, Craig Park, Jubilee, New Park, Pymmes, St Alphege, St Peter's, and Silver Street.
1983–2010: The London Borough of Enfield wards of Angel Road, Craig Park, Huxley, Jubilee, Latymer, Raglan, St Alphege, St Mark's, St Peter's, Village, and Weir Hall.
2010–present: The London Borough of Enfield wards of Bush Hill Park, Edmonton Green, Haselbury, Jubilee, Lower Edmonton, Ponders End, and Upper Edmonton.
Following its review of parliamentary representation in North London, the Boundary Commission for England made some changes to Edmonton. Ponders End ward was transferred from the constituency of Enfield North to Edmonton. Part of Southbury ward was transferred to Enfield North. Parts of Grange ward, Palmers Green ward, and Bowes ward were transferred from Edmonton to Enfield, Southgate. Part of Bush Hill Park ward and a tiny part of Upper Edmonton ward were transferred from Enfield, Southgate to Edmonton.
Party | Candidate | Votes | % | ±% | |
---|---|---|---|---|---|
Labour Co-op | Kate Osamor | 26,217 | 65.0 | -6.5 | |
Conservative | James Hockney | 10,202 | 25.3 | +2.2 | |
Liberal Democrats | David Schmitz | 2,145 | 5.3 | +3.3 | |
Green | Benjamin Maydon | 862 | 2.1 | +0.7 | |
Brexit Party | Sauchin Sehgal | 840 | 2.1 | New | |
Independent | Sabriye Warsame | 75 | 0.2 | New | |
Majority | 16,015 | 39.7 | -8.7 | ||
Turnout | 40,341 | 61.5 | -4.9 | ||
Registered electors | 65,568 | ||||
Labour Co-op hold | Swing | -4.3 | |||
Party | Candidate | Votes | % | ±% | |
---|---|---|---|---|---|
Labour Co-op | Kate Osamor | 31,221 | 71.5 | +10.1 | |
Conservative | Gonul Daniels | 10,106 | 23.1 | -1.0 | |
UKIP | Nigel Sussman | 860 | 2.0 | -6.1 | |
Liberal Democrats | David Schmitz | 858 | 2.0 | -0.2 | |
Green | Benjamin Gill | 633 | 1.4 | -1.9 | |
Majority | 21,115 | 48.4 | +11.1 | ||
Turnout | 43,676 | 66.4 | +3.8 | ||
Registered electors | 65,777 | ||||
Labour Co-op hold | Swing | +5.5 | |||
Party | Candidate | Votes | % | ±% | |
---|---|---|---|---|---|
Labour Co-op | Kate Osamor | 25,388 | 61.4 | +7.7 | |
Conservative | Gonul Daniels | 9,969 | 24.1 | -5.7 | |
UKIP | Neville Watson | 3,366 | 8.1 | +5.5 | |
Green | Douglas Coker | 1,358 | 3.3 | +2.0 | |
Liberal Democrats | David Schmitz | 897 | 2.2 | -8.3 | |
TUSC | Lewis Peacock | 360 | 0.9 | New | |
Majority | 15,419 | 37.3 | +13.4 | ||
Turnout | 41,338 | 62.6 | -0.6 | ||
Registered electors | 66,016 | ||||
Labour Co-op hold | Swing | +7.7 | |||
Party | Candidate | Votes | % | ±% | |
---|---|---|---|---|---|
Labour Co-op | Andy Love | 21,665 | 53.7 | −2.3 | |
Conservative | Andrew Charalambous | 12,052 | 29.8 | +2.3 | |
Liberal Democrats | Iarla Kilbane-Dawe | 4,252 | 10.5 | −1.5 | |
UKIP | Roy Freshwater | 1,036 | 2.6 | +0.3 | |
Green | Jack Johnson | 516 | 1.3 | −1.0 | |
Reform 2000 | Erol Basarik | 379 | 0.9 | New | |
Christian | Clive Morrison | 350 | 0.9 | New | |
Independent | David McLean | 127 | 0.3 | New | |
Majority | 9,613 | 23.9 | -4.6 | ||
Turnout | 40,377 | 63.2 | +5.7 | ||
Registered electors | 63,904 | ||||
Labour Co-op hold | Swing | −2.3 | |||
Party | Candidate | Votes | % | ±% | |
---|---|---|---|---|---|
Labour Co-op | Andy Love | 18,456 | 53.2 | −5.7 | |
Conservative | Lionel Zetter | 10,381 | 29.9 | −0.9 | |
Liberal Democrats | Iarla Kilbane-Dawe | 4,162 | 12.0 | +5.0 | |
Green | Nina Armstrong | 889 | 2.6 | New | |
UKIP | Gwyneth Rolph | 815 | 2.3 | +1.1 | |
Majority | 8,075 | 23.3 | -4.8 | ||
Turnout | 34,703 | 59.1 | +2.8 | ||
Registered electors | 59,050 | ||||
Labour Co-op hold | Swing | −2.4 | |||
Party | Candidate | Votes | % | ±% | |
---|---|---|---|---|---|
Labour Co-op | Andy Love | 20,481 | 58.9 | −1.4 | |
Conservative | David Burrowes | 10,709 | 30.8 | +0.6 | |
Liberal Democrats | Douglas Taylor | 2,438 | 7.0 | +0.7 | |
UKIP | Gwyneth Rolph | 406 | 1.2 | +0.6 | |
Reform 2000 | Erol Basarik | 344 | 1.0 | New | |
Socialist Alliance | Howard Medwell | 296 | 0.9 | New | |
Independent | Ram Saxena | 100 | 0.3 | New | |
Majority | 9,772 | 28.1 | -2.0 | ||
Turnout | 34,774 | 56.3 | −14.0 | ||
Registered electors | 61,788 | ||||
Labour Co-op hold | Swing | −1.0 | |||
Party | Candidate | Votes | % | ±% | |
---|---|---|---|---|---|
Labour Co-op | Andy Love | 27,029 | 60.3 | +15.2 | |
Conservative | Ian Twinn | 13,557 | 30.2 | -16.0 | |
Liberal Democrats | Andrew Wiseman | 2,847 | 6.3 | -1.9 | |
Referendum | James Wright | 708 | 1.6 | New | |
BNP | Bruce Cowd | 437 | 1.0 | New | |
UKIP | Penelope Weald | 260 | 0.6 | New | |
Majority | 13,472 | 30.1 | N/A | ||
Turnout | 44,838 | 70.3 | -5.4 | ||
Registered electors | 63,793 | ||||
Labour Co-op gain from Conservative | Swing | +15.6 | |||
Party | Candidate | Votes | % | ±% | |
---|---|---|---|---|---|
Conservative | Ian Twinn | 22,076 | 46.3 | -4.9 | |
Labour Co-op | Andy Love | 21,483 | 45.0 | +9.0 | |
Liberal Democrats | Elwyn V. Jones | 3,940 | 8.3 | -4.5 | |
Natural Law | Elizabeth Solley | 207 | 0.4 | New | |
Majority | 593 | 1.3 | -13.7 | ||
Turnout | 47,706 | 75.6 | +3.1 | ||
Registered electors | 63,052 | ||||
Conservative hold | Swing | -7.0 | |||
Party | Candidate | Votes | % | ±% | |
---|---|---|---|---|---|
Conservative | Ian Twinn | 24,556 | 51.2 | +8.7 | |
Labour | Brian Grayston | 17,270 | 36.0 | -3.8 | |
SDP | Michael Lawson | 6,115 | 12.8 | -4.0 | |
Majority | 7,286 | 15.2 | +12.5 | ||
Turnout | 47,941 | 72.5 | +3.6 | ||
Registered electors | 66,080 | ||||
Conservative hold | Swing | +6.2 | |||
Party | Candidate | Votes | % | ±% | |
---|---|---|---|---|---|
Conservative | Ian Twinn | 18,968 | 42.5 | -0.1 | |
Labour Co-op | Ted Graham | 17,775 | 39.8 | -7.3 | |
Liberal | Laurence Brass | 7,523 | 16.9 | +9.4 | |
BNP | David J. Bruce | 372 | 0.8 | -2.0 | |
Majority | 1,193 | 2.7 | N/A | ||
Turnout | 44,638 | 68.9 | -5.7 | ||
Registered electors | 64,809 | ||||
Conservative gain from Labour Co-op | Swing | +3.6 | |||
Party | Candidate | Votes | % | ±% | |
---|---|---|---|---|---|
Labour Co-op | Ted Graham | 20,713 | 47.14 | -1.93 | |
Conservative | John Attwood [19] | 18,733 | 42.64 | +10.13 | |
Liberal | William Wintle [19] | 3,726 | 7.46 | -6.36 | |
National Front | David J. Bruce [19] | 1,213 | 2.76 | -1.84 | |
Majority | 1,980 | 4.50 | -12.06 | ||
Turnout | 44,385 | 74.64 | +7.58 | ||
Registered electors | 58,860 | ||||
Labour Co-op hold | Swing | ||||
Party | Candidate | Votes | % | ±% | |
---|---|---|---|---|---|
Labour Co-op | Ted Graham | 20,229 | 49.07 | +3.77 | |
Conservative | J. Attwood | 13,401 | 32.51 | -0.35 | |
Liberal | J. Dawnay | 5,699 | 13.82 | -3.98 | |
National Front | D.J. Bruce | 1,895 | 4.60 | +0.76 | |
Majority | 6,828 | 16.56 | +4.12 | ||
Turnout | 41,224 | 67.06 | -8.37 | ||
Registered electors | 61,476 | ||||
Labour Co-op hold | Swing | ||||
Party | Candidate | Votes | % | ±% | |
---|---|---|---|---|---|
Labour Co-op | Ted Graham | 20,837 | 45.30 | -3.76 | |
Conservative | J. Gordon | 15,114 | 32.86 | -11.10 | |
Liberal | P. Greenwood | 8,186 | 17.80 | +10.81 | |
National Front | David J. Bruce | 1,765 | 3.84 | New | |
Independent | L.R. Pittard | 98 | 0.21 | New | |
Majority | 5,723 | 12.44 | +7.34 | ||
Turnout | 46,000 | 75.43 | +8.99 | ||
Registered electors | 60,985 | ||||
Labour Co-op hold | Swing | ||||
Party | Candidate | Votes | % | ±% | |
---|---|---|---|---|---|
Labour | Austen Albu | 20,626 | 49.06 | -9.50 | |
Conservative | Edwin P. Hubbard | 18,481 | 43.96 | +2.52 | |
Liberal | Graham Longley | 2,937 | 6.99 | New | |
Majority | 2,145 | 5.10 | -12.02 | ||
Turnout | 42,044 | 66.44 | +5.73 | ||
Registered electors | 63,277 | ||||
Labour hold | Swing | ||||
Party | Candidate | Votes | % | ±% | |
---|---|---|---|---|---|
Labour | Austen Albu | 26,422 | 58.56 | +9.36 | |
Conservative | Edwin P. Hubbard | 18,697 | 41.44 | +2.59 | |
Majority | 7,725 | 17.12 | +6.77 | ||
Turnout | 45,109 | 72.17 | -4.81 | ||
Registered electors | 62,520 | ||||
Labour hold | Swing | ||||
Party | Candidate | Votes | % | ±% | |
---|---|---|---|---|---|
Labour | Austen Albu | 24,373 | 49.20 | -1.25 | |
Conservative | Ross McWhirter | 19,245 | 38.85 | -10.70 | |
Liberal | Denis Coberman | 5,917 | 11.95 | New | |
Majority | 5,128 | 10.35 | +9.45 | ||
Turnout | 49,535 | 76.98 | +1.13 | ||
Registered electors | 64,348 | ||||
Labour hold | Swing | ||||
Party | Candidate | Votes | % | ±% | |
---|---|---|---|---|---|
Labour | Austen Albu | 25,958 | 50.45 | -6.14 | |
Conservative | William H. Bishop | 25,497 | 49.55 | +6.14 | |
Majority | 461 | 0.90 | -12.28 | ||
Turnout | 51,095 | 75.85 | +1.38 | ||
Registered electors | 67,837 | ||||
Labour hold | Swing | ||||
Party | Candidate | Votes | % | ±% | |
---|---|---|---|---|---|
Labour | Austen Albu | 30,232 | 56.59 | -1.84 | |
Conservative | Elsie S. Olsen | 23,194 | 43.41 | +1.84 | |
Majority | 7,038 | 13.18 | -3.68 | ||
Turnout | 53,426 | 74.47 | -8.06 | ||
Registered electors | 71,739 | ||||
Labour hold | Swing | ||||
Party | Candidate | Votes | % | ±% | |
---|---|---|---|---|---|
Labour | Austen Albu | 36,023 | 58.43 | +3.36 | |
Conservative | Elsie S. Olsen | 25,631 | 41.57 | +4.67 | |
Majority | 10,392 | 16.86 | -1.38 | ||
Turnout | 61,654 | 82.53 | -1.97 | ||
Registered electors | 74,707 | ||||
Labour hold | Swing | ||||
Party | Candidate | Votes | % | ±% | |
---|---|---|---|---|---|
Labour | Austen Albu | 34,897 | 55.07 | -13.13 | |
Conservative | Edwin P. Hubbard | 23,325 | 36.81 | -2.19 | |
Liberal | George E. Thornton | 5,143 | 8.12 | New | |
Majority | 11,572 | 18.26 | -20.94 | ||
Turnout | 63,365 | 84.50 | +15.5 | ||
Registered electors | 74,988 | ||||
Labour hold | Swing | ||||
Party | Candidate | Votes | % | ±% | |
---|---|---|---|---|---|
Labour | Austen Albu | 26,164 | 53.4 | -14.8 | |
Conservative | Edwin P. Hubbard | 22,837 | 46.6 | +17.6 | |
Majority | 3,327 | 6.8 | -32.4 | ||
Turnout | 49,001 | 62.7 | -6.3 | ||
Registered electors | 78,204 | ||||
Labour hold | Swing | ||||
Party | Candidate | Votes | % | ±% | |
---|---|---|---|---|---|
Labour | Evan Durbin | 33,163 | 68.2 | +13.01 | |
Conservative | Geoffrey Sparrow | 14,094 | 29.0 | -15.81 | |
Independent Progressive | JA Ward | 1,382 | 2.8 | New | |
Majority | 19,069 | 39.2 | +28.82 | ||
Turnout | 48,639 | 69.0 | +4.51 | ||
Registered electors | 70,470 | ||||
Labour hold | Swing | ||||
Party | Candidate | Votes | % | ±% | |
---|---|---|---|---|---|
Labour Co-op | Frank Broad | 21,940 | 55.19 | +11.99 | |
Conservative | John Rutherford | 17,813 | 44.81 | -11.99 | |
Majority | 4,127 | 10.38 | N/A | ||
Turnout | 39,753 | 64.49 | -5.71 | ||
Registered electors | 61,640 | ||||
Labour Co-op gain from Conservative | Swing | ||||
Party | Candidate | Votes | % | ±% | |
---|---|---|---|---|---|
Conservative | John Chalmers | 18,774 | 56.8 | +16.1 | |
Labour Co-op | Frank Broad | 14,250 | 43.2 | −16.1 | |
Majority | 4,524 | 13.6 | N/A | ||
Turnout | 33,024 | 70.2 | +0.7 | ||
Registered electors | 47,044 | ||||
Conservative gain from Labour | Swing | +16.1 | |||
Party | Candidate | Votes | % | ±% | |
---|---|---|---|---|---|
Labour | Frank Broad | 17,555 | 59.3 | +6.2 | |
Unionist | George Jarrett | 12,044 | 40.7 | -6.2 | |
Majority | 5,511 | 18.6 | +12.4 | ||
Turnout | 29,599 | 69.5 | -1.1 | ||
Registered electors | 42,586 | ||||
Labour hold | Swing | +6.2 | |||
Party | Candidate | Votes | % | ±% | |
---|---|---|---|---|---|
Labour | Frank Broad | 11,614 | 53.1 | -11.3 | |
Unionist | George Jarrett | 10,278 | 46.9 | +11.3 | |
Majority | 1,336 | 6.2 | -22.6 | ||
Turnout | 21,892 | 70.6 | +15.8 | ||
Registered electors | 31,020 | ||||
Labour hold | Swing | -11.3 | |||
Party | Candidate | Votes | % | ±% | |
---|---|---|---|---|---|
Labour | Frank Broad | 10,735 | 64.4 | +19.3 | |
Unionist | Robert Skirving Brown | 5,943 | 35.6 | -0.4 | |
Majority | 4,792 | 28.8 | +19.7 | ||
Turnout | 16,678 | 54.8 | -8.0 | ||
Registered electors | 30,423 | ||||
Labour hold | Swing | +9.9 | |||
Party | Candidate | Votes | % | ±% | |
---|---|---|---|---|---|
Labour | Frank Broad | 8,407 | 45.1 | +19.4 | |
Unionist | Alfred Warren | 6,698 | 36.0 | -13.4 | |
Liberal | Edmund Thomas Rhymer | 3,522 | 18.9 | +3.8 | |
Majority | 1,709 | 9.1 | N/A | ||
Turnout | 18,627 | 62.8 | +14.6 | ||
Registered electors | 29,662 | ||||
Labour gain from Unionist | Swing | +16.4 | |||
Party | Candidate | Votes | % | ±% | |
---|---|---|---|---|---|
C | Unionist | Alfred Warren | 6,891 | 49.4 | |
Labour | Frank Broad | 3,575 | 25.7 | ||
Liberal | Henry Harvey Vivian | 2,245 | 16.1 | ||
Edmonton Pro-Ally & Labour | Henry Barrass | 1,223 | 8.8 | ||
Majority | 3,316 | 23.7 | |||
Turnout | 13,934 | 48.2 | |||
Registered electors | 28,930 | ||||
Unionist win (new seat) |
Winchmore Hill is a suburb and electoral ward in the Borough of Enfield, North London, in the N21 postal district. With the Winchmore Hill conservation area as a focal point, the district is bounded on the east by Green Lanes, Barrowell Green, Firs Lane and Fords Grove, and on the north-west by Grovelands Park; in the south it extends to part of Aldermans Hill, and in the north to Vicars Moor Lane and Houndsden Road. Winchmore Hill is 8.9 miles (14.3 km) north north-east of Charing Cross.
Reading East is a constituency represented in the House of Commons of the UK Parliament since 2017 by Matt Rodda, of the Labour Party. The seat is one of two Labour seats from a total of eight seats in Berkshire.
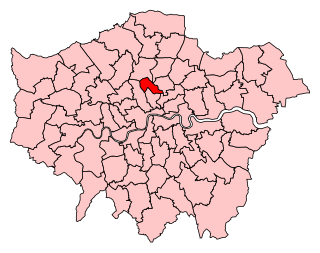
Islington North is a constituency in Greater London represented in the House of Commons of the UK Parliament since 1983 by Jeremy Corbyn, who was Leader of the Labour Party and Leader of the Opposition from 2015 to 2020.
Romford is a constituency in Greater London represented in the House of Commons of the UK Parliament since 2001 by Andrew Rosindell, a Conservative.
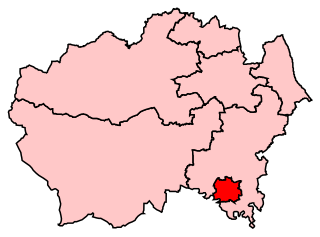
Liverpool, West Derby is a constituency represented in the House of Commons of the UK Parliament since 2019 by Ian Byrne of the Labour Party.
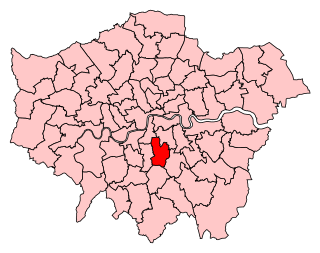
Battersea is a constituency in the London Borough of Wandsworth. It has been represented since 2017 by Marsha de Cordova of the Labour Party.
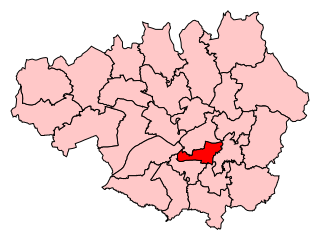
Manchester Gorton is a constituency represented in the House of Commons of the UK Parliament by Labour's Afzal Khan, who was elected at the 2017 general election. It is the safest Labour seat in Greater Manchester by numerical majority and one of the safest in the country.
Wimbledon is a constituency in Greater London represented in the House of Commons of the UK Parliament. Since 2005, the seat has been held by Stephen Hammond of the Conservative Party.
Middlesbrough is a parliamentary constituency in the United Kingdom, recreated in 1974, and represented since 2012 in the House of Commons of the UK Parliament by Andy McDonald from the Labour Party. An earlier version of the seat existed between 1868 and 1918.
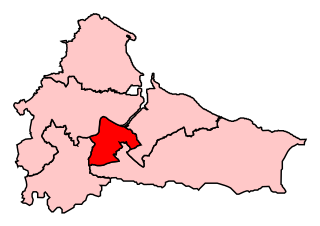
Darlington is the parliamentary constituency for the eponymous market town in County Durham in the North East of England. It is currently represented in the House of Commons of the UK Parliament by Peter Gibson of the Conservative Party, who was first elected in 2019.
Croydon Central is a constituency created in 1974 and is represented in the House of Commons of the UK Parliament since 2017 by Labour MP Sarah Jones. The seat bucked the trend in national results in 2019, with Labour holding the seat with a slightly increased majority.
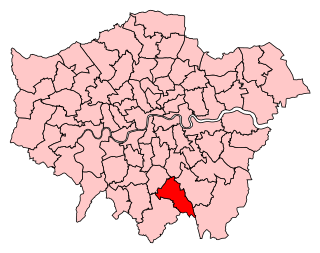
Dulwich and West Norwood is a constituency in South London created in 1997. It has been represented by Helen Hayes of Labour since her election in 2015.
Lewisham West was a borough constituency in south-east London represented in the House of Commons of the Parliament of the United Kingdom. It elected one Member of Parliament (MP) by the first past the post system of election from 1918, until it was abolished for the 2010 general election.
Hornsey and Wood Green is a constituency in Greater London created in 1983 and represented in the House of Commons of the UK Parliament since 2015 by Catherine West, of the Labour Party. To date it has drawn together for general elections parts of the London Borough of Haringey.
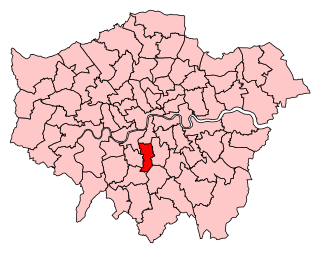
Putney is a constituency created in 1918. It is currently represented in the House of Commons of the UK Parliament since 2019 by Fleur Anderson of the Labour Party. Putney was the only seat that Labour gained during the 2019 general election.
Streatham is a constituency represented in the House of Commons of the UK Parliament since 2019 by Bell Ribeiro-Addy of the Labour Party.
Lewisham East is a parliamentary constituency represented in the House of Commons of the UK Parliament since the by-election on 14 June 2018 by Janet Daby of the Labour Party.
Enfield North is a peripheral Greater London constituency created in 1974 and represented in the House of Commons of the UK Parliament since 2019 by Feryal Clark of the Labour Party.
Enfield Southgate is a constituency in the House of Commons of the UK Parliament. It was created in 1950 as Southgate, and has been represented since 2017 by Bambos Charalambous, a member of the Labour Party.
Tottenham is a constituency in Greater London represented in the House of Commons of the UK Parliament since 2000 by David Lammy of the Labour Party. Lammy has served as Shadow Secretary of State for Foreign, Commonwealth and Development Affairs since 2021 in the Shadow Cabinet of Keir Starmer, in which he previously served as Shadow Secretary of State for Justice and Shadow Lord Chancellor from 2020 to 2021. Tottenham was re-created as a parliamentary constituency in 1950, having previously existed from 1885 to 1918.
This article needs additional citations for verification .(May 2020) |
{{cite web}}
: CS1 maint: archived copy as title (link)