Electricity sector in Ethiopia

Last updated
Lineman on a conductor bundle of the Ethiopia-Kenya 500 kV HVDC Interconnector (power line under construction) in Ethiopia. Ethiopia-Kenya HVDC Interconnector, Lineman in Ethiopia.jpg
Lineman on a conductor bundle of the Ethiopia–Kenya 500 kV HVDC Interconnector (power line under construction) in Ethiopia.

Ethiopia has abundant resources that can generate 60,000 TWh electricity from hydroelectric, wind, solar and geothermal sources in the next 10 years. The electrification process causes GDP growth and high public demand for 110 million of its population. On total, Ethiopia produces 14 TWh (14,000 GWh) from all facilities and exports other resources like natural gas or crude oil.

Contents

There are numerous restraints over electrification with most people in rural areas utilize traditional biomass energy sources and lack of modernized transmission and distribution. To solve this, the government set up big projects to construct hydroelectric dams such as the Grand Ethiopian Renaissance Dam (GERD) and Koysha Dam that provide fertile electricity throughout the country. The other issues is power outage that can adversely affects households from daily interruption by the Ethiopian Electric Utility. Frequent power outage may lead to serious threat to people such as fear and discomfort to the environment as well as the use of alternative energy sources like charcoal, firewoods and candle.

Overview

The Ethiopian Electric Power building in Addis Ababa Ethiopian electric power corporation Addis Abeba.jpg
The Ethiopian Electric Power building in Addis Ababa

Ethiopia has abundant renewable energy resources that potentially generates 60,000 TWh of electric power from hydroelectric, wind, solar and geothermal sources. This boosted the GDP growth over past decades and increased electricity demand for public. However, the country is experiencing energy shortages and load shedding as it strive to offer supply for over 110 million people and predicted to grow 2.5% per year. With current ongoing projects, the country is constructing 4,500 MW of installed generation capacity. There is also plan to increase installed generation capacity in exponent to 17,000 MW in 10 years. [1]

Summary table
ResourcesUnitExploitable reserve Exploited percent 
Hydropower MW45,000 <5% 
Solar/day kWh/m2 4 – 6 <1% 
Wind, power and speed GW 

m/s 

100 

>7 

<1% 
Geothermal MW <10,000 <1% 
Agricultural waste Million tons 15-20 30% 
Natural gasBillion m3 113 0% 
Coal Million tons 300 0% 
Oil shale Million tons 253 0%

According to Worldometers, Ethiopia generated 11,116,860 MWh of electricity as of 2016 (covering 123% of its annual consumption needs). [2] Totally, Ethiopia produces 11 billion kWh from all facilities. The rest of self produced is either exported into other countries or unused. Thus, import–export is crucial to the energy sector involving sources like natural gas or crude oil. [3]

Data

Priest reading with candle during Orthodox wedding Orthodox wedding.jpg
Priest reading with candle during Orthodox wedding

Despite being potential, the availability of electricity still at infancy age and Ethiopia remained the lowest electricity consumption per capita in Africa. The majority rural population are utilizing traditional biomass energy sources than modern one, which accounted about 45.8 out of 49.9 million tonnes of oil equivalent of total primary energy supply in 2015. [4]

According to Ministry of Water, Irrigation and Electricity in 2017, access to electrical grid was about 56% and household connectivity was only about 25%. By 2014, estimated electricity consumption was about 70 kWh per capita and increased to 100 kWh by 2017. [5] [6] However, it was lower than other African countries in terms of per capita. [7] The government began strategic priorities in the energy sector, for example universal electrification access, energy efficiency improvement, developing decentralized off-grid power generation, and exporting electricity to neighboring countries. A number of big projects were set up to construct largest dams for electrification: the Koysha and Grand Ethiopian Renaissance Dam (GERD) are under construction to increase energy production. [8] [9]

Power outage

For some impoverished people, particularly in rural areas, firewood used as a source of energy in Ethiopia. Ethiopia IMG 5685 Addis Abeba, women carrying firewood. (39809834812).jpg
For some impoverished people, particularly in rural areas, firewood used as a source of energy in Ethiopia.

In 2018, access of electricity in Ethiopia reached 45%, and power generation, especially hydropower, tripled in a decade from about 850 MW to above 2,000 MW. [12] [13] According to the World Bank, [14] power outage of Ethiopia occurred 8.2 times in a typical month, each average duration of 5.8 hours. Similarly, in July 2015–June 2016, daily electricity interruption from the Ethiopian Electric Utility estimated on average duration about 1–9 minutes at the distribution lines in Addis Ababa. [15] The reason behind the problem is poor physical condition and low capacity of transmission and distribution lines, though shortfall in supply and scheduled outages sometimes common. [16]

Frequent outage may cause potential benefits from individuals households overall. Engida et al. (2011) using a static computable general equilibrium model, estimated loss of 3.1% of GDP in Ethiopia as a result of power outage in 2010. Power outage also critically concerned by manufacturing firms. For households, it can cause adverse effects into several forms which leads to incur alternative source of energy such as charcoal, candle, kerosene, firewood, liquefied petroleum gas and standby generators. It can also incites fears and discomfort such as inability to walk at night, loss of leisure time, inconvenience from alternative energy sources and environmental and health effects. In addition, it would impact on energy transition from solid fuels to modern energy by slowing down the connections. [16]

Related Research Articles

<span class="mw-page-title-main">Electricity sector in India</span> Power generation and distribution

India is the third largest producer of electricity in the world. During the fiscal year (FY) 2022–23, the total electricity generation in the country was 1,844 TWh, of which 1,618 TWh was generated by utilities.

<span class="mw-page-title-main">Energy in the United States</span>

Energy in the United States is obtained from a diverse portfolio of sources, although the majority came from fossil fuels in 2021, as 36% of the nation's energy originated from petroleum, 32% from natural gas, and 11% from coal. Electricity from nuclear power supplied 8% and renewable energy supplied 12%, which includes biomass, wind, hydro, solar and geothermal.

<span class="mw-page-title-main">Renewable energy in Brazil</span>

As of 2018, renewable energy accounted for 79% of the domestically produced electricity used in Brazil.

<span class="mw-page-title-main">Renewable energy in Spain</span> Overview of renewable energy in Spain

Spain, along with other European Union States, has a target of generating 32% of all its energy needs from renewable energy sources by 2030. A previous target of 20% for 2020, with an additional 0.8% available for other EU countries under the cooperation mechanism, was reached and slightly surpassed. In 2021, renewables generated 46.7% of Spain's electricity needs, the largest part of it from wind power (23.3%), followed by hydroelectric (11.4%), solar (9.9%), and other renewables (2.2%).

<span class="mw-page-title-main">Energy in Romania</span>

Energy in Romania describes energy and electricity production, consumption and import in Romania.

According to the International Hydropower Association, Canada is the fourth largest producer of hydroelectricity in the world in 2021 after the United States, Brazil, and China. In 2019, Canada produced 632.2 TWh of electricity with 60% of energy coming from Hydroelectric and Tidal Energy Sources).

<span class="mw-page-title-main">Energy in Senegal</span>

As of April 2020, the energy sector in Senegal has an installed capacity of 1431 megawatts (MW). Energy is produced by private operators and sold to the Senelec energy corporation. According to a 2020 report by the International Energy Agency, Senegal had nearly 70% of the country connected to the national grid. Current government strategies for electrification include investments in off-grid solar and connection to the grid.

<span class="mw-page-title-main">Energy in the Democratic Republic of the Congo</span>

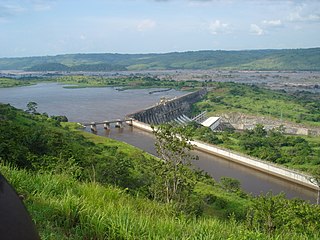
The Democratic Republic of the Congo was a net energy exporter in 2008. Most energy was consumed domestically in 2008. According to the IEA statistics the energy export was in 2008 small and less than from the Republic of Congo. 2010 population figures were 3.8 million for the RC compared to CDR 67.8 Million.

Energy in Ethiopia is energy and electricity production, consumption, transport, exportation, and importation in Ethiopia.

<span class="mw-page-title-main">Renewable energy in Russia</span> Russias renewable energy sources

Renewable energy in Russia mainly consists of hydroelectric energy. In 2010, the country was the sixth largest producer of renewable energy in the world, although it was 56th when hydroelectric energy was not taken into account. Some 179 TWh of Russia's energy production came from renewable energy sources, out of a total economically feasible potential of 1823 TWh. 16% of Russia's electricity was generated from hydropower, and less than 1% was generated from all other renewable energy sources combined. Roughly 68% of Russia's electricity was generated from thermal power and 16% from nuclear power.

Italy's total electricity consumption was 302.75 terawatt-hour (TWh) in 2020, of which 270.55 TWh (89.3%) was produced domestically and the remaining 10.7% was imported.

<span class="mw-page-title-main">Electricity sector in Belgium</span> Overview of the electricity sector in Belgium

The electricity sector in Belgium describes electricity in Belgium. Production by power source in 2009 was 53% nuclear, 40% fossil electricity and 7% renewable electricity. 2% of production was exported in 2009. In 2008 import was 11%. Belgium is highly nuclear dependent country where the share of renewable electricity has been low. The share of renewable electricity was about 2% in 2005. Plan for 2020 is wind 10.5 TWh (9.5%), biomass 11 TWh and PV 1 TWh.

<span class="mw-page-title-main">Electricity sector in Switzerland</span> Overview of the electricity sector in Switzerland

The electricity sector in Switzerland relies mainly on hydroelectricity, since the Alps cover almost two-thirds of the country's land mass, providing many large mountain lakes and artificial reservoirs suited for hydro power. In addition, the water masses drained from the Swiss Alps are intensively used by run-of-the-river hydroelectricity (ROR). With 9,052 kWh per person in 2008, the country's electricity consumption is relatively high and was 22% above the European Union's average.

<span class="mw-page-title-main">Energy in Spain</span> Overview of the production, consumption, import and export of energy and electricity in Spain

Primary energy consumption in Spain in 2015 was mainly composed of fossil fuels. The largest sources are petroleum (42.3%), natural gas (19.8%) and coal (11.6%). The remaining 26.3% is accounted for by nuclear energy (12%) and different renewable energy sources (14.3%). Domestic production of primary energy includes nuclear (44,8%), solar, wind and geothermal (22,4%), biomass and waste (21,1%), hydropower (7,2%) and fossil (4,5%).

<span class="mw-page-title-main">Energy in Slovenia</span> Overview of the production, consumption, import and export of energy and electricity in Slovenia

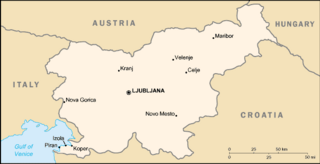
Total primary energy supply (TPES) in Slovenia was 6.80 Mtoe in 2019. In the same year, electricity production was 16.1 TWh, consumption was 14.9 TWh.

<span class="mw-page-title-main">Renewable energy in the Netherlands</span>

Despite the historic usage of wind power to drain water and grind grain, the Netherlands today lags 21 of the 26 other member states of the European Union in the consumption of energy from renewable sources. In 2022, the Netherlands consumed just 15% of its total energy from renewables. According to statistics published by Eurostat, it was the last among the EU countries in the shift away from global warming-inducing energy sources. The leading renewable sources in the country are biomass, wind, solar and both geothermal and aerothermal power. In 2018 decisions were made to replace natural gas as the main energy source in the Netherlands with increased electrification being a major part of this process.

<span class="mw-page-title-main">Renewable energy in Ethiopia</span>

Ethiopia generates most of its electricity from renewable energy, mainly hydropower.

<span class="mw-page-title-main">Energy in Nepal</span>

Nepal had a total primary energy supply (TPES) of 10.29 Mtoe in 2012. Electricity consumption was 3.57 TWh. Most of this primary energy represents solid biofuels used in the residential sector . About 23% of the electricity is imported, with the rest almost completely supplied by hydroelectricity. Nepal also exports hydroelectricity to India in the wet season. The energy sources are the following, Biomass at 87%, Petroleum product 8%, Electricity 2%,and Renewable energy which includes Hydro, Nuclear, Wind, and Solar 3%.

Myanmar had a total primary energy supply (TPES) of 16.57 Mtoe in 2013. Electricity consumption was 8.71 TWh. 65% of the primary energy supply consists of biomass energy, used almost exclusively (97%) in the residential sector. Myanmar’s energy consumption per capita is one of the lowest in Southeast Asia due to the low electrification rate and a widespread poverty. An estimated 65% of the population is not connected to the national grid. Energy consumption is growing rapidly, however, with an average annual growth rate of 3.3% from 2000 to 2007.

Denmark is a leading country in renewable energy production and usage. Renewable energy sources collectively produced 75% of Denmark's electricity generation in 2022, and are expected to provide 100% of national electric power production from 2030. Including energy use in the heating/cooling and transport sectors, Denmark is expected to reach 100% renewable energy in 2050, up from the 34% recorded in 2021.

References

  1. "Ethiopia". Commercial Guide. 25 July 2022. Archived from the original on 9 July 2022. Retrieved 25 July 2022.
  2. "Ethiopia Electricity Statistics - Worldometer". www.worldometers.info. Archived from the original on 2021-12-30. Retrieved 2022-07-25.
  3. "Energy consumption in Ethiopia". Worlddata.info. Archived from the original on 2019-06-26. Retrieved 2022-07-25.
  4. Yurnaidi Z, Suduk K (2018) Reducing biomass utilization in the Ethiopia energy system: A national modeling analysis. Energies 11: 1745.
  5. Mondal AH, Gebremeskel AG, Gebrehiwot K, et al. (2018) Ethiopian universal electrification development strategies. Intl Food Policy Res Inst. Available from. Archived from the original on 2022-07-25. Retrieved 2022-07-25.
  6. Mondal MAH, Bryan E, Ringler C, et al. (2018) Ethiopian energy status and demand scenarios: prospects to improve energy efficiency and mitigate GHG emissions. Energy 149. pp. 161–172.
  7. Mengistu MG, Simane B, Eshete G, et al. (2015) A review on biogas technology and its contributions to sustainable rural livelihood in Ethiopia. Renewable Sustainable Energy Rev 48: 306-316. pp. 306–316.
  8. Policy brief. Ethanol for cooking programme in Ethiopia. Addis Ababa: Gaia Association- Ethiopia. 2014.
  9. Hailu, Ashebir Dingeto; Kumsa, Desta Kalbessa; Hailu, Ashebir Dingeto; Kumsa, Desta Kalbessa (2021). "Ethiopia renewable energy potentials and current state". AIMS Energy. 9 (1): 1–14. doi: 10.3934/energy.2021001 . ISSN   2333-8334. S2CID   229407176.
  10. "Her story: Ethiopian forests". CIFOR Forests News. 2019-11-22. Archived from the original on 2021-04-11. Retrieved 2022-07-25.
  11. Bahru, Tinsae; Kidane, Berhane; Tolessa, Amsalu (2021-08-16). "Prioritization and selection of high fuelwood producing plant species at Boset District, Central Ethiopia: an ethnobotanical approach". Journal of Ethnobiology and Ethnomedicine. 17 (1): 51. doi:10.1186/s13002-021-00474-9. ISSN   1746-4269. PMC   8365965 . PMID   34399804. Archived from the original on 2022-07-25. Retrieved 2022-07-25.
  12. "ETHIOPIAN ELECTRIC POWER". 25 July 2022. Archived from the original on 21 January 2022. Retrieved 25 July 2022.
  13. Boke, Megersa Tesfaye; Moges, Semu Ayalew; Dejen, Zeleke Agide (2022-01-14). "Optimizing renewable-based energy supply options for power generation in Ethiopia". PLOS ONE. 17 (1): e0262595. doi: 10.1371/journal.pone.0262595 . ISSN   1932-6203. PMC   8759650 . PMID   35030223.
  14. "Power outages in firms in a typical month (number)". data.worldbank.org. Archived from the original on 2022-07-25. Retrieved 2022-07-25.
  15. "Cost of Power Outages for Manufacturing Firms in Ethiopia" (PDF). 25 July 2022. Archived (PDF) from the original on 25 July 2022. Retrieved 25 July 2022.
  16. 1 2 Meles, Tensay Hadush (2020-09-01). "Impact of power outages on households in developing countries: Evidence from Ethiopia". Energy Economics. 91: 104882. doi: 10.1016/j.eneco.2020.104882 . ISSN   0140-9883. S2CID   225177699.