This article needs to be updated. Please help update this article to reflect recent events or newly available information.(February 2024)
Swiss Electricity by Source
Hydro Riv.: 17,000 GWh (26.6%)
Hydro Dam: 22,600 GWh (35.3%)
Solar PV: 2,850 GWh (4.5%)
Wood: 675 GWh (1.1%)
Wind: 145 GWh (0.2%)
Waste Incin.: 2,180 GWh (3.4%)
Nuclear: 18,500 GWh (28.9%)
Electricity sector in Switzerland, in 2021. Mostly carbon free with hydro (62%) and nuclear (29%).[1]
The electricity sector in Switzerland relies mainly on hydroelectricity, since the Alps cover almost two-thirds of the country's land mass, providing many large mountain lakes and artificial reservoirs suited for hydro power. In addition, the water masses drained from the Swiss Alps are intensively used by run-of-the-river hydroelectricity (ROR). With 9,052 kWh per person in 2008, the country's electricity consumption is relatively high and was 22% above the European Union's average.
In 2013, net generated electricity amounted to 66.2terawatt-hours (TWh). About 60% of Switzerland's electricity generation comes from renewable sources, most of it from hydro (56.6%), while non-hydro renewables supplied a small contribution of 3.4%. Nuclear contributed 37.6% to the country's electricity production and only about 2.5% were generated by fossil fuel based thermal power stations.[2][3]
Consumption
According to IEA the electricity use (gross production + imports – exports – transmission/distribution losses) in Switzerland was in 2004 60.6 TWh, (2007) 61.6 TWh and (2008) 63.5 TWh.[4] In 2008 Switzerland consumed electricity per inhabitant 122% compared to the European Union 15 average (9,052 / EU15: 7,409 electricity use per inhabitant 2008, kWh/person) [5] and 133% compared to the United Kingdom (2008: UK 372.19 TWh per 59.9milj. person and Switzerland 63,53 TWh per 7,71 milj.person).[4]
In 2021, Switzerland generated 63.1 TWh of electricity, with hydroelectric power contributing 59% of this total. The closure of the Mühleberg nuclear power plant led to a decrease in nuclear power's share from 42% in 2011 to 31% by 2021. Combined, hydro and nuclear sources constituted nearly 90% of the electricity mix in 2021. Additionally, bioenergy and solar contributed 5.2% and 4.5%, respectively, whereas natural gas, oil, and wind each contributed less than 1% of the total generation.[6][7]
The country's electricity demand totaled 58 TWh in 2021. The residential sector was the primary consumer, accounting for approximately 35% of the total demand. The industrial sector was a close second, using about 32%, followed by the service sector at roughly 28%, and the transport sector, which constituted around 6% of the overall electricity consumption.[6][7]
In 2020, Switzerland's total installed capacity was 22.9 GW, surpassing the peak load of 9.6 GW. Hydropower comprised 68% of this capacity, though its yearly production is limited by storage capacity and water availability. In 2021, hydroelectric production totaled approximately 40 TWh, factoring in 4 TWh from pump energy, and led to a net generation of 36 TWh.[6][7]
There are four nuclear power plants, with a total of five operational reactors. In 2013, they produced 24.8 terawatt-hours (TWh) of electricity. Nuclear power accounted for 36.4% of the nation's gross electricity generation of 68.3TWh[8] In addition, there are a number of research reactors in Switzerland, one of them at the EPFL.
In 2011, the federal authorities decided to gradually phase out nuclear power in Switzerland as a consequence of the Fukushima accident in Japan. In late 2013 the operator BKW decided to cease all electrical generation in 2019 in the Mühleberg plant
As of December 8, 2014, the National Council has voted to limit the operational life-time of the Beznau Nuclear Power Plant—which houses the oldest commercial reactor in the world—to 60 years, forcing decommissioning upon its two reactors by 2029 and 2031, respectively.[9]
In 2021, nuclear power constituted 22% of Switzerland's Total Energy Supply (TES) and accounted for 31% of total electricity generation. Additionally, Switzerland ranked eighth among International Energy Agency (IEA) countries in terms of the proportion of nuclear power in its electricity generation mix.[6][7]
Oil power
From 1965 until 1999, the Chavalon plant in Valais, above the Collombey refinery, had an electrical power output of two times 142 megawatts. The refinery was shut down in 2015, and will be dismantled until 2022.
In 2021, the contribution of oil to electricity generation was minimal, accounting for just 0.05% of the total electricity produced.[6][7]
Gas power
A newly built gas power plant is debated to cover future power shortages during the winter. There are considerations regarding a gas turbine testing facility in Birr AG belonging to the Italian engineering firm Ansaldo Energia. The facility is connected to both the gas and the electricity grid, and when both installed turbines are running, it feeds 740 megawatts into the Swiss electricity grid.[10]
In 2021, the contribution of natural gas to electricity generation was minimal, accounting for just 0.8% of the total electricity produced.[6][7]
The federal government adopted feed-in tariffs to offer a cost-based compensation to renewable energy producers. The feed-in remuneration at cost (KEV, German: Kostendeckende Einspeisevergütung, French: Rétribution à prix coûtant du courant injecté, Italian: Rimunerazione a copertura dei costi per l'immissione in rete di energia elettrica) is the primary instrument for promoting the deployment of power systems using renewable energy sources.
It covers the difference between the production and the market price, and guarantees producers of electricity from renewable sources a price that corresponds to their production costs. The following renewable energy sources are supported by the KEV remuneration: distributed small hydro (with capacities up to 10 MW), solar photovoltaics, wind power, geothermal energy, biomass and biogas (from agriculture, waste and water treatment).
The KEV remuneration is financed by collecting a surcharge on the consumed kilowatt-hour of electricity. As in other countries, industries with a large electricity consumption are exempt from the surcharge, which has gradually been increased and stands at 1.5 cents per kWh as of 2014.[11]
The remuneration tariffs for renewables have been specified based on reference power plants for each individual technology. Feed-in tariffs are applicable for 20 to 25 years, depending on the technology. In view of the anticipated technological progress and the increasing degree of market maturity of renewables energy technologies (especially for solar PV), the feed-in tariffs are subjected to a gradual reduction once or twice a year. These reductions only apply to new production facilities that are put into operation.
Planned installations of renewable power facilities have to be registered with Swissgrid, the national network operator. As of the end of 2014, a growing waiting list for solar photovoltaic systems has accumulated as demand excess the capped capacities given by the currently available funds of the KEV remuneration.
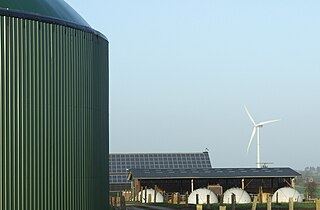
Wind power
Swiss wind power accounted for only 146 GWh or 0.2% of net-electricity production in 2019.
For many years, Switzerland's pace of deploying solar PV had been lagging significantly behind its neighboring Germany and Italy. However, installed capacity of solar PV increased by 300 MW or 69% to 737 MW in 2013 and is likely to continue its strong growth due to the recently ramped up KEV funds. In 2014, another installed 320 MW brought the country beyond the gigawatt mark and the IEA-PVPS estimates the now installed capacity sufficient to supply close to 2% of the domestic electricity demands.[12]
Emissions of carbon dioxide in total, per capita in 2007 were 5.6 tons CO2 compared to EU 27 average 7.9 tons CO2.[14]
Carbon dioxide emissions
A study published in 2009 showed that the emissions of carbon dioxide (CO2) due to the electricity consumed in Switzerland (total: 5.7 million tonnes) are seven times higher than the emissions of carbon dioxide due to the electricity produced in Switzerland (total: 0.8 million tonnes).[15]
The study also show that the production in Switzerland (64.6 TWh) is similar to the amount of electricity consumed in the country (63.7 TWh).[15] Overall, Switzerland exports 7.6 TWh and imports 6.8 TWh; but, in terms of emissions of carbon dioxide, Switzerland exports "clean" electricity causing emissions of 0.1 million tonnes of CO2 and imports "dirty" electricity causing emissions of 5 million tonnes of CO2.[15]
The electricity produced in Switzerland generated 14 grammes of CO2 per kilowatt hour. The electricity consumed in Switzerland generated 100 grammes of CO2 per kilowatt hour.[16]
↑ "Neue Zürcher Zeitung - NZZ.ch". Archived from the original on 2012-10-24. Retrieved 2012-10-25., Neue Zürcher Zeitung, [ "Neue Zürcher Zeitung - NZZ.ch". Archived from the original on 2012-10-24. Retrieved 2012-10-25.schweiz/nationalrat-will-beznau-nach-60-jahren-vom-netz-nehmen-1.18440712 Nationalrat will Beznau nach 60 Jahren vom Netz nehmen (in German)], 8 December 2014
↑ Die Neue Zürcher Zeitung, (in German), 20 August 2014
↑ "Snapshot of Global PV 1992-2014"(PDF). www.iea-pvps.org. International Energy Agency — Photovoltaic Power Systems Programme. 30 March 2015. p.13. Archived from the original on 7 April 2015.
↑ Energy in Sweden 2010, Table 1: Emissions of carbon dioxide in total, per capita and per GDP in EU and OECD countries, 2007 2010 Table 1Archived October 16, 2013, at the Wayback Machine
The electricity sector in Norway relies predominantly on hydroelectricity. A significant share of the total electrical production is consumed by national industry.
Renewable energy in Germany is mainly based on wind and biomass, plus solar and hydro. Germany had the world's largest photovoltaic installed capacity until 2014, and as of 2023 it has over 82 GW. It is also the world's third country by installed total wind power capacity, 64 GW in 2021 and second for offshore wind, with over 7 GW. Germany has been called "the world's first major renewable energy economy".
China is both the world's largest energy consumer and the largest industrial country, and ensuring adequate energy supply to sustain economic growth has been a core concern of the Chinese Government since the founding of the People's Republic of China in 1949. Since the country's industrialization in the 1960s, China is currently the world's largest emitter of greenhouse gases, and coal in China is a major cause of global warming. However, from 2010 to 2015 China reduced energy consumption per unit of GDP by 18%, and CO2 emissions per unit of GDP by 20%. On a per-capita basis, China was only the world's 51st largest emitter of greenhouse gases in 2016. China is also the world's largest renewable energy producer, and the largest producer of hydroelectricity, solar power and wind power in the world. The energy policy of China is connected to its industrial policy, where the goals of China's industrial production dictate its energy demand managements.
Renewable energy in Finland increased from 34% of the total final energy consumption (TFEC) in 2011 to 48% by the end of 2021, primarily driven by bioenergy (38%), hydroelectric power (6.1%), and wind energy (3.3%). In 2021, renewables covered 53% of heating and cooling, 39% of electricity generation, and 20% of the transport sector. By 2020, this growth positioned Finland as having the third highest share of renewables in TFEC among International Energy Agency (IEA) member countries.
Renewable energy in Spain, comprising bioenergy, wind, solar, and hydro sources, accounted for 15.0% of the Total Energy Supply (TES) in 2019. Oil was the largest contributor at 42.4% of the TES, followed by gas, which made up 25.4%.
Energy in Finland describes energy and electricity production, consumption and import in Finland. Energy policy of Finland describes the politics of Finland related to energy. Electricity sector in Finland is the main article regarding electricity in Finland.
China is the world's largest electricity producer, having overtaken the United States in 2011 after rapid growth since the early 1990s. In 2021, China produced 8.5 petawatt-hour (PWh) of electricity, approximately 30% of the world's electricity production.
Energy in Switzerland is transitioning towards sustainability, targeting net zero emissions by 2050 and a 50% reduction in greenhouse gas emissions by 2030.
Energy in Italy comes mostly from fossil fuels. Among the most used resources are petroleum, natural gas, coal and renewables. Italy has few energy resources, and most supplies are imported.
Russia is the fourth largest generator and consumer of electricity in the world. Its 440 power stations have a combined installed generation capacity of 220 GW.
Electricity production in Belgium reached 87.9 terawatt-hours (TWh) in 2020, with nuclear power (39%), natural gas (30%), and wind (15%) as the primary sources. Additional contributions came from biofuels and waste (7%), solar (6%), and coal (2%). In the same year, the total electricity demand was 80.9 TWh, with consumption predominantly from the industrial sector (50%), followed by commercial (25%), residential (23%), and transport (2%) sectors.
South Africa has a large energy sector, being the third-largest economy in Africa. The country consumed 227 TWh of electricity in 2018. The vast majority of South Africa's electricity was produced from coal, with the fuel responsible for 88% of production in 2017. South Africa is the 7th largest coal producer in the world. As of July 2018, South Africa had a coal power generation capacity of 39 gigawatts (GW). South Africa is the world's 14th largest emitter of greenhouse gases. South Africa is planning to shift away from coal in the electricity sector and the country produces the most solar and wind energy by terawatt-hours in Africa. The country aims to decommission 34 GW of coal-fired power capacity by 2050. It also aims to build at least 20 GW of renewable power generation capacity by 2030. South Africa aims to generate 77,834 megawatts (MW) of electricity by 2030, with new capacity coming significantly from renewable sources to meet emission reduction targets. Through its goals stated in the Integrated Resource Plan, it announced the Renewable Energy Independent Power Producer Procurement Programme, which aims to increase renewable power generation through private sector investment.
The Polish energy sector is the fifth largest in Europe. In 2023, the country consumed 167.52 TWh of electricity, a 3.44% year–on–year decrease from 2022. Out of this, 76.61 TWh came from hard coal, 34.57 TWh from lignite, 22 TWh from wind energy, and 13.65 TWh from gas, with the remainder coming from other sources, such as solar, biomass, and hydropower.
Energy in Sweden describes energy and electricity production, consumption and import in Sweden. Electricity sector in Sweden is the main article of electricity in Sweden. The Swedish climate bill of February 2017 aims to make Sweden carbon neutral by 2045. The Swedish target is to decline emission of climate gases 63% from 1990 to 2030 and international transportation excluding foreign flights 70%. By 2014 just over half of the country's total final energy consumption in electricity, heating and cooling and transport combined was provided by renewables, the highest share amongst the then 28 EU member countries. About a third of Sweden's electricity is generated by nuclear power. In generating a year's worth of this energy, Swedes generate about 4 tonnes of CO2 emissions each. Since 2010, sustainability measures have reduced total emissions even as the population has increased.
Primary energy consumption in Spain in 2015 was mainly composed of fossil fuels. The largest sources are petroleum (42.3%), natural gas (19.8%) and coal (11.6%). The remaining 26.3% is accounted for by nuclear energy (12%) and different renewable energy sources (14.3%). Domestic production of primary energy includes nuclear (44,8%), solar, wind and geothermal (22,4%), biomass and waste (21,1%), hydropower (7,2%) and fossil (4,5%).
Energy in Portugal describes energy and electricity production, consumption and import in Portugal. Energy policy of Portugal will describe the politics of Portugal related to energy more in detail. Electricity sector in Portugal is the main article of electricity in Portugal.
Primary energy use in Slovakia was 194 TWh and 36 TWh per million inhabitants in 2009.
Total primary energy supply (TPES) in Slovenia was 6.80 Mtoe in 2019. In the same year, electricity production was 16.1 TWh, consumption was 14.9 TWh.
Solar power in Mexico has the potential to produce vast amounts of energy. 70% of the country has an insolation of greater than 4.5 kWh/m2/day. Using 15% efficient photovoltaics, a square 25 km (16 mi) on each side in the state of Chihuahua or the Sonoran Desert could supply all of Mexico's electricity.
Solar power in Switzerland has demonstrated consistent capacity growth since the early 2010s, influenced by government subsidy mechanisms such as the implementation of the feed-in tariff in 2009 and the enactment of the revised Energy Act in 2018. By the end of 2022, solar photovoltaic (PV) capacity had reached 4.7 GW, a notable increase from the 0.1 GW recorded in 2010. Concurrently, the contribution of solar power to electricity generation also rose, climbing from 0.1% in 2010 to 6.2% in 2022.
This page is based on this Wikipedia article Text is available under the CC BY-SA 4.0 license; additional terms may apply. Images, videos and audio are available under their respective licenses.