Electricity sector in Norway

Last updated
Electricity sector of Norway
Data
Installed capacity (2021)40.26 GW [1]
Production (2021 [1] )157.113 TWh (565,610 TJ)
Share of fossil energy 1% [1]
Share of renewable energy 99%
GHG emissions from electricity generation (2007)0.8 Mt CO2
Average electricity use (2008)27 MWh annually per capita
Consumption by sector
(% of total)
Residential34.2 [1] (2021)
Industrial44.5 [1] (2021)
Commercial21.3 [1] (2021)
Alta dam, one of Norway's 937 hydropower stations that provide 98% of the nation's power. Alta-damm.jpg
Alta dam, one of Norway's 937 hydropower stations that provide 98% of the nation's power.

The electricity sector in Norway relies predominantly on hydroelectricity. [3] [4] A significant share of the total electrical production is consumed by national industry.

Contents

Production and consumption

Production, consumption and export of electrical energy in Norway. Source: Statistisk sentralbyra. www.ssb.no Produksjon forbruk og eksport av elektrisk energi i Norge.png
Production, consumption and export of electrical energy in Norway. Source: Statistisk sentralbyrå. www.ssb.no

Average annual hydropower generation capacity in 2019 was around 131 TWh, about 95% of total electricity production. [5]

Of the total production in 2011 of 128 TWh; 122 TWh was from hydroelectric plants, 4795 GWh was from thermal power, and 1283 GWh was wind generated. [6] In the same year, the total consumption was 114 TWh. [6] Hydro production can vary 60 TWh between years, depending on amount of precipitation, and the remaining hydro potential is about 34 TWh. [7]

In 2016, the Norwegian government published a white paper regarding their future energy intentions through 2030. This announcement emphasized four main goals, which were improving security in the supply of their power, improving the efficiency of their renewables, making their energy more efficient, and more environment- and climate-sensitive, and fostering economic development and value through fiscally responsible and renewable technology. [8]

The annual electricity consumption was about 26-27 MWh per inhabitant during 2004-2009 when the European union (EU15) average in 2008 was 7.4 MWh. Norway’s consumption of electricity was over three times higher per person compared to the EU 15 average in 2008. The domestic electricity supply promotes use of electricity, [9] and it is the most common energy source for heating floors and hot water.

Electricity per person and by power source

Electricity per person in Norway (kWh/ inhab.) [10]
UseProductionImportImp./Exp. %Fossil Nuclear Nuc.  %Other RE* Bio+waste Wind Non RE use** RE  %*
200426,60124,0962,5059.4%10500%23,893982,61090.2%
200527,29729,894-2,597-9.5%10800%29,70184-2,488109.1%
200627,34929,490-2.141-7.8%16700%29,195128-1,974107.2%
200827,39830,355-2,957-10.8%15100%30,13074-2,806110.2%
200925,69127,549-1,858-7.2%91900%26,38863209*-969103.8%
2014431 [11]
2015484 [11]
* Other RE is waterpower, solar and geothermal electricity and windpower until 2008
** Non RE use = use – production of renewable electricity
RE % = (production of RE / use) * 100% Note: EU calculates the share of renewable energies in gross electrical consumption.

Transmission

External image
Searchtool.svg Grid map of Scandinavia, 2020

Statnett is the transmission system operator in Norway, operating 11,000 km of high power lines. [12] There are plans to upgrade the western grid from 300 to 420 kV at a cost of 8 billion NOK, [13] [14] partly to accommodate cables [15] to Germany [16] and England. [17]

Norway has an open electric market, integrated with the other Nordic countries over the Synchronous grid of Northern Europe. Export and import is routine over the direct power links to Sweden, Denmark, and the Netherlands. The market is handled by Nord Pool, and has 5 price zones in Norway. Financial future contracts are traded at NASDAQ OMX. Many of the hydroelectric plants in Norway are easily adjustable and can adapt well to variations in demand, and hence in price, but frequency stability is not satisfactory, and Statnett works with producers to minimize sudden changes in power flow. [18] On a normal day, when price is low during nighttime, Norway normally imports power, and exports during daytime when the price is higher. Maintaining the grid in the harsh Norwegian nature is a compromise between stability desires and economy, and outages are expected in these circumstances. [19] The IT-nett, about 70% of the grid, is not grounded. [20]

West of Oslo, there is a small single-phase AC power grid operated with 16.7 Hz frequency for power supply of electric railways. [21]

Price

In some years, a combination of high power prices in the market and less than usual rainfall renders the power system more vulnerable to power shortages. So far consumers in Norway have noted this by paying a higher price for electrical power during winter, however still a low price in international terms. Copious snow- and rain-fall in the mild winters of 2013-15 led to sharply lower prices, which was 26.7 øre per kWh in 2015. [22]

New connections to other countries could stabilize available power levels and reduce price swings, however as these areas are more expensive, average price may rise in Norway. Grid strengthening may cost a few billion kroner. [23]

Mode of production

Hydroelectricity

Typical Norwegian geography Norway- Fjord on a rainy day (cropped).jpeg
Typical Norwegian geography

Hydroelectric power is the main mode of electricity production. Norway is known for its particular expertise in the development of efficient, environment-friendly hydroelectric power plants. [24] Calls to power Norway principally through hydropower emerged as early as 1892, coming in the form a letter by the former Prime Minister Gunnar Knutsen to parliament. Ninety percent of hydropower capacity is publicly owned and distributed across municipalities and counties. [25] Nationwide installed capacity of hydropower amounted to 33.8 GW in 2015. The maximum working volume of hydrologic storage power plants is 85 TWh, whereas the average seasonal cycle is 42 terawatt-hours (TWh). In 2015, hydroelectricity generated 144 TWh and accounted for 95.8% of the national electricity demand. [26] In European markets, it is the single largest producer of hydropower. [27] According to the IEA, Norway generated 4.3 percent of the worldwide hydropower in 2008 and ranked 6th for that year, behind China, Canada, Brazil, the United States and Russia. [28]

Part of the reason that so much of Norway’s electricity can be generated from hydropower is due to the natural advantage of its topography, with abundant steep valleys and rivers. Due to climate change, the region is currently experiencing heavier rainfall and is projected to receive more in the future, further increasing its capacity for hydropower. [29]

Wind power

Wind power capacity was at the end of 2019 2444 MW producing 5.5 TWh, an increase of about 780 MW (2.5 TWh) in 2019. [30]

In 2021, 64 wind farms had total installed wind power capacity of 4,649 MW with 706 MW of onshore power being added in 2021. Electricity produced in 2021 being 11.8 TWh or 8.5% of Norway's needs. [31]

Solar power

The national support for solar power is in place since 2008. [32] For 2013, the European Photovoltaic Industry Association reports a negligible 0.02 watts per inhabitant or less than 0.1 megawatt (MW) of installed photovoltaic capacity in Norway. This is a hundred times less than in Finland (2 watts per inhabitant), two hundred times less than in Sweden (4 watts per inhabitant) and almost five thousand times less than in Denmark (98 watts per inhabitant). [33] However, use of solar power is growing at an accelerated pace; in 2016, installed panel capacity grew by 366%. [34] Proponents indicate that Norway has a surprisingly high capacity for solar energy capture. For instance, records from the city of Narvik show that the region can receive almost as much sunlight as southern Germany. [35] However, this is still just above a third of the solar energy that an area that receives a high amount of solar energy would receive (based on received radiation from Australia.) [36] Solar companies include Elkem Solar and NorSun. Renewable Energy Corporation REC was a solar power company with headquarters in Norway and Singapore. Elkem Solar was part of Norwegian Elkem. Orkla Group sold it with $2 billion in January 2011 to a Chinese chemical company China National Bluestar head office in Beijing. [37] NorSun is a private solar cell producer. [38]

Coal power

On the island of Svalbard about 0.108 TWh of electricity and heat is produced annually, in two coal fired power plants. The coal is mined on the island, where the surplus of coal (2/3 of production) is exported.

Other types

Norway has around 3 power plants burning natural gas, depending on how they are counted: Mongstad 280 MW CHP, Kårstø 420 MW (now closed), and Tjeldbergodden 150 MW (unused). They are rarely used, as hydropower is usually cheaper. [39]

Statkraft experiments with osmosis at Tofte. [40] [41]

Export/Import

Norway has imported up to 10% of its electricity production during 2004-2009. [10] According to IEA, in 2015, Norway exports about 15% of its electricity generation and imports about 5%, and the net electricity export was 14.645 TWh. [42] In 2021, exports were 24.7 TWh and imports 7.6 TWh, mostly from Sweden. [43]

Norway and Sweden's grids have long been connected across the 1630 km long border. A 1 GW [44] 420 kV high-voltage link between Nea River station in Norway and Järpen (Järpströmmen station at Indalsälven river) in Sweden was commissioned in 2009. [45] Beginning in 1977 the Norwegian and Danish grids were connected across the Skagerrak with 500 MW, growing to 1,700 MW in 2015. [46] Norway's grid is connected to the Netherlands across the North Sea since 2008 with the 580-kilometre 700 MW High-voltage direct current cable NorNed. The slightly shorter but with 1400 megawatt twice as powerful NordLink HVDC undersea cable connection to Northern Germany began operation in 2021, [47] more or less replacing the Brokdorf Nuclear Power Plant which was shut down at the end of 2021, and helping Norway save hydro power when Germany has a surplus of renewable energy.

The North Sea Link HVDC Norway to Great Britain cable was opened in October 2021, while the Scotland–Norway interconnector NorthConnect is on hold due to Norwegian policy.

See also

Regional:

Related Research Articles

<span class="mw-page-title-main">Hydroelectricity</span> Electricity generated by hydropower

Hydroelectricity, or hydroelectric power, is electricity generated from hydropower. Hydropower supplies one sixth of the world's electricity, almost 4,500 TWh in 2020, which is more than all other renewable sources combined and also more than nuclear power. Hydropower can provide large amounts of low-carbon electricity on demand, making it a key element for creating secure and clean electricity supply systems. A hydroelectric power station that has a dam and reservoir is a flexible source, since the amount of electricity produced can be increased or decreased in seconds or minutes in response to varying electricity demand. Once a hydroelectric complex is constructed, it produces no direct waste, and almost always emits considerably less greenhouse gas than fossil fuel-powered energy plants. However, when constructed in lowland rainforest areas, where part of the forest is inundated, substantial amounts of greenhouse gases may be emitted.

<span class="mw-page-title-main">Capacity factor</span> Electrical production measure

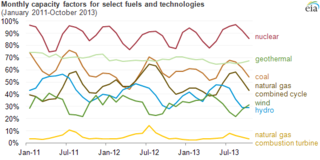
The net capacity factor is the unitless ratio of actual electrical energy output over a given period of time to the theoretical maximum electrical energy output over that period. The theoretical maximum energy output of a given installation is defined as that due to its continuous operation at full nameplate capacity over the relevant period. The capacity factor can be calculated for any electricity producing installation, such as a fuel consuming power plant or one using renewable energy, such as wind, the sun or hydro-electric installations. The average capacity factor can also be defined for any class of such installations, and can be used to compare different types of electricity production.

Statkraft AS is a hydropower company, fully owned by the Norwegian state. The Statkraft Group is Europe's largest generator of renewable energy, as well as Norway’s largest and the Nordic region's third largest energy producer. Statkraft develops and generates hydropower, wind power, gas power, district heating and solar power, and is also a player in the international energy markets. The company has 5300 employees in 21 countries with their headquarters located in Oslo, Norway.

Nordic electricity market is a common market for electricity in the Nordic countries. It is one of the first free electric-energy markets in Europe and is traded in NASDAQ OMX Commodities Europe and Nord Pool Spot. In 2003, the largest market shares were as follows: Vattenfall 17%, Fortum 14.1%, Statkraft 8.9%, E.on 7.5%, Elsam 5%, Pohjolan Voima 5%. Other producers had 42.5% market share.

<span class="mw-page-title-main">Renewable energy in Norway</span> Overview of renewable energy in the Kingdom of Norway

Norway is a heavy producer of renewable energy because of hydropower. Over 99% of the electricity production in mainland Norway is from 31 GW hydropower plants. The average hydropower is 133 TWh/year. There is also a large potential in wind power, offshore wind power and wave power, as well as production of bio-energy from wood. Norway has limited resources in solar energy, but is one of the world's largest producers of solar grade silicon and silicon solar cells.

<span class="mw-page-title-main">Energy in Switzerland</span> Overview of energy in Switzerland

Energy in Switzerland is transitioning towards sustainability, targeting net zero emissions by 2050 and a 50% reduction in greenhouse gas emissions by 2030.

<span class="mw-page-title-main">Electricity sector in Sweden</span> Overview of the electricity sector in Sweden

Majority of electricity production in Sweden relies on hydro power and nuclear power. In 2008 the consumption of electricity in Sweden was 16018 kWh per capita, compared to EU average 7409 kWh per capita. Sweden has a national grid, which is part of the Synchronous grid of Northern Europe. A specialty of the Nordic energy market is the existence of so-called electricity price areas, which complicate the wholesale Nordic energy market.

<span class="mw-page-title-main">Ulla-Førre</span> Dam

Ulla-Førre is a hydropower complex in Southern Norway. It is situated along the borders of the municipalities of Suldal and Hjelmeland and Bykle, Norway. It has an installed capacity of approximately 2,100 megawatts (2,800,000 hp), and the annual average production is 4.45 TWh (16.0 PJ) (1987–2006), while its reservoir capacity is about 7.8 TWh (28 PJ); at full production, it can last seven to eight months. The complex includes the artificial lake Blåsjø, which is made by dams around 1,000 metres (3,300 ft) above the sea level. The hydroelectric power stations in the complex are Saurdal, Kvilldal, Hylen and Stølsdal, operated by Statkraft.

<span class="mw-page-title-main">Electricity sector in Denmark</span> Overview of the electricity sector in Denmark

Denmark's western electrical grid is part of the Synchronous grid of Continental Europe whereas the eastern part is connected to the Synchronous grid of Northern Europe via Sweden.

<span class="mw-page-title-main">Electricity sector in France</span> Overview of the electricity sector in France

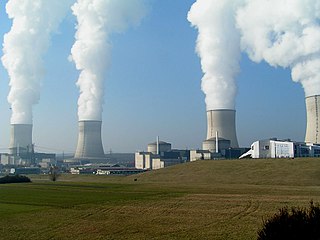
The electricity sector in France is dominated by its nuclear power, which accounted for 71.7% of total production in 2018, while renewables and fossil fuels accounted for 21.3% and 7.1%, respectively. France has the largest share of nuclear electricity in the world, and together with renewable energy supplies, this has helped its grid achieve very low carbon intensity.

<span class="mw-page-title-main">Electricity sector in Japan</span> Overview of the electricity sector in Japan

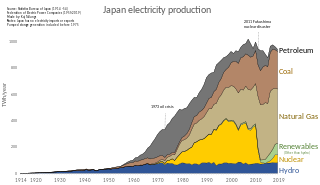
The electric power industry in Japan covers the generation, transmission, distribution, and sale of electric energy in Japan. Japan consumed approximately 918 terawatt-hours (TWh) of electricity in 2014. Before the 2011 Fukushima Daiichi nuclear disaster, about a quarter of electricity in the country was generated by nuclear power. In the following years, most nuclear power plants have been on hold, being replaced mostly by coal and natural gas. Solar power is a growing source of electricity, and Japan has the third largest solar installed capacity with about 50 GW as of 2017. Japan's electricity production is characterized by a diverse energy mix, including nuclear, fossil fuels, renewable energy, and hydroelectric power.

<span class="mw-page-title-main">Electricity sector in Spain</span> Overview of the electricity sector in Spain

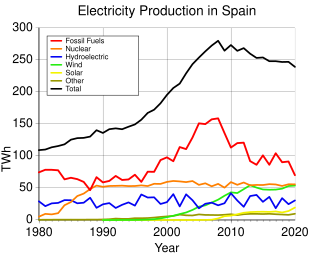
In 2023, Spain consumed 244,686 gigawatt hours (GWh) of electricity, a 2.3% decline from 2022.

<span class="mw-page-title-main">Electricity sector in the Netherlands</span>

The total electricity consumption of the Netherlands in 2021 was 117 terawatt-hours (TWh). The consumption grew from 7 TWh in 1950 by an average of 4.5% per year. In 2021, fossil fuels, such as natural gas and coal accounted for about 62% of the electricity produced electricity. Renewable energy sources, such as biomass, wind power, and solar power, produce 38% of the total electricity. One nuclear plant in the Netherlands, in Borssele, is responsible for about 3% of total generation. The majority of the electricity, more than 75%, is produced centrally by thermal and nuclear units.

Italy's total electricity consumption was 302.75 terawatt-hour (TWh) in 2020, of which 270.55 TWh (89.3%) was produced domestically and the remaining 10.7% was imported.

<span class="mw-page-title-main">Electricity sector in Belgium</span> Overview of the electricity sector in Belgium

The electricity sector in Belgium describes electricity in Belgium. Production by power source in 2009 was 53% nuclear, 40% fossil electricity and 7% renewable electricity. 2% of production was exported in 2009. In 2008 import was 11%. Belgium is highly nuclear dependent country where the share of renewable electricity has been low. The share of renewable electricity was about 2% in 2005. Plan for 2020 is wind 10.5 TWh (9.5%), biomass 11 TWh and PV 1 TWh.

<span class="mw-page-title-main">Electricity sector in Switzerland</span> Overview of the electricity sector in Switzerland

The electricity sector in Switzerland relies mainly on hydroelectricity, since the Alps cover almost two-thirds of the country's land mass, providing many large mountain lakes and artificial reservoirs suited for hydro power. In addition, the water masses drained from the Swiss Alps are intensively used by run-of-the-river hydroelectricity (ROR). With 9,052 kWh per person in 2008, the country's electricity consumption is relatively high and was 22% above the European Union's average.

<span class="mw-page-title-main">Energy in Sweden</span> Overview of energy use in Sweden

Energy in Sweden describes energy and electricity production, consumption and import in Sweden. Electricity sector in Sweden is the main article of electricity in Sweden. The Swedish climate bill of February 2017 aims to make Sweden carbon neutral by 2045. The Swedish target is to decline emission of climate gases 63% from 1990 to 2030 and international transportation excluding foreign flights 70%. By 2014 just over half of the country's total final energy consumption in electricity, heating and cooling and transport combined was provided by renewables, the highest share amongst the then 28 EU member countries. About a third of Sweden's electricity is generated by nuclear power. In generating a year's worth of this energy, Swedes generate about 4 tonnes of CO2 emissions each. Since 2010, sustainability measures have reduced total emissions even as the population has increased.

<span class="mw-page-title-main">Energy in Georgia (country)</span> Energy generation and consumption in Georgia

Georgia had a total primary energy supply (TPES) of 4.793 Mtoe in 2016. Electricity consumption was 11.5 TWh in 2016. Electricity production was 11.6 TWh, of which 81% from hydroelectricity and 19% from natural gas.

Myanmar had a total primary energy supply (TPES) of 16.57 Mtoe in 2013. Electricity consumption was 8.71 TWh. 65% of the primary energy supply consists of biomass energy, used almost exclusively (97%) in the residential sector. Myanmar’s energy consumption per capita is one of the lowest in Southeast Asia due to the low electrification rate and a widespread poverty. An estimated 65% of the population is not connected to the national grid. Energy consumption is growing rapidly, however, with an average annual growth rate of 3.3% from 2000 to 2007.

<span class="mw-page-title-main">Electricity sector in Portugal</span> Overview of the electricity sector in Portugal

In 2008, Net electricity use in Portugal was 51.2 TWh. Portugal imported 9 TWh electricity in 2008. Population was 10.6 million.

References

  1. 1 2 3 4 5 6 "Electricity". Statistics Norway. 2022-07-19. Retrieved 2022-08-03.
  2. "Electricity, annual figures, 2012".
  3. "Norway could be Europe's green battery" . Retrieved 2017-09-04.
  4. "Hydropower completes greening of Norway". ScienceDaily. Retrieved 2017-09-04.
  5. "Vannkraftpotensialet". Norwegian Water Resources and Energy Directorate . 10 December 2015. Archived from the original on 18 January 2017. Retrieved 8 February 2016.
  6. 1 2 "Electricity, annual figures, 2011". ssb.no. 20 March 2013.
  7. Østensen, Inger. "Fakta – Energi- og vannressurser i Norge 2013 page 24-28. http://www.regjeringen.no. Olje- og energidepartementet, november 2012. ISSN   0809-9464.
  8. Energy, Ministry of Petroleum and (2016-04-15). "White Paper on Norway's energy policy: Power for Change". Government.no. Retrieved 2017-10-09.
  9. Energy in Sweden, Facts and figures, The Swedish Energy Agency, (in Swedish: Energiläget i siffror), Table: Specific electricity production per inhabitant with breakdown by power source (kWh/person), Source: IEA/OECD 2006 T23 Archived July 4, 2011, at the Wayback Machine , 2007 T25 Archived July 4, 2011, at the Wayback Machine , 2008 T26 Archived July 4, 2011, at the Wayback Machine , 2009 T25 Archived January 20, 2011, at the Wayback Machine and 2010 T49 Archived October 16, 2013, at the Wayback Machine
  10. 1 2 Norway numbers extracted from Energy in Sweden, Facts and figures, The Swedish Energy Agency, (in Swedish: Energiläget i siffror), Table: Specific electricity production per inhabitant with breakdown by power source (kWh/person), Source: IEA/OECD 2006 T23 Archived July 4, 2011, at the Wayback Machine , 2007 T25 Archived July 4, 2011, at the Wayback Machine , 2008 T26 Archived July 4, 2011, at the Wayback Machine , 2009 T25 Archived January 20, 2011, at the Wayback Machine and 2010 T49 Archived October 16, 2013, at the Wayback Machine .
  11. 1 2 "Annual Reports" (PDF). ieawind.org.[ dead link ]
  12. "About us - Statnett". 6 February 2024.
  13. "Vestre korridor - Projects - Statnett". Archived from the original on 2016-03-11. Retrieved 2016-02-23.
  14. "Aurland-Sogndal". Statnett. 2020. Archived from the original on 5 March 2021.
  15. "Oppstart av arbeid på Vestre korridor - Nettutvikling - Statnett". 9 February 2024.
  16. "NORD.LINK - Projects - Statnett". 6 February 2024.
  17. "Cable to the UK - Projects - Statnett". Archived from the original on 2014-10-30. Retrieved 2016-02-23.
  18. Lie, Øyvind. "Nye utenlandskabler tvinger fram mer fleksibel kraftproduksjon" Teknisk Ukeblad , 22 January 2015. Accessed: 22 January 2015.
  19. Nilsen, Jannicke. "«Nina» tok strømmen fra 170.000. Prisen for å sikre kraftnettet: 8 milliarder" Teknisk Ukeblad , 12 January 2015. Accessed: 12 January 2015.
  20. Dalløkken, Per Erlien (21 January 2015). "Norsk selskap løste Renaults ladeproblem med oljeteknologi". tu.no. Retrieved 22 January 2015.
  21. "Electric power supply system of railways in Norway". Archived from the original on 2013-04-18.
  22. "Lower electricity prices in 2015". ssb.no. 25 February 2016.
  23. Lie, Øyvind (6 June 2012). "Så mye dyrere blir strømmen av utenlandskabler". Teknisk Ukeblad . Retrieved 12 January 2015.
  24. "Hydropower in Norway, page 15" (PDF). Archived from the original (PDF) on 2014-01-12. Retrieved 2014-07-17.
  25. Energy, Ministry of Petroleum and (2016-07-20). "The History of Norwegian Hydropower in 5 Minutes". Government.no. Retrieved 2017-10-09.
  26. "Energy Policies of IEA Countries - Norway" (PDF). IEA. 2017. Archived from the original (PDF) on October 13, 2017. Retrieved October 9, 2017.
  27. "Hydropower generation in Europe 2016 | Statistic". Statista. Retrieved 2017-10-09.
  28. "IEA Key Stats 2010" (PDF). iea.org.
  29. "Norway | International Hydropower Association". www.hydropower.org. Retrieved 2017-10-09.
  30. "Vindkraft - NVE".
  31. "Wind Energy in Norway" . Retrieved 17 August 2023.
  32. Renewables Global Status Report: REN 21 Paris 13.5.2009 page 8
  33. "Global Market Outlook for Photovoltaics 2014-2018" (PDF). www.epia.org. EPIA - European Photovoltaic Industry Association. p. 24. Archived from the original (PDF) on 25 June 2014. Retrieved 12 June 2014.
  34. Holm, Øystein (2016). "Norwegian IEA PVPS Task 1 representative" (PDF). IEA. Retrieved 6 September 2017.
  35. "Bright future for solar energy in the north". sciencenordic.com. Retrieved 2017-10-09.
  36. "The solar revolution and what it can mean for Norway" (in Norwegian Bokmål). Norwegian Board of Technology. 2017-05-11. Retrieved 2017-10-09.
  37. "Orkla sells Elkem to China National Bluestar". Archived from the original on July 10, 2011.
  38. "Start page".
  39. Lie, Øyvind (2014-10-03). "Taper 100 millioner i året - nå stenges Kårstø-kraftverket". Tu.no. Retrieved 2024-02-04.
  40. "Statkraft vurderer pilotanlegg for saltkraft på Sunndalsøra - Statkraft". statkraft.no.
  41. "Old Contains the Old Folder Structure" (PDF). statkraft.no.
  42. IEA. "Norway: Electricity and Heat for 2015 Archived 2018-04-21 at the Wayback Machine " IEA, 2018. Accessed: 20 April 2018.
  43. "Energy-Charts". energy-charts.info.
  44. Bach, Paul-Frederik. "Bottlenecks in the Nordic Grids during the Storm “Urd”" page 3. 10 January 2017
  45. Energy in Sweden 2010 page 81
  46. Lind, Anton. "600 kilometer søkabel skal føre strøm mellem Norge og Danmark" Danmarks Radio , 12 March 2015. Accessed: 13 March 2015.
  47. Berlin, Oliver Moody. "Angela Merkel unveils €1.8bn NordLink green power line to Norway".

Further reading