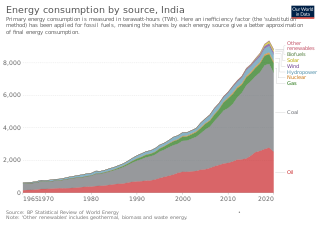
India is the third largest producer of electricity in the world. The national electric grid in India has an installed capacity of 403.759 GW as of 30 June 2022. Renewable power plants, which also include large hydroelectric plants, constitute 39.2% of total installed capacity. During the fiscal year (FY) 2019–20, the gross electricity generated by utilities in India was 1,383.5 TWh and the total electricity generation in the country was 1,598 TWh. The gross electricity consumption in FY2019 was 1,208 kWh per capita. In FY2015, electric energy consumption in agriculture was recorded as being the highest (17.89%) worldwide. The per capita electricity consumption is low compared to most other countries despite India having a low electricity tariff.

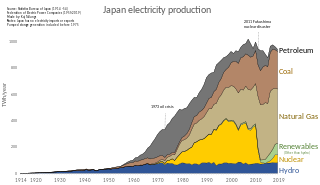
Energy in Japan refers to energy and electricity production, consumption, import and export in Japan. The country's primary energy consumption was 477.6 Mtoe in 2011, a decrease of 5% over the previous year.

Energy in the United Kingdom came mostly from fossil fuels in 2021. Total energy consumption in the United Kingdom was 142.0 million tonnes of oil equivalent in 2019. In 2014, the UK had an energy consumption per capita of 2.78 tonnes of oil equivalent compared to a world average of 1.92 tonnes of oil equivalent. Demand for electricity in 2014 was 34.42 GW on average coming from a total electricity generation of 335.0 TWh.

Lamma Power Station, informally known as Lamma Island Power Station, is a thermal power station and solar farm in Po Lo Tsui, Lamma Island, Hong Kong. With an installed capacity of 3,617 MW, the power station is the second largest coal-fired power station in Hong Kong after Castle Peak Power Station.

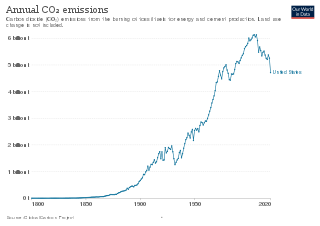
Energy in the United States came mostly from fossil fuels in 2021 as 36% of the nation's energy originated from petroleum, 32% from natural gas, and 11% from coal. Nuclear power supplied 8% and renewable energy supplied 12%, which includes hydroelectric dams, biomass, wind, geothermal, and solar.
The energy policy of India is to increase energy in India and reduce energy poverty, with more focus on developing alternative sources of energy, particularly nuclear, solar and wind energy. India attained 63% overall energy self-sufficiency in 2017.

Brazil is the 10th largest energy consumer in the world and the largest in South America. At the same time, it is an important oil and gas producer in the region and the world's second largest ethanol fuel producer. The government agencies responsible for energy policy are the Ministry of Mines and Energy (MME), the National Council for Energy Policy (CNPE), the National Agency of Petroleum, Natural Gas and Biofuels (ANP) and the National Agency of Electricity (ANEEL). State-owned companies Petrobras and Eletrobras are the major players in Brazil's energy sector, as well as Latin America's.

Ensuring adequate energy supply to sustain economic growth has been a core concern of the Chinese government since 1949. The country is the world's largest emitter of greenhouse gases, and coal in China is a major cause of global warming. However, from 2010 to 2015 China reduced energy consumption per unit of GDP by 18%, and CO2 emissions per unit of GDP by 20%. On a per-capita basis, it was the world's 51st largest emitter of greenhouse gases in 2016. China is also the world's largest renewable energy producer. China is the largest producer of hydroelectricity, solar power and wind power in the world. The energy policy of China is connected to its industrial policy. The goals of China's industrial policy dictate its energy needs.

China is the world's leading country in electricity production from renewable energy sources, with over triple the generation of the second-ranking country, the United States. China's renewable energy sector is growing faster than its fossil fuels and nuclear power capacity, and is expected to contribute 43 percent of global renewable capacity growth. China's total renewable energy capacity exceeded 1,000GW in 2021, accounting for 43.5 per cent of the country's total power generation capacity, 10.2 percentage points higher than in 2015. The country aims to have 80 per cent of its total energy mix come from non-fossil fuel sources by 2060, and achieve a combined 1,200GW of solar and wind capacity by 2030.

Since 2013, total primary energy consumption in India has been the third highest in the world after China and United States. India is the second-top coal consumer in the year 2017 after China. India ranks third in oil consumption with 22.1 crore tons in 2017 after United States and China. India is net energy importer to meet nearly 47% of its total primary energy in 2019.

Energy in Mexico describes energy and electricity production, consumption and import in Mexico.

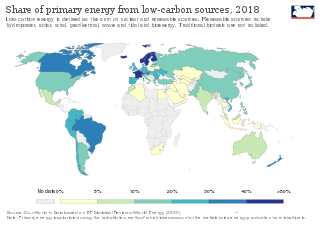
Low-carbon power is electricity produced with substantially lower greenhouse gas emissions than conventional fossil fuel power generation. The energy transition to low-carbon power is one of the most important actions required to limit climate change. Power sector emissions may have peaked in 2018. During the first six months of 2020, scientists observed an 8.8% decrease in global CO2 emissions relative to 2019 due to COVID-19 lockdown measures. The two main sources of the decrease in emissions included ground transportation (40%) and the power sector (22%). This event is the largest absolute decrease in CO2 emissions in history, but emphasizes that low-carbon power "must be based on structural and transformational changes in energy-production systems".
Nordic electricity market is a common market for electricity in the Nordic countries. It is one of the first free electric-energy markets in Europe and is traded in NASDAQ OMX Commodities Europe and Nord Pool Spot. In 2003, the largest market shares were as follows: Vattenfall 17%, Fortum 14.1%, Statkraft 8.9%, E.on 7.5%, Elsam 5%, Pohjolan Voima 5%. Other producers had 42.5% market share.

Energy in Finland describes energy and electricity production, consumption and import in Finland. Energy policy of Finland describes the politics of Finland related to energy. Electricity sector in Finland is the main article of electricity in Finland.

China's electric power industry is the world's largest electricity producer, passing the United States in 2011 after rapid growth since the early 1990s. In 2019, China produced more electricity than the next three countries—U.S., India, and Russia—combined.

India is world's 3rd largest consumer of electricity and world's 3rd largest renewable energy producer with 40% of energy capacity installed in the year 2022 coming from renewable sources. Ernst & Young's (EY) 2021 Renewable Energy Country Attractiveness Index (RECAI) ranked India 3rd behind USA and China. In November 2021, India had a renewable energy capacity of 150 GW consisting of solar, wind, small hydro power, bio-mass, large hydro, and nuclear. India has committed for a goal of 500 GW renewable energy capacity by 2030.
Energy in Ethiopia is energy and electricity production, consumption, transport, exportation, and importation in Ethiopia.

The United Kingdom has a National Grid that covers most of mainland Great Britain and several of the surrounding islands, as well as some connectivity to other countries. The electrical sector supplies power at 50 Hz AC, and ~240 volts is supplied to consumers. In 2020 the electricity sector's grid supply came from 55% low-carbon power, 36.1% fossil fuelled power, and 8.4% imports. Renewable power is showing strong growth, while fossil fuel generator use in general and coal use in particular is shrinking, with historically dominant coal generators now mainly being run in winter due to pollution and costs, and contributed just 1.6% of the supply in 2020.

The Hongkong Electric Company is one of Hong Kong's two main electricity generation companies, the other being China Light & Power. The company is owned by several companies including Power Assets Holdings, State Grid Corporation of China, Cheung Kong Infrastructure Holdings and Qatar Investment Authority. It was the first company to provide electricity in Hong Kong, having run continually since the 19th century.

Electricity sector in Hong Kong ranges from generation, transmission, distribution and sales of electricity covering Hong Kong. The combustion of coal, natural gas and oil are the main sources of electricity in Hong Kong. The electricity sector contributes 60.4% of Hong Kong's total greenhouse gas emissions.


