Ethnic groups in Latin America

Last updated

Benito Juarez was an Amerindian Mexican of Zapotec ancestry. BenitoJuarez.jpg
Benito Juárez was an Amerindian Mexican of Zapotec ancestry.

The inhabitants of Latin America are from a variety of ancestries, ethnic groups and races, making the region one of the most diverse in the world. [1] The specific composition of the group varies from country to country. Many have a predominance of European-Amerindian or Mestizo population; in others, Amerindians are a majority; some are dominated by inhabitants of European ancestry; and some countries' populations have large African or Mulatto populations.

Contents

Overview

According to Jon Aske:

Before Hispanics became such a 'noticeable' group in the U.S., the distinction between black and white was the major racial division and according to the one-drop rule adhered to by the culture at large, one drop of African ancestry usually meant that the person was Black. ...

The notion of racial continuum and a separation of race (or skin color) and ethnicity, on the other hand, is the norm in most of Latin America. In the Spanish and Portuguese empires, racial mixing or miscegenation was the norm and something that the Spanish and Portuguese had grown rather accustomed to during the hundreds of years of contact with Arabs and North Africans in the Iberian peninsula. But, demographics may have made this inevitable as well. Thus, for example, of the approximately 13.5 million people who lived in the Spanish colonies in 1800 before independence only about one fifth were white. This contrasts with the U.S., where more than four fifths were whites (out of a population of 5.3 million in 1801, 900,000 were slaves, plus approximately 60,000 free blacks). ...

The fact of the recognition of a racial continuum in Hispanic American (sic) does not mean that there wasn't discrimination, which there was, or that there wasn't an obsession with race, or 'castes', as they were sometimes called. ...

In areas with large indigenous Amerindian populations, a racial mixture resulted, which is known in Spanish as mestizos ... who are a majority in Mexico, Central America and most of South America. Similarly, when African slaves were brought to the Caribbean region and Brazil, where there was very little indigenous presence left, unions between them and Spanish produced a population of mixed mulatos ... who are a majority of the population in many of those Spanish-speaking Caribbean basin countries (Cuba, Dominican Republic, Puerto Rico, Colombia, and Venezuela).

[2]

Aske has also written that:

Spanish colonization was rather different from later English, or British, colonization of North America. They had different systems of colonization and different methods of subjugation. While the English were primarily interested in grabbing land, the Spanish in addition had a mandate to incorporate the land's inhabitants into their society, something which was achieved by religious conversion and sexual unions which produced a new 'race' of mestizos, a mixture of Europeans and indigenous peoples. mestizos (sic) form the majority of the population in Mexico, Central America, and much of South America. Racial mixing or miscegenation, after all, was something that the Spanish and Portuguese had been accustomed to during the hundreds of years of contact with Arabs and North Africans. Similarly, later on, when African slaves were introduced into the Caribbean basin region, unions between them and Spaniards produced a population of mulatos, who are a majority of the population in the Caribbean islands (the Antilles) (Cuba, Dominican Republic, Puerto Rico), as well as other areas of the Caribbean region (Colombia, Venezuela and parts of the Central American Caribbean coast). mestizos (sic) and mulatos may not have always have been first class citizens in their countries, but they were never disowned in the way the outcomes of unions of Europeans and Native Americans were in the British colonies, where interracial marriages were taboo and one drop of Black or Amerindian blood was enough to make the person 'impure'.

[3]

In his famous 1963 book The Rise of the West , William Hardy McNeill wrote that:

Racially mixed societies arose in most of Spanish and Portuguese America, compounded in varying proportions from European, Indian, and Negro strands. Fairly frequent resort to manumission mitigated the hardships of slavery in those areas; and the Catholic church positively encouraged marriages between white immigrants and Indian women as a remedy for sexual immorality. However, in the southern English colonies and in most of the Caribbean islands, the importation of Negro slaves created a much more sharply polarized biracial society. Strong race feeling and the servile status of nearly all Negroes interdicted intermarriage, practically if not legally. Such discrimination did not prevent interbreeding; but children of mixed parentage were assigned to the status of their mothers. Mulattoes and Indian half-breeds were thereby excluded from the white community. In Spanish (and, with some differences, Portuguese) territories a more elaborate and less oppressive principle of racial discrimination established itself. The handful of persons who had been born in the homelands claimed topmost social prestige; next came those of purely European descent; while beneath ranged the various racial blends to form a social pyramid whose numerous racial distinctions meant that no one barrier could become as ugly and inpenetrable as that dividing whites from Negroes in the English, Dutch, and French colonies.

[4]

Thomas C. Wright, meanwhile, has written that:

The demographic makeup of colonial Latin America became more complex when, as the native population declined, the Portuguese, Spanish, and the French in Haiti turned to Africa for labor, as did the British in North America. The tricontinental heritage that characterizes Latin America, then, is shared by the United States, but even a casual examination reveals that the outcome of the complex interaction of different peoples has varied. While miscegenation among the three races certainly occurred in North America, it appears to have been much less common than in Latin America. Furthermore, offspring of such liaisons were not recognized as belonging to new, distinct racial categories in North America as they were in Latin America. The terms mestizo or mameluco, mulatto, the general term castas, and dozens of subcategories of racial identity frankly recognized the outcomes of interracial sexual activity in Latin America and established a continuum of race rather than the unrealistic absolute categories of white, black, or Indian as used in the United States. (The U.S. Census Bureau's forms did not allow individuals to list more than one race until 2000.)

[5]

Racial and ethnic groups

Census and other sources

This is a list of ethnic groups based on national or other sources.

Country Amerindian White Mestizo Mulatto Black Asian Pardo or Mixed Garifuna or Zambo OtherUndeclaredType of studyYear
Flag of Argentina.svg  Argentina [18] 2.4%0.0%0.0%0.0%0.4%0%0.0%0.0%0.0%97.2%Census2010
Bandera de Bolivia (Estado).svg  Bolivia [19] 37.0%3.0%52.0%0.0%1.0%0.0%0.0%0.0%0.0%7.0%Household survey2013
Flag of Brazil.svg  Brazil [20] 0.43%47.73%0.0%0.0%7.61%1.09%43.13%0.0%0.0%0.0%Census2010
Flag of Chile.svg  Chile [21] 6.0%61.0%27.0%0.0%0.0%0.0%0.0%0.0%2.0%4.0%Household survey2006
Flag of Colombia.svg  Colombia [22] 4.31%0.0%0.0%0.0%6.68%0.0%0.0%0.0%0.01%89.0%Census2018
Flag of Costa Rica.svg  Costa Rica [23] 2.42%0.0%0.0%6.72%1.05%0.21%0.0%0.0%87.37%2.21%Census2011
Flag of Cuba.svg  Cuba [24] 0.0%64.1%0.0%0.0%9.3%0.0%26.6%0.0%0.0%0.0%Census2012
Flag of the Dominican Republic.svg  Dominican Republic [25] 0.0%13.6%0.0%67.6%18.3%0.0%0.0%0.0%0.0%0.0%Household survey2006
Flag of Ecuador.svg  Ecuador [26] 7.0%6.1%71.9%1.9%5.3%0.0%0.0%0.0%7.8%0.0%Census2010
Flag of El Salvador.svg  El Salvador [27] 0.2%12.7%86.3%0.0%0.1%0.0%0.0%0.0%0.6%0.0%Census2007
Flag of Guatemala.svg  Guatemala [28] 43.43%0.0%56.01%0.0%0.19%0.0%0.0%0.13%0.24%0.0%Census2018
Flag of Honduras.svg  Honduras [29] 7.24%7.87%82.94%0.0%1.39%0.0%0.0%0.0%0.55%0.0%Census2013
Flag of Mexico.svg  Mexico [30] 9.35%0.0%0.0%0.0%2.04%0.0%0.0%0.0%0.0%88.61%Household survey2020
Flag of Nicaragua.svg  Nicaragua [31] 2.07%0.0%0.0%0.0%0.0%0.0%0.0%2.79%3.75%91.36%Census2005
Flag of Panama.svg  Panama [32] 12.3%0.0%0.0%0.0%9.2%0.0%0.0%0.0%0.0%78.5%Census2010
Flag of Paraguay.svg  Paraguay [33] 1.8%0.0%0.0%0.0%0.0%0.0%0.0%0.0%0.0%98.2%Census2012
Flag of Peru.svg  Peru [34] 25.7%5.9%60.2%0.0%3.6%0.2%0.0%0.0%1.1%3.3%Census2017
Flag of Puerto Rico.svg  Puerto Rico [35] 0.5%17.1%0.0%0.0%7.0%0.1%49.8%0.0%32.5%0.0%Census2020
Flag of Uruguay.svg  Uruguay [36] 2.4%87.7%0.0%0.0%4.6%0.2%0.0%0.0%0.1%4.9%Census2011
Flag of Venezuela.svg  Venezuela [37] 0.0%43.6%0.0%0.0%3.6%0.0%51.6%0.0%1.2%0.0%Census2011

According to Lizcano

The following table contains information based on a 2014 non-genetic work entitled "Composición Étnica de las Tres Áreas Culturales del Continente Americano al Comienzo del Siglo XXI" ("Ethnic Composition of the Three Cultural Areas of the American Continent at the Beginning of the 21st Century") by National Autonomous University of Mexico professor Francisco Lizcano Fernández.

Lizcano compiled his estimation of groups based on criteria of cultural patterns, not on genotypes nor even phenotype. [7] In these estimations, therefore, "whites" encompasses all those whose practiced culture is predominantly Iberian-derived, while "mestizos" encompasses those whose practiced culture noticeably mixes Iberian and Amerindian cultural traditions, and "Amerindians" only those whose practiced culture is predominantly indigenous.

The resulting effect of employing these criteria, therefore, skews the figure of said groups if they had been based on genetic factors, or even based on phenotypic factors. Thus, for instance, the estimate of "whites" given for Chile would include mostly genetic mestizos, while the estimate of "mestizos" in Mexico would include not only a significant proportion of genetic Amerindians, but also many genetic whites, and so on for other countries.

CountryPopulation
2014 [38]
Whites Mestizos Mulattoes Amerindians Blacks Asians Creoles &
Garifunas
Flag of Argentina.svg  Argentina 41,769,72685.0%12.0%0.0%1.0%0.0%2.0%0.0%
Bandera de Bolivia (Estado).svg  Bolivia 10,118,68315.0%28.0%2.0%55.0%0.0%0.0%0.0%
Flag of Brazil.svg  Brazil 203,429,77353.8%0.0%39.1%0.4%6.2%0.5%0.0%
Flag of Chile.svg  Chile 17,300,00052.7%39.3%0.0%8.0%0.0%0.0%0.0%
Flag of Colombia.svg  Colombia 41,725,54320.0%53.2%21.0%1.8%3.9%0.0%0.1%
Flag of Costa Rica.svg  Costa Rica 4,576,56282.0%15.0%0.0%0.8%0.0%0.2%2.0%
Flag of Cuba.svg  Cuba 11,087,33037.0%0.0%51.0%0.0%11.0%1.0%0.0%
Flag of the Dominican Republic.svg  Dominican Republic 9,956,64814.6%0.0%75.0%0.0%7.7%0.4%2.3%
Flag of Ecuador.svg  Ecuador 16,888,7609.9%41.0%5.0%39.0%5.0%0.1%0.0%
Flag of El Salvador.svg  El Salvador 6,071,7741.0%91.0%0.0%8.0%0.0%0.0%0.0%
Flag of Guatemala.svg  Guatemala 13,824,4634.0%42.0%0.0%53.0%0.0%0.8%0.2%
Flag of Honduras.svg  Honduras 8,143,5641.0%85.6%1.7%7.7%0.0%0.7%3.3%
Flag of Mexico.svg  Mexico 121,724,22615.0%70.0%0.5%14.0%0.0%0.5%0.0%
Flag of Nicaragua.svg  Nicaragua 5,666,30114.0%78.3%0.0%6.9%0.0%0.2%0.6%
Flag of Panama.svg  Panama 3,989,13310.0%32.0%27.0%8.0%5.0%4.0%14.0%
Flag of Paraguay.svg  Paraguay 6,759,05820.0%74.5%3.5%1.5%0.0%0.5%0.0%
Flag of Peru.svg  Peru 30,814,17512.0%32.0%9.7%45.5%0.0%0.8%0.0%
Flag of Puerto Rico.svg  Puerto Rico 3,308,53574.8%0.0%10.0%0.0%15.0%0.2%0.0%
Flag of Uruguay.svg  Uruguay 3,460,46288.0%8.0%4.0%0.0%0.0%0.0%0.0%
Flag of Venezuela.svg  Venezuela 27,635,74316.9%37.7%37.7%2.7%2.8%2.2%0.0%
Total579,092,57036.1%30.3%20.3%9.2%3.2%0.7%0.2%

Note: "Creoles" refer to people of African descent originated in British and French colonies. [7]

According to Latinobarometro

The following table shows how Latin Americans answer the question What race do you consider yourself to belong to? in the Latinobarometro survey. [39]

Country Mestizos Whites Amerindians Blacks Mulattoes Asians Other race
Flag of Argentina.svg  Argentina 28%56%5%3%1%1%7%
Bandera de Bolivia (Estado).svg  Bolivia 63%5%28%1%1%0%3%
Flag of Brazil.svg  Brazil 16%37%3%23%12%0%9%
Flag of Chile.svg  Chile 20%73%5%0%1%0%1%
Flag of Colombia.svg  Colombia 47%25%10%9%6%1%2%
Flag of Costa Rica.svg  Costa Rica 34%37%9%4%17%0%0%
Flag of the Dominican Republic.svg  Dominican Republic 29%16%6%17%25%1%6%
Flag of Ecuador.svg  Ecuador 87%3%5%2%3%0%0%
Flag of El Salvador.svg  El Salvador 60%16%16%3%5%0%0%
Flag of Guatemala.svg  Guatemala 37%7%48%1%5%1%0%
Flag of Honduras.svg  Honduras 49%19%10%8%17%0%1%
Flag of Mexico.svg  Mexico 58%9%21%1%2%1%7%
Flag of Nicaragua.svg  Nicaragua 63%15%10%4%4%0%0%
Flag of Panama.svg  Panama 43%12%18%22%5%1%0%
Flag of Paraguay.svg  Paraguay 65%22%6%3%0%0%3%
Flag of Peru.svg  Peru 77%5%7%2%1%0%8%
Flag of Uruguay.svg  Uruguay 12%74%4%4%4%0%3%
Flag of Venezuela.svg  Venezuela 43%31%8%7%9%0%3%
Total46%27%11%6%6%0%3%

Racial distribution

Indigenous distribution by country

Percentage of indigenous peoples in relation to the total population of each country
Country or RegionPercent of the Population
Bandera de Bolivia (Estado).svg  Bolivia 44% [40]
Flag of Guatemala.svg  Guatemala 42% [41]
Flag of Peru.svg  Peru 25.8% [42]
Flag of Chile.svg  Chile 12.8% [43]
Flag of Panama.svg  Panama 12.5% [44]
Flag of Colombia.svg  Colombia 10.4% [45]
Flag of Mexico.svg  Mexico 9.36% [46]
Flag of Ecuador.svg  Ecuador 7% [47]
Flag of Honduras.svg  Honduras 7% [48]
Flag of Nicaragua.svg  Nicaragua 5% [49]
Flag of Venezuela.svg  Venezuela 2.7% [50]
Flag of Argentina.svg  Argentina 2.4% [51]
Flag of Costa Rica.svg  Costa Rica 2.4% [52]
Flag of Uruguay.svg  Uruguay 2.4% [53]
Flag of Paraguay.svg  Paraguay 1.8% [54]
Flag of Brazil.svg  Brazil 0.8% [55]
Flag of El Salvador.svg  El Salvador 0.2% [56]
Flag of Cuba.svg  Cuba ND
Flag of Haiti.svg  Haiti ND
Flag of Puerto Rico.svg  Puerto Rico ND
Flag of the Dominican Republic.svg  Dominican Republic ND

African distribution by country

Percentage of Africans in relation to the total population of each country
Country or RegionPercent of the Population
Flag of Haiti.svg  Haiti 95% [57]
Flag of Panama.svg  Panama 32.8% [58]
Flag of the Dominican Republic.svg  Dominican Republic 15.8% [59]
Flag of Brazil.svg  Brazil 10.2% [60]
Flag of Colombia.svg  Colombia 9.34% [61]
Flag of Cuba.svg  Cuba 9.3% [62]
Flag of Nicaragua.svg  Nicaragua 9% [49]
Flag of Puerto Rico.svg  Puerto Rico 7% [63]
Flag of Ecuador.svg  Ecuador 4.8% [7]
Flag of Uruguay.svg  Uruguay 4.6% [64]
Flag of Venezuela.svg  Venezuela 3.6% [65]
Flag of Peru.svg  Peru 3.6% [66]
Flag of Mexico.svg  Mexico 2.04% [67]
Flag of Honduras.svg  Honduras 2% [68]
Flag of Costa Rica.svg  Costa Rica 1.1% [69]
Flag of Argentina.svg  Argentina 0.37% [70]
Flag of Guatemala.svg  Guatemala 0.3% [71]
Bandera de Bolivia (Estado).svg  Bolivia 0.2% [72]
Flag of El Salvador.svg  El Salvador 0.13% [73]
Flag of Paraguay.svg  Paraguay 0.13% [74]
Flag of Chile.svg  Chile 0.06% [75]

White distribution by country

Percentage of Europeans in relation to the total population of each country
Country or RegionPercent of the Population
Flag of Uruguay.svg  Uruguay 88% [76]
Flag of Argentina.svg  Argentina 85% [77]
Flag of Costa Rica.svg  Costa Rica 82.7% [78]
Flag of Cuba.svg  Cuba 64.1% [62]
Flag of Chile.svg  Chile 52% [77]
Flag of Brazil.svg  Brazil 47.7% [79] [80]
Flag of Mexico.svg  Mexico 32% [81] [82] [83]
Flag of Venezuela.svg  Venezuela 30.3% [7] [84]
Flag of Colombia.svg  Colombia 28.5% [7] [85]
Flag of Paraguay.svg  Paraguay 25% [7]
Flag of the Dominican Republic.svg  Dominican Republic 17.8% [86]
Flag of Puerto Rico.svg  Puerto Rico 17.1% [87]
Flag of Nicaragua.svg  Nicaragua 15.5% [88]
Flag of El Salvador.svg  El Salvador 12.35% [89] [90]
Flag of Panama.svg  Panama 10% [91]
Flag of Peru.svg  Peru 5.9% [92]
Bandera de Bolivia (Estado).svg  Bolivia 5% [93]
Flag of Haiti.svg  Haiti 5% [57]
Flag of Guatemala.svg  Guatemala 4% [77]
Flag of Ecuador.svg  Ecuador 2.2% [94]
Flag of Honduras.svg  Honduras 1% [95] [96]

Mixed race distribution by country

Percentage of mestizos/mixed race in relation to the total population of each country [97]
Country or RegionPercent of the Population
Flag of Honduras.svg  Honduras 90%
Flag of El Salvador.svg  El Salvador 87.32%
Flag of Ecuador.svg  Ecuador 86%
Flag of Puerto Rico.svg  Puerto Rico 75.9%
Flag of Paraguay.svg  Paraguay 73.07%
Flag of Nicaragua.svg  Nicaragua 70.5%
Flag of the Dominican Republic.svg  Dominican Republic 66.4%
Flag of Peru.svg  Peru 64.7%
Flag of Venezuela.svg  Venezuela 63.4%
Flag of Mexico.svg  Mexico 56.6%
Flag of Guatemala.svg  Guatemala 53.7%
Flag of Colombia.svg  Colombia 51.76%
Bandera de Bolivia (Estado).svg  Bolivia 50.8%
Flag of Panama.svg  Panama 44.7%
Flag of Brazil.svg  Brazil 41.3%
Flag of Chile.svg  Chile 35.14%
Flag of Cuba.svg  Cuba 26.6%
Flag of Costa Rica.svg  Costa Rica 13.8%
Flag of Argentina.svg  Argentina 12.23%
Flag of Uruguay.svg  Uruguay 6%
Flag of Haiti.svg  Haiti ND

Genetic studies

Country European/
Caucasoid
(%)
Indigenous American
(%)
Subsaharan African
(%)
East Asian
(%)
YearSamplesNotes
Flag of Argentina.svg  Argentina [98] 78.517.34.202010246Nationwide
Bandera de Bolivia (Estado).svg  Bolivia [99] 24.671.10.73.62013720Nationwide
Flag of Brazil.svg  Brazil [100] 621721020158 733Meta-analysis (25 studies)
Flag of Chile.svg  Chile [101] 55.1642.382.4402015313Nationwide
Flag of Colombia.svg  Colombia [102] 424711020101 737Nationwide
Flag of Costa Rica.svg  Costa Rica [103] 61309020032 196Nationwide
Flag of Cuba.svg  Cuba [104] 71.126.8720.341.672018860Nationwide
Flag of the Dominican Republic.svg  Dominican Republic [105] 47124202016-Estimation
Flag of Ecuador.svg  Ecuador [106] 33511302019240Nationwide
Flag of Haiti.svg  Haiti [107] 4.3095.50.32010111Nationwide
Flag of Honduras.svg  Honduras [105] 5042802016Estimation
Flag of Mexico.svg  Mexico [108] [109] 51.4942.915.300.32015-Nationwide (average of all samples)
Flag of Nicaragua.svg  Nicaragua [108] 52.134.313.602014151Nationwide
Flag of Panama.svg  Panama [110] 25.435.8738.72020024 202Nationwide
Flag of Paraguay.svg  Paraguay [111] 55.433.810.802021548Eastern region (97.5% of population)
Flag of Peru.svg  Peru [112] 2964702014906Nationwide (Mostly in Lima)
Flag of Puerto Rico.svg  Puerto Rico [113] 63.715.221.202011642Nationwide
Flag of El Salvador.svg  El Salvador [108] 46.748.86.502014200Nationwide
Flag of Uruguay.svg  Uruguay [114] 84.110.45.60200585Nationwide
Flag of Venezuela.svg  Venezuela [105] 56251902016-Estimation
Latin America 49.5632.2317.920.29--Average of all samples

Skin pigmentation

In Latin America, human skin color and ancestry are often conflated, with lighter skin commonly assumed as indicative of higher levels of European ancestry. [115] A 20th century study on Mexican Americans used skin reflectance data (a method of measuring the lightness or darkness of skin) as an estimation of European ancestry. [116] However, genetic evidence published in 2019 has challenged this presumption. A genome-wide association study of 6000 Latin Americans from Mexico, Brazil, Colombia, Chile and Peru found that the strongest correlation for light skin color in these populations was actually an amino acid variant of the MFSD12 gene; which is absent in Europeans, but very common in East Asians and Native Americans. [117] The presumption that lighter skin in Latin Americans is an indicator of European ancestry was somewhat unjustified, depending on the gene for light skin. [118]

Argentina

Genetically, the composition of Argentina is mostly European in ancestry, with Native American and African contributions.

A 2009 autosomal DNA study found that of the total Argentine population, 78.5 percent of the national genepool was European, 17.3 percent Native American, and 4.2 percent African. [98]

Enrique Maciel, an Argentine of Mulatto ancestry Enrique Maciel 1001.jpg
Enrique Maciel, an Argentine of Mulatto ancestry

An unweighted autosomal study of blood donors from 2012 found the following composition among samples in four regions of Argentina: 65% European, 31% Native American and 4% African. The study's conclusion was not to achieve a generalized autosomal average of the country, but rather the existence of genetic heterogeneity among differing sample regions. [119]

Brazil

Genetic studies have shown the Brazilian population as a whole to have European, African and Native American components.

An autosomal study from 2013, with nearly 1300 samples from all of the Brazilian regions, found a predominant degree of European ancestry combined with African and Native American contributions, in varying degrees. 'Following an increasing North to South gradient, European ancestry was the most prevalent in all urban populations (with values up to 74%). The populations in the North consisted of a significant proportion of Native American ancestry that was about two times higher than the African contribution. Conversely, in the Northeast, Center-West and Southeast, African ancestry was the second most prevalent. At an intrapopulation level, all urban populations were highly admixed, and most of the variation in ancestry proportions was observed between individuals within each population rather than among population'. [123]

Region [124] EuropeanAfricanNative American
North Region 51%17%32%
Northeast Region 56%28%16%
Central-West Region 58%26%16%
Southeast Region 61%27%12%
South Region 74%15%11%

An autosomal DNA study (2011), with nearly 1000 samples from all over the country ("whites", "pardos" and "blacks", according to their respective proportions), found a major European contribution, followed by a high African contribution and an important Native American component. [125] "In all regions studied, the European ancestry was predominant, with proportions ranging from 60.6% in the Northeast to 77.7% in the South". [126] The 2011 autosomal study samples came from blood donors (the lowest classes constitute the great majority of blood donors in Brazil [127] ), and also public health institutions' personnel and health students. The study showed that Brazilians from different regions are more homogenous than previously thought by some based on the census alone. "Brazilian homogeneity is, therefore, a lot greater between Brazilian regions than within Brazilian regions". [128]

Region [125] EuropeanAfricanNative American
Northern Brazil 68.80%10.50%18.50%
Northeast of Brazil 60.10%29.30%8.90%
Southeast Brazil 74.20%17.30%7.30%
Southern Brazil 79.50%10.30%9.40%

According to a DNA study from 2010, "a new portrayal of each ethnicity contribution to the DNA of Brazilians, obtained with samples from the five regions of the country, has indicated that, on average, European ancestors are responsible for nearly 80% of the genetic heritage of the population. The variation between the regions is small, with the possible exception of the South, where the European contribution reaches nearly 90%. The results, published by the scientific magazine American Journal of Human Biology by a team of the Catholic University of Brasília, show that in Brazil, physical indicators such as skin colour, colour of the eyes and colour of the hair have little to do with the genetic ancestry of each person, which has been shown in previous studies (regardless of census classification). [129] "Ancestry informative SNPs can be useful to estimate individual and population biogeographical ancestry. Brazilian population is characterized by a genetic background of three parental populations (European, African, and Brazilian Native Amerindians) with a wide degree and diverse patterns of admixture. In this work we analyzed the information content of 28 ancestry-informative SNPs into multiplexed panels using three parental population sources (African, Amerindian, and European) to infer the genetic admixture in an urban sample of the five Brazilian geopolitical regions. The SNPs assigned apart the parental populations from each other and thus can be applied for ancestry estimation in a three hybrid admixed population. Data was used to infer genetic ancestry in Brazilians with an admixture model. Pairwise estimates of F(st) among the five Brazilian geopolitical regions suggested little genetic differentiation only between the South and the remaining regions. Estimates of ancestry results are consistent with the heterogeneous genetic profile of Brazilian population, with a major contribution of European ancestry (0.771) followed by African (0.143) and Amerindian contributions (0.085). The described multiplexed SNP panels can be useful tool for bioanthropological studies but it can be mainly valuable to control for spurious results in genetic association studies in admixed populations". [130] It is important to note that "the samples came from free of charge paternity test takers, thus as the researchers made it explicit: "the paternity tests were free of charge, the population samples involved people of variable socioeconomic strata, although likely to be leaning slightly towards the ‘‘pardo’’ group". [131]

Region [131] EuropeanAfricanNative American
North Region 71.10%18.20%10.70%
Northeast Region 77.40%13.60%8.90%
Central-West Region 65.90%18.70%11.80%
Southeast Region 79.90%14.10%6.10%
South Region 87.70%7.70%5.20%

An autosomal DNA study from 2009 found a similar profile: "all the Brazilian samples (regions) lie more closely to the European group than to the African populations or to the Mestizos from Mexico". [132]

Region [133] EuropeanAfricanNative American
North Region 60.6%21.3%18.1%
Northeast Region 66.7%23.3%10.0%
Central-West Region 66.3%21.7%12.0%
Southeast Region 60.7%32.0%7.3%
South Region 81.5%9.3%9.2%

A 2015 autosomal genetic study, which also analysed data of 25 studies of 38 different Brazilian populations concluded that: European ancestry accounts for 62% of the heritage of the population, followed by the African (21%) and the Native American (17%). The European contribution is highest in Southern Brazil (77%), the African highest in Northeast Brazil (27%) and the Native American is the highest in Northern Brazil (32%). [100]

Region [100] EuropeanAfricanNative American
North Region 51%16%32%
Northeast Region 58%27%15%
Central-West Region 64%24%12%
Southeast Region 67%23%10%
South Region 77%12%11%

According to another autosomal DNA study from 2008, by the University of Brasília (UnB), European ancestry dominates in the whole of Brazil (in all regions), accounting for 65.90% of heritage of the population, followed by the African contribution (24.80%) and the Native American (9.3%). [134]

Juniti Saito, head of the Brazilian Air Force and one of over a million Japanese Brazilians Saito21022007.jpg
Juniti Saito, head of the Brazilian Air Force and one of over a million Japanese Brazilians

São Paulo state, the most populous state in Brazil, with about 40 million people, showed the following composition, according to an autosomal study from 2006: European genes account for 79% of the heritage of the people of São Paulo, 14% are of African origin, and 7% Native American. [135] A more recent study, from 2013, found the following composition in São Paulo state: 61.9% European, 25.5% African and 11.6% Native American. [123]

Chile

According to 1994 genetic research based on blood types, by Ricardo Cruz-Coke and Rodrigo Moreno, Chilean genetic admixture consists of 64% European, 35% Amerindian, and 1% African ancestry. [136] The European admixture goes from 81% in East Santiago to 61% in West Santiago. Valparaiso (Chilean central coast) and Concepción (central southern Chile) have 77% and 75% of European genetic admixture respectively. [136]

An autosomal DNA study from 2014 found the Chilean overall national genepool to be 44.34% (± 3.9%) Native American contribution, 51.85% (± 5.44%) European contribution, and 3.81% (± 0.45%) African contribution. [137] The samples came from all the 15 regions of Chile, and they were collected in Arica, as the researchers made it clear: "Beginning 2011, 923 volunteers from all 15 regions of Chile, living temporarily or permanently in Arica, with an average age of 28.05 ± 9.37 and belonging to social classes A and B (4%), CA and CB (60%) and D (36%) were invited to participate on this study". [137]

A 2015 autosomal DNA study found Chile to be 55.16% European, 42.38% Native American and 2.44% African (using LAMP-LD) and 43.22% Native American, 54.38% European and 2.40% African (using RFMix). [101]

Another 2015 autosomal DNA study carried out in two public hospitals found Chile to be 57.20% European, 38.70% Native American and 2.5% African. [138]

A 2020 autosomal DNA arrived at the following conclusion: "The country’s average ancestry was 0.53 ± 0.14 European, 0.04 ± 0.04 African, and 0.42 ± 0.14 Amerindian, disaggregated into 0.18 ± 0.15 Aymara and 0.25 ± 0.13 Mapuche. However, Mapuche ancestry was highest in the south (40.03%) and Aymara in the north (35.61%) as expected from the historical location of these ethnic groups". [139]

Chilean mitochondrial DNA and Y-chromosome studies indicate mostly Native American haplogroups on the maternal side and European haplogroups on the paternal side. [140] [141]

Colombia

(Rojas et al, 2010) points out the following genetic mixture for fourteen Colombian departments: [102]

DepartmentAmerindian contributionEuropean contributionAfrican contribution
Antioquia 26%63.5%10.3%
Antioquia (Peque)62.2%31.1%5.8%
Bolívar 32.9%23.3%43.8%
Caldas 36.4%59.6%4.3%
Casanare 74.7%24.5%0.8%
Cauca 56.9%19.6%23.5%
Chocó (Afro Colombians)10.8%21.1%68.1%
Chocó (Mestizos)44.8%46.6%8.6%
Cundinamarca 51.6%45.4%3%
Huila 60.8%39.6%0%
Magdalena 21.8%50%28.2%
Nariño 65.2%32.1%2.7%
Norte de Santander 53%42.2%4.7%
Quindío 38.3%57.3%4.4%
Santander 42.4%56.2%1.4%
Valle del Cauca 39.3%39.2%21.5%
Colombia 47%42%11%

A 2008 autosomal research from University of Brasilia determined that Colombian genetic admixture is 45.9% European, 33.8% Amerindian and 20.3% African. [122] A study from 2023 determined that the average Colombian (of all races) has a mixture of European 51%, native Amerindian 41%, and African 8%. [142] A study from 2010 involving 15 departments estimates the average Colombian (of all races) to be 42% European, 47% Amerindian, and 11% African. [102]

Some studies with samples collected in Paisa region, a genetically isolated population, found the highest European contribution in Colombia. For example, a 2014 genetic research found admixture to be 60% European, 29% Native and 11% African. [112]

An autosomal research from 2016 estimated genetic admixture in natural regions of Colombia. European ancestry was slighty predominant in Andean, Caribbean and Orinoquía regions (58%, 55% and 53%, respectively), with African ancestry being dominant in Pacific region (63%) and Native ancestry in Amazon region (65%). [143]

Natural regionEuropeanNative AmericanAfrican
Amazon Region 27.14%65.20%7.66%
Andean Region 57.99%34.61%7.4%
Caribbean Region 55.01%22.01%22.98%
Orinoquía Region 53.00%36.02%10.98%
Pacific Region 22.72%14.01%63.27%

The study also estimated admixture in six sub-regions of Andean Colombia. European admixture was higher in Central-West (67%), followed by Central-East and Northeast sub-regions (59% and 58%, respectively). Native ancestry was higher in Southwest (44%) and African ancestry in West sub-region (14%).

Sub-regionEuropeanNative AmericanAfrican
Central-East Sub-region 58.86%36.04%5.10%
Central-West Sub-region 66.91%25.22%7.87%
Northeast Sub-region 58.10%34.97%6.93%
Southeast Sub-region 54.54%37.34%8.12
Southwest Sub-region 48.65%44.28%7.07%
West Sub-region 55.43%30.54%14.04%

Costa Rica

Costa Rica was one of the more isolated populations of New Spain. Political divisions of Mexico 1821 (location map scheme).svg
Costa Rica was one of the more isolated populations of New Spain.

While the majority of Costa Ricans identify as of criollo or castizo descent, genetic studies demonstrate considerable pre-Columbian Amerindian and a smaller African ancestry.

According to an autosomal study, the genetic makeup of Costa Rica is 61% percent European, 30% percent Amerindian and 9% percent African. Regional variation was observed, with greater European influence in the northern (66%) and central (65%) regions . Increased Amerindian ancestry was found in the south (38%), and a higher African contribution in coastal regions (14% in the Pacific and 13% in the Atlantic). [103]

The Central Valley—where more than half of Costa Ricans live—has a mestizo population with one of the highest European components in Latin America,comparable with another areas with low pre-Columbian Native ancestry (then occupied by heterogeneous groups of hunter-gatherers) and where the current Native population is sparse. During the Spanish colonization of the Americas, Costa Rica was one of the more isolated regions in the Americas. According to genetic studies, the average Costa Rican from the Central Valley is 67 percent European, 29 percent Native and 4 percent Subsaharan African. [114]

Cuba

An autosomal study from 2014 has found the genetic ancestry in Cuba to be 72% European, 20% African and 8% Native American. [144]

Dominican Republic

According to a recent autosomal study, the genetic composition of the Dominican Republic was 51.2 percent European, 41.8 percent African and 8 percent Native. [145]

Ecuador

According to a 2010 DNA autosomal study, the genetic composition of genepool of Ecuadorians is 53.9% Native American, 38.8% European, and 7.3% African. [145]

Another genetic study shows Ecuadorias are 64.6% Native American, 31.0% European, and 4.4% African. [146]

According to a 2015 DNA autosomal study, the composition of Ecuador is: 50.1% Native American, 40.8% European, 6.8% African and 2.3% Asian. [138]

El Salvador

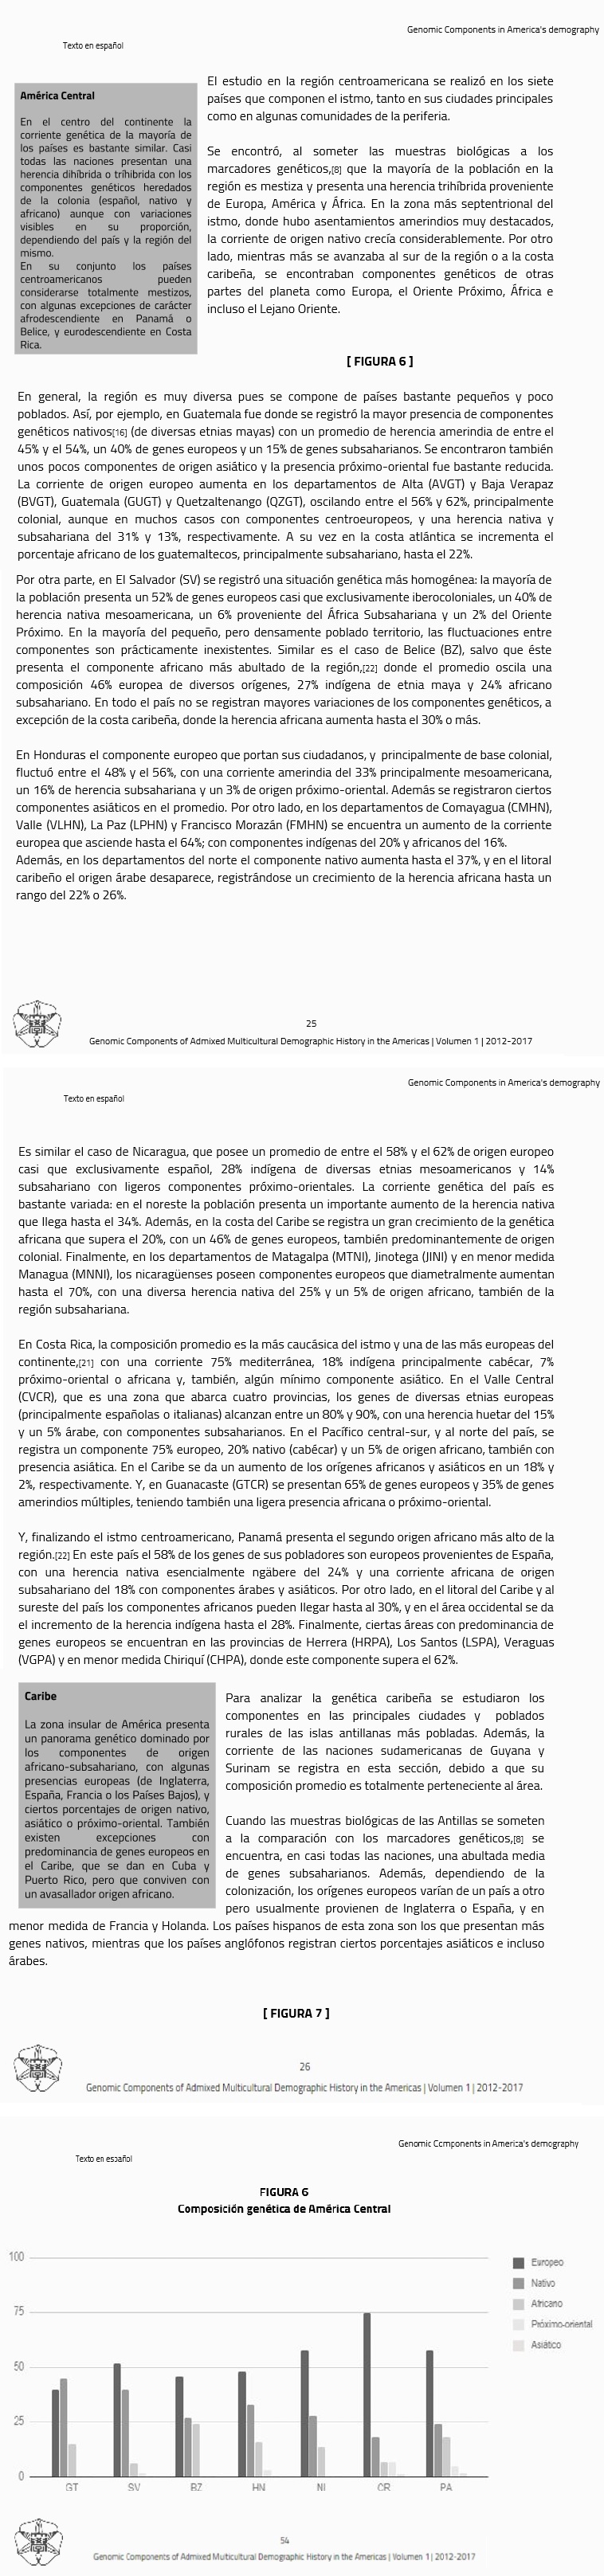
A large majority of the population is declared mestizos. El Salvador is one of the most homogeneous countries in Latin America. According to a genetic research from 2015, Salvadoran genetic admixture is 48.8% Amerindian, 46.7% European, and 4.5% African. [147] The genetic study "Genetic Components in America's demography" revealed a similar genetic mix and genetic makeup, with 52% European component, 40% Amerindian component, 6% African and 2% Arab. [148]

According to an autosomal DNA study from 2008, by the University of Brasília (UnB), Salvadoran genetic admixture is 75.2% Amerindian, 15.1% European, and 9.7% African. [134]

According to the study Population data for 12 Y-chromosome STR loci in a sample from El Salvador, the study revealed that the population of El Salvador was closer to the European conglomerate (composed of European and South American general population samples from Brazil, Argentina, Colombia and Venezuela) than to the group of native and mestizo populations of Central and South America, which can be explained by the differences in the proportion of European contributions versus Amerindian in these population groups. [149]

Guatemala

The study "Geographic Patterns of Genome Admixture in Latin American Mestizos" by PLoS Genetics found that the composition of Guatemala were 55% Amerindian, 41% European, and 4% African into Ladinos (mestizo and white people), for the ethnic Amerindians were 92% Amerindian and 8% European. [150]

Mexico

The Mexican mestizo population is the most variable in Latin America, with people's mixed composition being either largely European, or largely Amerindian, rather than having a uniform admixture nationwide. Distribution of Admixture Estimates for Individuals from Mexico City and Quetalmahue (indigenous community in Chile). Genetic variation of mestizo populations in Latin America.PNG
The Mexican mestizo population is the most variable in Latin America, with people's mixed composition being either largely European, or largely Amerindian, rather than having a uniform admixture nationwide. Distribution of Admixture Estimates for Individuals from Mexico City and Quetalmahue (indigenous community in Chile).

A 2009 autosomal study found average admixture of Mexican Mestizos from six states (Guanajuato, Guerrero, Sonora, Veracruz, Yucatan and Zacatecas) to be 55.2% Native, 41.8% European, 1.8% African and 1.2% Asian, however the sample pool only had 300 participants. [151]

Maria Ines Guerra is a Mexican TV presenter and singer. Maria Ines Guerra 2015.jpg
Maria Ines Guerra is a Mexican TV presenter and singer.

A study by Mexico's National Institute of Genomic Medicine (INMEGEN) reported that mestizo Mexicans are on average 58.96% European, 31.05% Amerindian, and 10.03% African. The African contribution ranges from 2.8 percent in Sonora to 11.13 percent in Veracruz. Eighty percent of the population was classified as mestizo (racially mixed to some degree). The study was conducted among volunteers from six states (Guanajuato, Oaxaca, Sonora, Veracruz, Yucatan and Zacatecas) and an indigenous group, the Zapotecs. [152] It is important to note that the sample pool was quite small, with only 104 participants.

Additional studies suggest a correlation between greater European admixture with a higher socioeconomic status, and greater Amerindian ancestry with a lower socioeconomic status. A study of low-income Mexicans found the mean admixture to be 0.590, 0.348 and 0.062 Amerindian, European and African respectively, [153] while a study of Mexicans with an income higher than the mean found their European admixture to be 82 percent. [154] On average, 68 haplotypes account for 95% of the chromosomes in Mexicans. [151]

In 2023, a large study, from researchers at the Regeneron Genetics Center, the University of Oxford, and various Mexican institutions, modeled the ancestry of around 140,000 participants from Mexico City (Mostly from Coyoacán and Iztapalapa, these boroughs represent 1/4 of the city’s population), based on samples collected between 1998 and 2004. They estimated the average admixture to be 66% Native American, 31.1% European, and 2.9% African. [155]

In 2014, researchers conducted a study to determine the genetic makeup of the Mexican population using Ancestry Informative Markers (AIMs) and Short Tandem Repeats (STRs). They found that, on average, the genetic ancestry was composed of 56% Native American, 42% European, and 2% African. [156] Subsequently, in 2015, a separate team of researchers performed a meta-analysis, incorporating the 2014 study's findings with additional research. This comprehensive analysis revealed a slightly different genetic composition, with an average of 62% Native American, 31% European, and 6% African ancestry among Mexicans. [157]

According to another nationwide study in 2018, the genetic admixture of modern Mexicans averaged 60% Native American, 36% European, and 4% African. [158]

Nicaragua

Kirkegaard and Fuerst´s study with 688 Nicaraguans from overall country found majority of European genes at 57%, follow by Native American genes at 23% and very close African genes at 20%. [105]

A genetic study with 100 Nicaraguan samples from Western and Southern part of the country, found average admixture to be 48,66% European, 36,83% Amerindian and 16,29% African. [159]

According to an investigation from 2010, the Nicaraguan average admixture is 69% European, 20% African and 11% Amerindian. [160]

Peru

According to genetic research by the University of Brasilia, Peruvian genetic admixture consists of 73.0% Amerindian, 15.1% European, and 11.9% African ancestry. [146]

According to a 2015 DNA autosomal study, the composition of Peru is: 68.3% Native American, 26.0% European, 3.2% African and 2.5% Asian. [138]

Uruguay

A 2009 DNA study in the American Journal of Human Biology showed the genetic contribution to the genepool of Uruguay as a whole is primarily derived from Europe, with Native American ancestry ranging from 1 to 10 percent and African from 7 to 15 percent (depending on region). [161] A 2014 study, "in agreement with those obtained from a study using nDNA", put the average "for the whole country" (but which thus may vary region-wise) as 6% African and 10% Native American. [114]

See also

Related Research Articles

<span class="mw-page-title-main">Demographics of Venezuela</span>

Venezuela is a country in South America. The Venezuelan people comprise a combination of heritages, primarily Native American and European. The historically present Native American, Spanish colonists, and African slaves have all contributed to varying degrees. Later, waves of European groups migrated to Venezuela in the 20th century, influencing many aspects of Venezuelan life, including its culture, language, food, and music though small in number.

<i>Mestizo</i> Spanish term to denote a person with mixed European and non-European indigenous ancestry

Mestizo is a person of mixed European and Indigenous non-European ancestry in the former Spanish Empire. In certain regions such as Latin America, it may also refer to people who are culturally European even though their ancestors are Indigenous. The term was used as an ethno-racial exonym for mixed-race castas that evolved during the Spanish Empire. It was a formal label for individuals in official documents, such as censuses, parish registers, Inquisition trials, and others. Priests and royal officials might have classified persons as mestizos, but individuals also used the term in self-identification.

<span class="mw-page-title-main">Pardo Brazilians</span> Ethnic and skin color category used by the Brazilian Institute of Geography and Statistics

In Brazil, Pardo is an ethnic and skin color category used by the Brazilian Institute of Geography and Statistics (IBGE) in the Brazilian censuses. The term "pardo" is a complex one, more commonly used to refer to Brazilians of mixed ethnic ancestries.

<span class="mw-page-title-main">Hispanic America</span> Predominantly Spanish-speaking countries of North and South America

The region known as Hispanic America and historically as Spanish America is all the Spanish-speaking countries of the Americas. In all of these countries, Spanish is the main language - sometimes sharing official status with one or more indigenous languages or English, and Roman Catholicism is the predominant religion.

Afro–Latin Americans or Black Latin Americans are Latin Americans of full or mainly sub-Saharan African ancestry.

<span class="mw-page-title-main">Mexicans</span> Citizens and nationals of the United Mexican States

Mexicans are the citizens and nationals of the United Mexican States.The most spoken language by Mexicans is Spanish, but many also speak languages from 68 different Indigenous linguistic groups and other languages brought to Mexico by recent immigration or learned by Mexican expatriates residing in other countries. In 2015, 21.5% of Mexico's population self-identified as having indigenous ancestry, however this also included partially indigenous Mexicans. In 2020, the number was estimated at 11.8 million There are currently about 12 million Mexican nationals residing outside Mexico, with about 11.7 million living in the United States. The larger Mexican diaspora can also include individuals that trace ancestry to Mexico and self-identify as Mexican but are not necessarily Mexican by citizenship. The United States has the largest Mexican population in the world after Mexico at 37,186,361 in 2019.

<span class="mw-page-title-main">Afro-Brazilians</span> Brazilians with sub-Saharan African ancestry

Afro-Brazilians are Brazilians who have predominantly sub-Saharan African ancestry. Most members of another group of people, multiracial Brazilians or pardos, may also have a range of degree of African ancestry. Depending on the circumstances, the ones whose African features are more evident are always or frequently seen by others as "africans" - consequently identifying themselves as such, while the ones for whom this evidence is lesser may not be seen as such as regularly. It is important to note that the term pardo, such as preto, is rarely used outside the census spectrum. Brazilian society has a range of words, including negro itself, to describe multiracial people.

<span class="mw-page-title-main">Regions of Brazil</span> Official subdivision of Brazil into subregions

Brazil is geopolitically divided into five regions, by the Brazilian Institute of Geography and Statistics, which are formed by the federative units of Brazil. Although officially recognized, the division is merely academic, considering geographic, social and economic factors, among others, and has no political effects other than orientating Federal-level government programs. Under the state level, they are further divided into intermediate regions and even further into immediate regions.

<span class="mw-page-title-main">Indigenous peoples of South America</span> Pre-Columbian peoples of South America and their descendants

The Indigenous peoples of South America or South American Indigenous peoples, are the pre-Columbian peoples of South America and their descendants. These peoples contrast with South Americans of European ancestry and those of African descent.

<span class="mw-page-title-main">Nordeste (socio-geographic division)</span> Socio-geographic division of Brazil

The socio-geographic division of Nordeste is the oldest populated by Europeans and currently the second most populous area of Brazil.

White Latin Americans or European Latin Americans are Latin Americans of European descent.

<span class="mw-page-title-main">Chileans</span> Ethnic group native to Chile; people identified with the country of Chile

Chileans are an ethnic group and nation native to the country of Chile and its neighboring insular territories. Most Chileans share a common culture, history, ancestry and language. The overwhelming majority of Chileans are the product of varying degrees of admixture between European ethnic groups with peoples indigenous to Chile's modern territory. Chile is a multilingual and multicultural society, but an overwhelming majority of Chileans have Spanish as their first language and either are Christians or have a Christian cultural background.

<span class="mw-page-title-main">Brazilians</span> Citizens of Brazil

Brazilians are the citizens of Brazil. A Brazilian can also be a person born abroad to a Brazilian parent or legal guardian as well as a person who acquired Brazilian citizenship. Brazil is a multiethnic society, which means that it is home to people of many ethnic origins, and there is no correlation between one's stock and their Brazilian identity.

Brazilian censuses do not use a "multiracial" category. Instead, the censuses use skin colour categories. Most Brazilians of visibly mixed racial origins self-identify as pardos. However, many White Brazilians have distant non-white ancestry, while the group known as pardos likely contains acculturated Amerindians. According to the 2010 census, "pardos" make up 82.277 million people or 43.13% of Brazil's population.

White Mexicans are individuals in Mexico who identify as white, often due to their physical appearance or their recognition of European ancestry. The Mexican government conducts ethnic censuses that allow individuals to identify as "White," but the specific results of these censuses are not made public. Instead, the government releases data on the percentage of "light-skinned Mexicans" in the country, with 12.5% of Mexican people surveyed choosing the three lightest shades in 2017. Using the same skin tone categories, a 2022 survey found that 10.2% chose the three lightest shades. The term "Light-skinned Mexican" is preferred by both the government and media to describe individuals in Mexico who possess European physical traits when discussing ethno-racial dynamics. However, "White Mexican" is still used at times.

In Brazil, a sarará is a multiracial person, being a particular kind of mulato or juçara, with perceivable Black African facial features, light complexion and fair but curly hair, called cabelo crespo, or fair but Afro-like frizzly hair, called carapinha, cabelo encarapinhado or cabelo pixaim. In the 1998 IBGE PME, 0.04% of respondents identified, in an inquiry on race/colour, as "sarará".

<span class="mw-page-title-main">Argentines</span> People of the country of Argentina or who identify as culturally Argentine

Argentines are the people identified with the country of Argentina. This connection may be residential, legal, historical or cultural. For most Argentines, several of these connections exist and are collectively the source of their being Argentine. In the past the National Gentilic for Citizens of Argentina was mistakenly translated as Argentinians, a term that is no longer considered accurate.

<span class="mw-page-title-main">Demographics of the Southern Cone</span>

The Southern Cone is a geographic region composed of the southernmost areas of South America, mostly south of the Tropic of Capricorn. Although geographically this includes part of Southern and Southeastern Brazil, in terms of political geography the Southern cone has traditionally comprised Argentina, Chile, Paraguay, and Uruguay. In the narrowest sense, it only covers Argentina, Chile and Uruguay.

<span class="mw-page-title-main">Bolivians</span> People identified with the country of Bolivia

Bolivians are people identified with the country of Bolivia. This connection may be residential, legal, historical or cultural. For most Bolivians, several of these connections exist and are collectively the source of their being Bolivian.

In Mexico, the term mestizo is used to refer to an identity of those of mixed European and Indigenous Mexican descent. Some believe it can be defined by criteria ranging from ideological and cultural to self-identification, genetic ancestry, or physical appearance. According to these criteria, estimates of the number of mestizos in Mexico vary from about 40 percent of the population to over 90% who do not belong to the country's culturally indigenous minorities. A survey done by Latinobarometro in 2018 found that around 58% of Mexicans self-identify as mestizos when asked about their race, and another survey by Cohesión Social found that over 70% of Mexicans identified as mixed-race. Some genetic studies have claimed that mestizos make up over 93% of Mexico's present-day population, but this is disputed, with many Mexicans, including those of mixed ancestry, identifying more with static racial labels such as "white" or "indigenous" rather than mestizo, and a large number simply identifying as "Mexican," rejecting racialized labels.

References

  1. "Diversidad / Diversidad Étnico-Racial - Principal". Archived from the original on February 18, 2020. Retrieved September 1, 2012.
  2. Aske, Jon. "Hispanics and Race".
  3. Aske, Jon. "Some historical background".
  4. McNeill, William H. (1991). The Rise of the West: A History of the Human Community. The University of Chicago Press., p. 603
  5. Wright, Thomas C. (2017). Latin America since Independence: Two Centuries of Continuity and Change. Rowman & Littlefield. ISBN   978-1-4422-3572-4., pp. 30 - 31
  6. "Field Listing: Ethnic groups". The CIA World Factbook. Archived from the original on June 13, 2007. Retrieved November 24, 2016.
  7. 1 2 3 4 5 6 7 8 9 Lizcano Fernández, Francisco (2005). "Composición Étnica de las Tres Áreas Culturales del Continente Americano al Comienzo del Siglo XXI" [Ethnic Composition of Three Cultural Areas of the Americas at Beginning of the XXI Century](PDF). Convergencia (in Spanish). 38 (May–August): 185–232. ISSN   1405-1435. Archived from the original (PDF) on September 20, 2008.
    See table on page 218
  8. Shoji, Rafael (2004). "Reinterpretação do Budismo Chinês e Coreano no Brasil" [Reinterpretation of Buddhism of the Chinese and Koreans in Brazil](PDF). Revista de Estudos da Religião (in Portuguese) (3): 74–87. ISSN   1677-1222 . Retrieved October 31, 2016.
  9. "Japan-Brazil Relations". MOFA. Retrieved May 23, 2012.
  10. 재외동포현황 [Status of Overseas Koreans] (in Korean). South Korea: Ministry of Foreign Affairs and Trade. 2009. Archived from the original on October 23, 2010. Retrieved May 21, 2009.
  11. "Cronología de la abolición de la esclavitud". Sandiilessa.wordpress.com. Retrieved May 23, 2012.
  12. Stavenhagen, Rodolfo (1987). "Pensar a los indios, tarea de criollos" (PDF) (in Spanish). IIHR. Archived from the original (PDF) on October 22, 2007.
  13. Waiss, Óscar (January 1983). "Latinoamerican" (PDF). Anales de Literatura Hispanoamericana. 12: 228. Archived from the original (PDF) on March 18, 2009. Retrieved May 23, 2012.
  14. "South America: Postindependence overseas immigrants". Britannica Online Encyclopedia. Retrieved February 10, 2008.
  15. "En detrimento de Israel Acercamiento arabe a America Latina". Delacole.com. February 16, 2011. Retrieved May 23, 2012.
  16. "Latinoamérica" (PDF). Retrieved May 23, 2012.[ permanent dead link ]
  17. Stranded in Paradise: Shipwrecked Hundreds of Years Ago, the Garifuna Are Still Trying to Find Their Way by Teresa Wiltz, The Washington Post.
  18. "Grupos poblacionales". INDEC.
  19. | "Encuesta de Ipsos Apoyo, Opinión y Mercado". 2013 (in Spanish). November 30, 2001.
  20. "Tabela 3175 - População residente por cor ou raça, segundo a situação de domicilio, o sexo e a idade". IBGE (in Portuguese). Retrieved September 14, 2020.
  21. | "World Values Survey 2006 Chile" (PDF). 2006 (in Spanish).
  22. "Grupos étnicos - Información técnica". 2019 Census (in Spanish). DANE. Archived from the original on April 8, 2020. Retrieved November 9, 2021.
  23. "Resultado General Censo 2011" (PDF) (in Spanish). INEC.
  24. "El Color de la Piel según el Censo de Población y Viviendas" (PDF) (in Spanish). Oficina Nacional de Estadísticas. Retrieved September 5, 2023.
  25. "La variable étnico racial en los censos de población en la República Dominicana" [The racial ethnic variable in the population census in the Dominican Republic] (in Spanish). Dominican Republic National Bureau of Statistics. July 2012. Archived from the original (PDF) on July 29, 2013.
  26. "Resultados del Censo 2010". 2010 Census (in Spanish). INEC. Archived from the original on March 5, 2012. Retrieved May 14, 2012.
  27. "Censo de Población de Vivienda 2007" [Population and Housing Census 2007](PDF). Department of Statistics and Censuses, Republic of El Salvador (in Spanish). November 4, 2007. p. 13.
  28. Resultados del Censo 2018
  29. "Política pública contra el racismo y la discriminación racial para el desarrollo integral de los pueblos indígenas y afrohondureños" (PDF). 2015 (in Spanish). Gobierno de Honduras. Retrieved July 28, 2021.
  30. "Encuesta Intercensal 2015" (PDF) (in Spanish). INEGI. 2015. Retrieved June 5, 2017.
  31. "Resumen Censal 2005" (PDF). 2005 (in Spanish). INIDE. Archived from the original (PDF) on November 13, 2011.
  32. "INEC::Perspectiva étnica de los censos nacionales de población y de vivienda de 201" (PDF). 2010 (in Spanish). CEPAL.[ permanent dead link ]
  33. "Pueblos Indígenas en el Paraguay, Resultados finales de población y vivienda 2012" (PDF). 2012 Census (in Spanish). Dirección General de Estadística, Encuestas y Censos.
  34. "Resultados Censo 2017" (PDF) (in Spanish). INE. p. 197.
  35. "Puerto Rico: 2020 Census". United States Census Bureau. 2021. Retrieved September 5, 2023.
  36. "La población afro-uruguaya en el Censo 2011" (PDF). 2011 (in Spanish). Instituto Nacional de Estadística. p. 16. Retrieved September 5, 2023.
  37. "XIV Censo nacional de población y vivienda: Resultados total nacional de la República Bolivariana de Venezuela" [XIV National Census of Population and Housing: Total national results for the Bolivarian Republic of Venezuela](PDF). 2011 Census (in Spanish). INE. May 2014. p. 29. Retrieved May 22, 2017.
  38. Population obtained from U.S. Census Bureau, International Data Base, accessed on October 5, 2011.
  39. "Informe Latinobarómetro 2018". latinobarometro.org. Retrieved June 10, 2021.
    Via SPSS output: Image 1, Image 2
  40. "Population and Housing Census 2012" (PDF). ibce.org.bo (in Spanish). Retrieved March 19, 2024.
  41. "Características de la población" (PDF). ine.gob.gt (in Spanish). Retrieved March 19, 2024.
  42. "Peru". March 13, 2024.
  43. "Censo de Población y Vivienda".
  44. Instituto Nacional de Estadística y Censo
  45. Documentos, Documentos de resultados, Colombia; Latinobarómetro 2018
  46. "Informe anual sobre la situación de pobreza y rezago social 2022" (PDF). gob.mx. Retrieved March 19, 2024.
  47. "Acceso a la educación digital, en la población indígena de Chimborazo" (PDF) (in Spanish). Archived from the original (PDF) on August 4, 2016.
  48. Nicaragua cepal.org
  49. 1 2 "Nicaragua". March 13, 2024.
  50. "Archived copy" (PDF). Archived from the original (PDF) on November 23, 2018. Retrieved March 15, 2024.{{cite web}}: CS1 maint: archived copy as title (link)
  51. "Archived copy" (PDF). Archived from the original (PDF) on April 9, 2016. Retrieved March 15, 2024.{{cite web}}: CS1 maint: archived copy as title (link)
  52. "Costa Rica - IWGIA - International Work Group for Indigenous Affairs".
  53. "Instituto Nacional de Estadística".
  54. "Población indígena registrada, según denominación de pueblo y operativo censal. Años 2002 y 2012" (PDF). Retrieved March 19, 2024.
  55. "Brasil tem 1,7 milhão de indígenas e mais da metade deles vive na Amazônia Legal".
  56. "U.S. Relations with El Salvador". state.gov.
  57. 1 2 "Haiti". March 13, 2024.
  58. "El 32,8 % de la población de Panamá se reconoce como afrodescendiente". March 2, 2023.
  59. "Dominican Republic". February 20, 2024.
  60. "IBGE | Portal do IBGE | IBGE".
  61. "Grupos étnicos información técnica". Archived from the original on April 8, 2020. Retrieved November 9, 2021.
  62. 1 2 Tabla II 4 población por sexo
  63. "Puerto Rico Population Declined 11.8% from 2010 to 2020".
  64. Cabella, Wanda (March 18, 2024). La población Afro-uruguaya en el Censo 2011. D - Universidad de la República. ISBN   978-9974-32-625-5.
  65. Resultados Total Nacional de la República Bolivariana de Venezuela ine.gob.ve
  66. Población Afroperuana inei.gob.pe
  67. "Panorama sociodemográfico de México".
  68. "Honduras". February 21, 2024.
  69. "Costa Rica". March 8, 2024.
  70. Afrolatinos
  71. Mapas Archived December 17, 2019, at the Wayback Machine censopoblacion.gt
  72. Censo de Población y Vivienda 2012 inecloud.ine.gob.bo
  73. Resultados censos.gob.sv
  74. "Paraguay". March 13, 2024.
  75. "Estimación de personas extranjeras residentes habituales en Chile al 31 de diciembre 2019" (PDF). Retrieved March 19, 2024.
  76. "Uruguay". March 13, 2024.
  77. 1 2 3 Lizcano Fernández, Francisco (August 2005). "Composición Étnica de las Tres Áreas Culturales del Continente Americano al Comienzo del Siglo XXI". Convergencia (in Spanish). 12 (38): 185–232.
  78. "Costa Rica".
  79. "IBGE | Portal do IBGE | IBGE" (PDF).
  80. "Brancos são menos da metade da população pela primeira vez no Brasil".
  81. "Mexico - Indigenous, Mestizo, Afro-Mexican | Britannica".
  82. Día Internacional de la Eliminación de la Discriminación Racial conapred.org.mx
  83. Resultados generales conapred.org.mx
  84. "Censos de población y vivienda".
  85. Étnia, condiciones de vida y discriminación schwartzman.org.br
  86. "Breve Encuesta Nacional de Autopercepción Racial y Étnica en República Dominicana". UNFPA República Dominicana. March 10, 2022. Retrieved March 19, 2024.
  87. "2020 Census Illuminates Racial and Ethnic Composition of the Country".
  88. "Nicaragua - Rainforest, Wildlife, Ecosystems | Britannica".
  89. Voluntariado internacional 2013 internacional.us.es
  90. Municipios Caracteristicas Generales digestyc.gob.sv
  91. "Embajada de Panamá en España".
  92. Libro inei.gob.pe
  93. "Bolivia". March 13, 2024.
  94. "Más mestizos, menos afros y pocos blancos: Así se ven los ecuatorianos".
  95. Cultura embajadahonduras.org.mx
  96. "Conozca más de nuestras costumbres y tradiciones - Diario La Tribuna Honduras". December 22, 2015. Archived from the original on December 22, 2015. Retrieved March 19, 2024.
  97. Remainder of the population that doesn’t pertain to other groups
  98. 1 2 Corach, Daniel; Lao, Oscar; Bobillo, Cecilia; Van Der Gaag, Kristiaan; Zuniga, Sofia; Vermeulen, Mark; Van Duijn, Kate; Goedbloed, Miriam; Vallone, Peter M.; Parson, Walther; De Knijff, Peter; Kayser, Manfred (January 2010). "Inferring Continental Ancestry of Argentineans from Autosomal, Y-Chromosomal and Mitochondrial DNA". Annals of Human Genetics. 74 (1): 65–76. doi:10.1111/j.1469-1809.2009.00556.x. hdl: 11336/14301 . PMID   20059473. S2CID   5908692.
  99. Taboada-Echalar, Patricia; Álvarez-Iglesias, Vanesa; Heinz, Tanja; Vidal-Bralo, Laura; Gómez-Carballa, Alberto; Catelli, Laura; Pardo-Seco, Jacobo; Pastoriza, Ana; Carracedo, Ángel; Torres-Balanza, Antonio; Rocabado, Omar; Vullo, Carlos; Salas, Antonio (2013). "The Genetic Legacy of the Pre-Colonial Period in Contemporary Bolivians". PLOS ONE. 8 (3): e58980. Bibcode:2013PLoSO...858980T. doi: 10.1371/journal.pone.0058980 . PMC   3604014 . PMID   23527064.
  100. 1 2 3 Rodrigues De Moura, Ronald; Coelho, Antonio Victor Campos; De Queiroz Balbino, Valdir; Crovella, Sergio; Brandão, Lucas André Cavalcanti (2015). "Meta-analysis of Brazilian genetic admixture and comparison with other Latin America countries". American Journal of Human Biology. 27 (5): 674–80. doi:10.1002/ajhb.22714. hdl: 11368/2837176 . PMID   25820814. S2CID   25051722.
  101. 1 2 Eyheramendy, Susana; Martinez, Felipe I.; Manevy, Federico; Vial, Cecilia; Repetto, Gabriela M. (March 17, 2015). "Genetic structure characterization of Chileans reflects historical immigration patterns". Nature Communications. 6 (1): 6472. Bibcode:2015NatCo...6.6472E. doi:10.1038/ncomms7472. PMC   4382693 . PMID   25778948.
  102. 1 2 3 "Genetic Make Up and Structure of Colombian Populations by Means of Uniparental and Biparental DNA Markers" . Retrieved March 19, 2024.
  103. 1 2 Morera, B.; Barrantes, R.; Marin-Rojas, R. (January 2003). "Gene Admixture in the Costa Rican Population". Annals of Human Genetics. 67 (1): 71–80. doi: 10.1046/j.1469-1809.2003.00010.x . PMID   12556237. S2CID   40547133.
  104. Fortes-Lima, C.; Bybjerg-Grauholm, J.; Marin-Padrón, L. C.; Gomez-Cabezas, E. J.; Bækvad-Hansen, M.; Hansen, C. S.; Le, P.; Hougaard, D. M.; Verdu, P.; Mors, O.; Parra, E. J.; Marcheco-Teruel, B. (2018). "Exploring Cuba's population structure and demographic history using genome-wide data". Scientific Reports. 8 (1): 11422. Bibcode:2018NatSR...811422F. doi:10.1038/s41598-018-29851-3. PMC   6065444 . PMID   30061702.
  105. 1 2 3 4 Kirkegaard, Fuerst et (March 2016). "Estimación de la mezcla genética en la población de Nicaragua" [Admixture in the Americas: Regional and National Differences]. Research Gate. 56: 366.
  106. Gaviria, Zambrano; et al. (June 25, 2019). "The three-hybrid genetic composition of an Ecuadorian population using AIMs-InDels compared with autosomes, mitochondrial DNA and Y chromosome data". National Library of Medicine. 9 (1): 9247. Bibcode:2019NatSR...9.9247Z. doi:10.1038/s41598-019-45723-w. PMC   6592923 . PMID   31239502.
  107. Simms, T. M.; Rodriguez, C. E.; Rodriguez, R.; Herrera, R. J. (2010). "The genetic structure of populations from Haiti and Jamaica reflect divergent demographic histories". American Journal of Physical Anthropology. 142 (1): 49–66. doi:10.1002/ajpa.21194. PMID   19918989.
  108. 1 2 3 Salazar-Flores, J.; Zuñiga-Chiquette, F.; Rubi-Castellanos, R.; Álvarez-Miranda, J.L.; Zetina-Hérnandez, A.; Martínez-Sevilla, V.M.; González-Andrade, F.; Corach, D.; Vullo, C.; Álvarez, J.C.; Lorente, J.A.; Sánchez-Diz, P.; Herrera, R.J.; Cerda-Flores, R.M.; Muñoz-Valle, J.F.; Rangel-Villalobos, H. (2015). "Admixture and genetic relationships of Mexican Mestizos regarding Latin American and Caribbean populations based on 13 CODIS-STRS". Homo. 66 (1): 44–59. doi:10.1016/j.jchb.2014.08.005. hdl: 11336/15953 . PMID   25435058.
  109. Price, Alkes L.; Patterson, Nick; Yu, Fuli; Cox, David R.; Waliszewska, Alicja; McDonald, Gavin J.; Tandon, Arti; Schirmer, Christine; Neubauer, Julie; Bedoya, Gabriel; Duque, Constanza; Villegas, Alberto; Bortolini, Maria Catira; Salzano, Francisco M.; Gallo, Carla; Mazzotti, Guido; Tello-Ruiz, Marcela; Riba, Laura; Aguilar-Salinas, Carlos A.; Canizales-Quinteros, Samuel; Menjivar, Marta; Klitz, William; Henderson, Brian; Haiman, Christopher A.; Winkler, Cheryl; Tusie-Luna, Teresa; Ruiz-Linares, Andrés; Reich, David (June 2007). "A Genomewide Admixture Map for Latino Populations". The American Journal of Human Genetics. 80 (6): 1024–1036. doi:10.1086/518313. PMC   1867092 . PMID   17503322.
  110. Arias, Tomás D.; Castro, Edgardo; Ruiz, Edward; Barrantes, Ramiro; Jorge-Nebert, Lucía (2002). "[Racial mix of the panamanian population]". Revista Medica de Panama. 27: 5–17. PMID   16737193.
  111. Simão, F.; Ribeiro, J.; Vullo, C.; Catelli, L.; Gomes, V.; Xavier, C.; Huber, G.; Bodner, M.; Quiroz, A.; Ferreira, A. P.; Carvalho, E. F.; Parson, W.; Gusmão, L. (2021). "The Ancestry of Eastern Paraguay: A Typical South American Profile with a Unique Pattern of Admixture". Genes. 12 (11): 1788. doi: 10.3390/genes12111788 . PMC   8625094 . PMID   34828394.
  112. 1 2 Ruiz-Linares, A.; et al. (2014). "Admixture in Latin America: Geographic structure, phenotypic diversity and self-perception of ancestry based on 7,342 individuals". PLOS Genetics. 10 (9): e1004572. doi: 10.1371/journal.pgen.1004572 . PMC   4177621 . PMID   25254375.
  113. Via, Marc; Gignoux, Christopher R.; Roth, Lindsey A.; Fejerman, Laura; Galanter, Joshua; Choudhry, Shweta; Toro-Labrador, Gladys; Viera-Vera, Jorge; Oleksyk, Taras K.; Beckman, Kenneth; Ziv, Elad; Risch, Neil; Burchard, Esteban González; Martínez-Cruzado, Juan Carlos (2011). "History Shaped the Geographic Distribution of Genomic Admixture on the Island of Puerto Rico". PLOS ONE. 6 (1): e16513. Bibcode:2011PLoSO...616513V. doi: 10.1371/journal.pone.0016513 . PMC   3031579 . PMID   21304981.
  114. 1 2 3 Salzano, F. M.; Sans, M. (2013). "Interethnic admixture and the evolution of Latin American populations". Genetics and Molecular Biology. 37 (1 Suppl): 151–170. doi:10.1590/s1415-47572014000200003. PMC   3983580 . PMID   24764751.
  115. Wade, Lizzie (January 18, 2019). "The surprising reason why some Latin Americans have light skin". Science - AAAS.
  116. Relethford, John H.; Stern, Michael P.; Gaskill, Sharon P.; Hazuda, Helen P. (1983). "Social class, admixture, and skin color variation in Mexican-Americans and Anglo-Americans living in San Antonio, Texas". American Journal of Physical Anthropology. 61 (1): 97–102. doi:10.1002/ajpa.1330610110. PMID   6869517.
  117. Adhikari, Kaustubh; Mendoza-Revilla, Javier; Sohail, Anood; Fuentes-Guajardo, Macarena; Lampert, Jodie; Chacón-Duque, Juan Camilo; Hurtado, Malena; Villegas, Valeria; Granja, Vanessa; Acuña-Alonzo, Victor; Jaramillo, Claudia; Arias, William; Lozano, Rodrigo Barquera; Everardo, Paola; Gómez-Valdés, Jorge; Villamil-Ramírez, Hugo; Silva de Cerqueira, Caio C.; Hunemeier, Tábita; Ramallo, Virginia; Schuler-Faccini, Lavinia; Salzano, Francisco M.; Gonzalez-José, Rolando; Bortolini, Maria-Cátira; Canizales-Quinteros, Samuel; Gallo, Carla; Poletti, Giovanni; Bedoya, Gabriel; Rothhammer, Francisco; Tobin, Desmond J.; Fumagalli, Matteo; Balding, David; Ruiz-Linares, Andrés (January 21, 2019). "A GWAS in Latin Americans highlights the convergent evolution of lighter skin pigmentation in Eurasia". Nature Communications. 10 (1): 358. Bibcode:2019NatCo..10..358A. doi:10.1038/s41467-018-08147-0. PMC   6341102 . PMID   30664655.
  118. Wade, Lizzie (January 24, 2019). "Light skin may be legacy of Native American ancestors". Science. 363 (6425): 333. Bibcode:2019Sci...363..333W. doi:10.1126/science.363.6425.333. PMID   30679354. S2CID   59251227.
  119. Avena, Sergio; Via, Marc; Ziv, Elad; Pérez-Stable, Eliseo J.; Gignoux, Christopher R.; Dejean, Cristina; Huntsman, Scott; Torres-Mejía, Gabriela; Dutil, Julie; Matta, Jaime L.; Beckman, Kenneth; Burchard, Esteban González; Parolin, María Laura; Goicoechea, Alicia; Acreche, Noemí; Boquet, Mariel; Ríos Part, María Del Carmen; Fernández, Vanesa; Rey, Jorge; Stern, Mariana C.; Carnese, Raúl F.; Fejerman, Laura (April 10, 2012). "Heterogeneity in Genetic Admixture across Different Regions of Argentina". PLOS ONE. 7 (4): e34695. Bibcode:2012PLoSO...734695A. doi: 10.1371/journal.pone.0034695 . PMC   3323559 . PMID   22506044.
  120. Homburger; et al. (2015). "Genomic Insights into the Ancestry and Demographic History of South America". PLOS Genetics. 11 (12): e1005602. doi: 10.1371/journal.pgen.1005602 . PMC   4670080 . PMID   26636962.
  121. Avena; et al. (2012). "Heterogeneity in Genetic Admixture across Different Regions of Argentina". PLOS ONE. 7 (4): e34695. Bibcode:2012PLoSO...734695A. doi: 10.1371/journal.pone.0034695 . PMC   3323559 . PMID   22506044.
  122. 1 2 "O impacto das migrações na constituição genética de populações latino-americanas" (PDF). Repositorio.unb.br. Archived (PDF) from the original on 1 October 2018. Retrieved 15 January 2018.
  123. 1 2 Saloum de Neves Manta, Fernanda; Pereira, Rui; Vianna, Romulo; Rodolfo Beuttenmüller de Araújo, Alfredo; Leite Góes Gitaí, Daniel; Aparecida da Silva, Dayse; de Vargas Wolfgramm, Eldamária; da Mota Pontes, Isabel; Ivan Aguiar, José; Ozório Moraes, Milton; Fagundes de Carvalho, Elizeu; Gusmão, Leonor; O'Rourke, Dennis (September 20, 2013). "Revisiting the Genetic Ancestry of Brazilians Using Autosomal AIM-Indels". PLOS ONE. 8 (9): e75145. Bibcode:2013PLoSO...875145S. doi: 10.1371/journal.pone.0075145 . PMC   3779230 . PMID   24073242.
  124. Lins, Tulio C.; Vieira, Rodrigo G.; Abreu, Breno S.; Grattapaglia, Dario; Pereira, Rinaldo W. (2009). "Genetic composition of Brazilian population samples based on a set of twenty-eight ancestry informative SNPs". American Journal of Human Biology. 22 (2): 187–92. doi: 10.1002/ajhb.20976 . PMID   19639555. S2CID   205301927.
  125. 1 2 Pena, Sérgio D. J.; Di Pietro, Giuliano; Fuchshuber-Moraes, Mateus; Genro, Julia Pasqualini; Hutz, Mara H.; Kehdy, Fernanda de Souza Gomes; Kohlrausch, Fabiana; Magno, Luiz Alexandre Viana; Montenegro, Raquel Carvalho; Moraes, Manoel Odorico; Moraes, Maria Elisabete Amaral de; Moraes, Milene Raiol de; Ojopi, Élida B.; Perini, Jamila A.; Racciopi, Clarice; Ribeiro-dos-Santos, Ândrea Kely Campos; Rios-Santos, Fabrício; Romano-Silva, Marco A.; Sortica, Vinicius A.; Suarez-Kurtz, Guilherme; Harpending, Henry (February 16, 2011). "The Genomic Ancestry of Individuals from Different Geographical Regions of Brazil Is More Uniform Than Expected". PLOS ONE. 6 (2): e17063. Bibcode:2011PLoSO...617063P. doi: 10.1371/journal.pone.0017063 . PMC   3040205 . PMID   21359226.
  126. Pena, Sérgio D. J.; Di Pietro, Giuliano; Fuchshuber-Moraes, Mateus; Genro, Julia Pasqualini; Hutz, Mara H.; Kehdy, Fernanda de Souza Gomes; Kohlrausch, Fabiana; Magno, Luiz Alexandre Viana; Montenegro, Raquel Carvalho; Moraes, Manoel Odorico; Moraes, Maria Elisabete Amaral de; Moraes, Milene Raiol de; Ojopi, Élida B.; Perini, Jamila A.; Racciopi, Clarice; Ribeiro-dos-Santos, Ândrea Kely Campos; Rios-Santos, Fabrício; Romano-Silva, Marco A.; Sortica, Vinicius A.; Suarez-Kurtz, Guilherme; Harpending, Henry (February 16, 2011). "The Genomic Ancestry of Individuals from Different Geographical Regions of Brazil Is More Uniform Than Expected". PLOS ONE. 6 (2): e17063. Bibcode:2011PLoSO...617063P. doi: 10.1371/journal.pone.0017063 . PMC   3040205 . PMID   21359226.
  127. "Profile of the Brazilian blood donor". Archived from the original on May 2, 2012.
  128. Drago, Carolina (February 24, 2011). "Nossa herança europeia" [Our European heritage] (in Portuguese). cienciahoje.org.br. Retrieved November 4, 2016.
  129. Lopes, Reinaldo José (October 5, 2009). "DNA de brasileiro é 80% europeu, indica estudo" [Brazilian DNA is 80% European, study shows] (in Portuguese). Folha de S.Paulo. Retrieved November 4, 2016.
  130. Lins, TC; Vieira, RG; Abreu, BS; Grattapaglia, D; Pereira, RW (2010). "Genetic composition of Brazilian population samples based on a set of twenty-eight ancestry informative SNPs". Am. J. Hum. Biol. 22 (2): 187–92. doi: 10.1002/ajhb.20976 . PMID   19639555. S2CID   205301927.
  131. 1 2 Lins, TC; Vieira, RG; Abreu, BS; Grattapaglia, D; Pereira, RW (2010). "Genetic composition of Brazilian population samples based on a set of twenty-eight ancestry informative SNPs". Am. J. Hum. Biol. 22 (2): 187–92. doi: 10.1002/ajhb.20976 . PMID   19639555. S2CID   205301927.
  132. De Assis Poiares, L; De Sá Osorio, P; Spanhol, F. A.; Coltre, S. C.; Rodenbusch, R; Gusmão, L; Largura, A; Sandrini, F; Da Silva, C. M. (February 2010). "Allele frequencies of 15 STRs in a representative sample of the Brazilian population". Forensic Sci Int Genet. 4 (2): e61–3. doi:10.1016/j.fsigen.2009.05.006. PMID   20129458.
  133. de Assis Poiares, Lilian; de Sá Osorio, Paulo; Spanhol, Fábio Alexandre; Coltre, Sidnei César; Rodenbusch, Rodrigo; Gusmão, Leonor; Largura, Alvaro; Sandrini, Fabiano; da Silva, Cláudia Maria Dornelles (February 2010). "Allele frequencies of 15 STRs in a representative sample of the Brazilian population". Forensic Science International: Genetics. 4 (2): e61–e63. doi:10.1016/j.fsigen.2009.05.006. PMID   20129458.
  134. 1 2 de Oliveira Godinho, Neide Maria (2008). "O impacto das migrações na constituição genética de populações Latino-Americanas" [The impact of migration on the genetic makeup of Latin American populations](PDF) (in Portuguese). University of Brazil. Archived from the original (PDF) on October 1, 2018. Retrieved November 4, 2016.
  135. Ferreira, Luzitano Brandão; Mendes, Celso Teixeira; Wiezel, Cláudia Emília Vieira; Luizon, Marcelo Rizzatti; Simões, Aguinaldo Luiz (September 1, 2006). "Genomic ancestry of a sample population from the state of São Paulo, Brazil". Am. J. Hum. Biol. 18 (5): 702–705. doi: 10.1002/ajhb.20474 . PMID   16917899. S2CID   10103856.
  136. 1 2 Cruz-Coke, R; Moreno, R S (September 1, 1994). "Genetic epidemiology of single gene defects in Chile". Journal of Medical Genetics. 31 (9): 702–706. doi:10.1136/jmg.31.9.702. PMC   1050080 . PMID   7815439.
  137. 1 2 Fuentes, Macarena; Pulgar, Iván; Gallo, Carla; Bortolini, María-Cátira; Canizales-Quinteros, Samuel; Bedoya, Gabriel; González-José, Rolando; Ruiz-Linares, Andrés; Rothhammer, Francisco (March 2014). "Geografía génica de Chile: Distribución regional de los aportes genéticos americanos, europeos y africanos" [Gene geography of Chile: regional distribution of American, European and African genetic contributions]. Revista médica de Chile (in Spanish). 142 (3): 281–289. doi: 10.4067/S0034-98872014000300001 . hdl: 10183/118734 . PMID   25052264.
  138. 1 2 3 Homburger, Julian R.; Moreno-Estrada, Andrés; Gignoux, Christopher R.; Nelson, Dominic; Sanchez, Elena; Ortiz-Tello, Patricia; Pons-Estel, Bernardo A.; Acevedo-Vasquez, Eduardo; Miranda, Pedro; Langefeld, Carl D.; Gravel, Simon; Alarcón-Riquelme, Marta E.; Bustamante, Carlos D.; Tarazona-Santos, Eduardo (December 4, 2015). "Genomic Insights into the Ancestry and Demographic History of South America". PLOS Genetics. 11 (12): e1005602. doi: 10.1371/journal.pgen.1005602 . PMC   4670080 . PMID   26636962.
  139. Verdugo, Ricardo A.; Di Genova, Alex; Herrera, Luisa; Moraga, Mauricio; Acuña, Mónica; Berríos, Soledad; Llop, Elena; Valenzuela, Carlos Y.; Bustamante, M. Leonor; Digman, Dayhana; Symon, Adriana; Asenjo, Soledad; López, Pamela; Blanco, Alejandro; Suazo, José; Barozet, Emmanuelle; Caba, Fresia; Villalón, Marcelo; Alvarado, Sergio; Cáceres, Dante; Salgado, Katherine; Portales, Pilar; Moreno-Estrada, Andrés; Gignoux, Christopher R.; Sandoval, Karla; Bustamante, Carlos D.; Eng, Celeste; Huntsman, Scott; Burchard, Esteban G.; et al. (2020). "Development of a small panel of SNPS to infer ancestry in Chileans that distinguishes Aymara and Mapuche components". Biological Research. 53 (1): 15. doi: 10.1186/s40659-020-00284-5 . PMC   7161194 . PMID   32299502.
  140. Vieira-Machado, C. D., Tostes, M., Alves, G., Nazer, J., Martinez, L., Wettig, E., Orioli, I. M. (2016). Uniparental ancestry markers in Chilean populations . Genetics and Molecular Biology, 39(4), 573–579. doi:10.1590/1678-4685-GMB-2015-0273
  141. Gómez-Carballa; et al. (2016). "Revealing latitudinal patterns of mitochondrial DNA diversity in Chileans". Forensic Science International: Genetics. 20: 81–88. doi:10.1016/j.fsigen.2015.10.002. PMID   26517175 . Retrieved August 19, 2016.
  142. Criollo-Rayo, Angel; Bohórquez, Mabel Elena; Lott, Paul; Carracedo, Angel; Tomlinson, Ian; Castro, Jorge Mario; Mateus, Gilbert; Molina, Daniel; Vargas, Catalina Rubio; Puentes, Carlos; Echeverry, Magdalena; Carvajal, Luis (March 2, 2023). "Colorectal Cancer Risk and Ancestry in Colombian admixed Populations". medRxiv   10.1101/2023.03.02.23286692 .
  143. Ossa, Humberto; Aquino, Juliana; Pereira, Rui; Ibarra, Adriana; Ossa, Rafael H; Pérez, Luz Adriana; Granda, Juan David; Lattig, Maria Claudia; Groot, Helena; Fagundes de Carvalho, Elizeu; Gusmão, Leonor; Chiang, Tzen-Yuh (October 13, 2016). "Outlining the Ancestry Landscape of Colombian Admixed Populations". PLOS ONE. 11 (10): e0164414. Bibcode:2016PLoSO..1164414O. doi: 10.1371/journal.pone.0164414 . PMC   5063461 . PMID   27736937.
  144. Marcheco-Teruel, Beatriz; Parra, Esteban J.; Fuentes-Smith, Evelyn; Salas, Antonio; Buttenschøn, Henriette N.; Demontis, Ditte; Torres-Español, María; Marín-Padrón, Lilia C.; Gómez-Cabezas, Enrique J.; Álvarez-Iglesias, Vanesa; Mosquera-Miguel, Ana; Martínez-Fuentes, Antonio; Carracedo, Ángel; Børglum, Anders D.; Mors, Ole; Akey, Joshua M. (July 24, 2014). "Cuba: Exploring the History of Admixture and the Genetic Basis of Pigmentation Using Autosomal and Uniparental Markers". PLOS Genetics. 10 (7): e1004488. doi: 10.1371/journal.pgen.1004488 . PMC   4109857 . PMID   25058410.
  145. 1 2 Bryc, Katarzyna; Velez, Christopher; Karafet, Tatiana; Moreno-Estrada, Andres; Reynolds, Andy; Auton, Adam; Hammer, Michael; Bustamante, Carlos D.; Ostrer, Harry (May 11, 2010). "Genome-wide patterns of population structure and admixture among Hispanic/Latino populations". Proceedings of the National Academy of Sciences of the United States of America. 107 (Suppl 2): 8954–8961. Bibcode:2010PNAS..107.8954B. doi: 10.1073/pnas.0914618107 . PMC   3024022 . PMID   20445096.
  146. 1 2 Godinho, Neide Maria de Oliveira (2008). "O impacto das migrações na constituição genética de populações latino-americanas" (PDF). Universidade de Brasília. Archived from the original on July 6, 2011. Retrieved 29 October 2012.
  147. Salazar-Flores, J.; Zuñiga-Chiquette, F.; Rubi-Castellanos, R.; Álvarez-Miranda, J.L.; Zetina-Hérnandez, A.; Martínez-Sevilla, V.M.; González-Andrade, F.; Corach, D.; Vullo, C.; Álvarez, J.C.; Lorente, J.A.; Sánchez-Diz, P.; Herrera, R.J.; Cerda-Flores, R.M.; Muñoz-Valle, J.F.; Rangel-Villalobos, H. (2015). "Admixture and genetic relationships of Mexican Mestizos regarding Latin American and Caribbean populations based on 13 CODIS-STRS". Homo. 66 (1): 44–59. doi:10.1016/j.jchb.2014.08.005. hdl: 11336/15953 . PMID   25435058.
  148. "Genetic Components in America's demography". staticflickr. Retrieved July 31, 2021.
  149. Monterrosa, J. C.; Morales, J. A.; Yurrebaso, I.; Gusmão, L.; García, O. (2010). "Population data for 12 Y-chromosome STR loci in a sample from El Salvador". Legal Medicine (Tokyo, Japan). 12 (1): 46–51. doi:10.1016/j.legalmed.2009.10.003. PMID   19962926 . Retrieved August 4, 2021.
  150. 1 2 Wang, Sijia; Ray, Nicolas; Rojas, Winston; Parra, Maria V.; Bedoya, Gabriel; Gallo, Carla; Poletti, Giovanni; Mazzotti, Guido; Hill, Kim; Hurtado, Ana M.; Camrena, Beatriz; Nicolini, Humberto; Klitz, William; Barrantes, Ramiro; Molina, Julio A.; Freimer, Nelson B.; Bortolini, Maria Cátira; Salzano, Francisco M.; Petzl-Erler, Maria L.; Tsuneto, Luiza T.; Dipierri, José E.; Alfaro, Emma L.; Bailliet, Graciela; Bianchi, Nestor O.; Llop, Elena; Rothhammer, Francisco; Excoffier, Laurent; Ruiz-Linares, Andrés; McVean, Gil (March 21, 2008). "Geographic Patterns of Genome Admixture in Latin American Mestizos". PLOS Genetics. 4 (3): e1000037. doi: 10.1371/journal.pgen.1000037 . PMC   2265669 . PMID   18369456.
  151. 1 2 Silva-Zolezzi, Irma; Hidalgo-Miranda, Alfredo; Estrada-Gil, Jesus; Fernandez-Lopez, Juan Carlos; Uribe-Figueroa, Laura; Contreras, Alejandra; Balam-Ortiz, Eros; del Bosque-Plata, Laura; Velazquez-Fernandez, David; Lara, Cesar; Goya, Rodrigo; Hernandez-Lemus, Enrique; Davila, Carlos; Barrientos, Eduardo; March, Santiago; Jimenez-Sanchez, Gerardo (May 26, 2009). "Analysis of genomic diversity in Mexican Mestizo populations to develop genomic medicine in Mexico". Proceedings of the National Academy of Sciences. 106 (21): 8611–8616. Bibcode:2009PNAS..106.8611S. doi: 10.1073/pnas.0903045106 . PMC   2680428 . PMID   19433783.
  152. J.K. Estrada; A. Hidalgo-Miranda; I. Silva-Zolezzi; G. Jimenez-Sanchez. "Evaluation of Ancestry and Linkage Disequilibrium Sharing in Admixed Population in Mexico". ASHG. Archived from the original on January 16, 2013. Retrieved July 18, 2012.
  153. Lisker, Rubén; Ramírez, Eva; González-Villalpando, Clicerio; Stern, Michael P. (1995). "Racial admixture in a Mestizo population from Mexico City". American Journal of Human Biology. 7 (2): 213–216. doi:10.1002/ajhb.1310070210. PMID   28557218. S2CID   8177392.
  154. Martinez-Marignac, Veronica L.; Valladares, Adan; Cameron, Emily; Chan, Andrea; Perera, Arjuna; Globus-Goldberg, Rachel; Wacher, Niels; Kumate, Jesús; McKeigue, Paul; O’Donnell, David; Shriver, Mark D.; Cruz, Miguel; Parra, Esteban J. (October 26, 2006). "Admixture in Mexico City: implications for admixture mapping of Type 2 diabetes genetic risk factors". Human Genetics. 120 (6): 807–819. doi:10.1007/s00439-006-0273-3. PMID   17066296. S2CID   18304529.
  155. Perez, Rodrigo (October 11, 2023). "What is a 'Mexican'? Huge genetic database untangles a complex history". Science.org. Retrieved February 24, 2024.
  156. Salzano, Francisco Mauro; Sans, Mónica (2014). "Interethnic admixture and the evolution of Latin American populations". Genetics and Molecular Biology. 37 (1 suppl 1): 151–170. doi:10.1590/S1415-47572014000200003. ISSN   1415-4757. PMC   3983580 . PMID   24764751.
  157. Rodrigues de Moura, Ronald; Coelho, Antonio Victor Campos; de Queiroz Balbino, Valdir; Crovella, Sergio; Brandão, Lucas André Cavalcanti (September 10, 2015). "Meta-analysis of Brazilian genetic admixture and comparison with other Latin America countries". American Journal of Human Biology. 27 (5): 674–680. doi:10.1002/ajhb.22714. hdl: 11368/2837176 . ISSN   1042-0533. PMID   25820814.
  158. Chacón-Duque, Juan-Camilo; Adhikari, Kaustubh; Fuentes-Guajardo, Macarena; Mendoza-Revilla, Javier; Acuña-Alonzo, Victor; Barquera, Rodrigo; Quinto-Sánchez, Mirsha; Gómez-Valdés, Jorge; Everardo Martínez, Paola; Villamil-Ramírez, Hugo; Hünemeier, Tábita; Ramallo, Virginia; Silva de Cerqueira, Caio C.; Hurtado, Malena; Villegas, Valeria (December 19, 2018). "Latin Americans show wide-spread Converso ancestry and imprint of local Native ancestry on physical appearance". Nature Communications. 9 (1): 5388. doi:10.1038/s41467-018-07748-z. ISSN   2041-1723. PMC   6300600 . PMID   30568240.
  159. "Estimación de la mezcla genética en la población de Nicaragua [Admixture estimates in the population of Nicaragua]" . Retrieved March 19, 2024.
  160. Thais C.; et al. (January 19, 2023). "A review of ancestrality and admixture in Latin America and the caribbean focusing on native American and African descendant populations". Frontiers in Genetics. 14: Table 1 (image). doi: 10.3389/fgene.2023.1091269 . PMC   9893294 . PMID   36741309.
  161. Bonilla, Carolina; Bertoni, Bernardo; González, Susana; Cardoso, Horacio; Brum-Zorrilla, Nadir; Sans, Mónica (May 2004). "Substantial native American female contribution to the population of Tacuarembó, Uruguay, reveals past episodes of sex-biased gene flow". American Journal of Human Biology. 16 (3): 289–297. doi:10.1002/ajhb.20025. PMID   15101054. S2CID   34341356.