Related Research Articles

A stock market, equity market, or share market is the aggregation of buyers and sellers of stocks, which represent ownership claims on businesses; these may include securities listed on a public stock exchange as well as stock that is only traded privately, such as shares of private companies that are sold to investors through equity crowdfunding platforms. Investments are usually made with an investment strategy in mind.

A stock market crash is a sudden dramatic decline of stock prices across a major cross-section of a stock market, resulting in a significant loss of paper wealth. Crashes are driven by panic selling and underlying economic factors. They often follow speculation and economic bubbles.
In finance, technical analysis is an analysis methodology for analysing and forecasting the direction of prices through the study of past market data, primarily price and volume. As a type of active management, it stands in contradiction to much of modern portfolio theory. The efficacy of technical analysis is disputed by the efficient-market hypothesis, which states that stock market prices are essentially unpredictable, and research on whether technical analysis offers any benefit has produced mixed results. It is distinguished from fundamental analysis, which considers a company's financial statements, health, and the overall state of the market and economy.
An exchange-traded fund (ETF) is a type of investment fund that is also an exchange-traded product, i.e., it is traded on stock exchanges. ETFs own financial assets such as stocks, bonds, currencies, debts, futures contracts, and/or commodities such as gold bars. The list of assets that each ETF owns, as well as their weightings, is posted on the website of the issuer daily, or quarterly in the case of active non-transparent ETFs. Many ETFs provide some level of diversification compared to owning an individual stock.
The relative strength index (RSI) is a technical indicator used in the analysis of financial markets. It is intended to chart the current and historical strength or weakness of a stock or market based on the closing prices of a recent trading period. The indicator should not be confused with relative strength.
The foreign exchange market is a global decentralized or over-the-counter (OTC) market for the trading of currencies. This market determines foreign exchange rates for every currency. It includes all aspects of buying, selling and exchanging currencies at current or determined prices. In terms of trading volume, it is by far the largest market in the world, followed by the credit market.
In stock and securities market technical analysis, parabolic SAR is a method devised by J. Welles Wilder Jr., to find potential reversals in the market price direction of traded goods such as securities or currency exchanges such as forex. It is a trend-following (lagging) indicator and may be used to set a trailing stop loss or determine entry or exit points based on prices tending to stay within a parabolic curve during a strong trend.
Swing trading is a speculative trading strategy in financial markets where a tradable asset is held for one or more days in an effort to profit from price changes or 'swings'. A swing trading position is typically held longer than a day trading position, but shorter than buy and hold investment strategies that can be held for months or years. Profits can be sought by either buying an asset or short selling. Momentum signals have been shown to be used by financial analysts in their buy and sell recommendations that can be applied in swing trading.
The commodity channel index (CCI) is an oscillator originally introduced by Donald Lambert in 1980.
The Negative Volume Index and Positive Volume Index indicators are indicators to identify primary market trends and reversals.
Trend following or trend trading is a trading strategy according to which one should buy an asset when its price trend goes up, and sell when its trend goes down, expecting price movements to continue.
A basket option is a financial derivative, more specifically an exotic option, whose underlying is a weighted sum or average of different assets that have been grouped together in a basket. A basket option is similar to an index option, where a number of stocks have been grouped together in an index and the option is based on the price of the index, but differs in that the members and weightings of an index can change over time while those in a basket option do not.

Alexander Graham Bell School, also known as Bell School is a public school located in the North Center neighborhood of Chicago, Illinois, United States; it is a part of the Chicago Public Schools. It offers grades kindergarten through grade eight. It also has a deaf department for students in preschool through grade eight and additionally a Regional Gifted Center (Options) for students in grades kindergarten through eight.
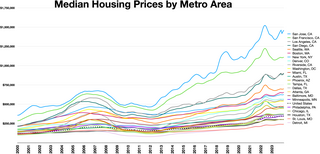
The Standard & Poor's CoreLogic Case–Shiller Home Price Indices are repeat-sales house price indices for the United States. There are multiple Case–Shiller home price indices: A national home price index, a 20-city composite index, a 10-city composite index, and twenty individual metro area indices. These indices were first produced commercially by Case Shiller Weiss. They are now calculated and kept monthly by Standard & Poor's, with data calculated for January 1987 to present. The indices kept by Standard & Poor are normalized to a value of 100 in January 2000. They are based on original work by economists Karl Case and Robert Shiller, whose team calculated the home price index back to 1990. Case and Shiller's index is normalized to a value of 100 in 1990. The Case-Shiller index on Shiller's website is updated quarterly. The two datasets can greatly differ due to different reference points and calculations. For example, in the 4th quarter of 2013, the Standard and Poor 20 city index point was in the 160's, while the index point for 4th quarter on the Shiller data was in the 130's. Shiller claims in his book Irrational Exuberance that such a long series of home prices does not appear to have been published for any country.
The average directional movement index (ADX) was developed in 1978 by J. Welles Wilder as an indicator of trend strength in a series of prices of a financial instrument. ADX has become a widely used indicator for technical analysts, and is provided as a standard in collections of indicators offered by various trading platforms.
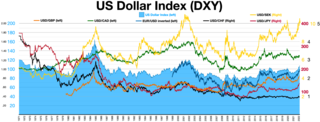
Currency strength expresses the value of currency. For economists, it is often calculated as purchasing power, while for financial traders, it can be described as an indicator, reflecting many factors related to the currency; for example, fundamental data, overall economic performance (stability) or interest rates. It can also be calculated from currency in relation to other currencies, usually using a pre-defined currency basket. A typical example of this method is the U.S. Dollar Index (USDX).
The true strength index (TSI) is a technical indicator used in the analysis of financial markets that attempts to show both trend direction and overbought/oversold conditions. It was first published William Blau in 1991. The indicator uses moving averages of the underlying momentum of a financial instrument. Momentum is considered a leading indicator of price movements, and a moving average characteristically lags behind price. The TSI combines these characteristics to create an indication of price and direction more in sync with market turns than either momentum or moving average. The TSI is provided as part of the standard collection of indicators offered by various trading platforms.
Price action is a method of analysis of the basic price movements to generate trade entry and exit signals that is considered reliable while not requiring the use of indicators. It is a form of technical analysis, as it ignores the fundamental factors of a security and looks primarily at the security's price history. However, this method is different from other forms of technical analysis, as it focuses on the relation of the security's current price to its price history, which consists of all price movements, as opposed to values derived from the price history.
Jason Goepfert is an American researcher and columnist focused on the development of behavioral finance. Prior to founding Sundial Capital Research, he was the manager of back office operations for Deephaven Capital Management, a Minnesota-based hedge fund, and Wells Fargo's online brokerage unit.

Volume Analysis is an example of a type of technical analysis that examines the volume of traded securities to confirm and predict price trends. Volume is a measure of the number of shares of an asset that are traded in a given period of time. As one of the oldest market indicators used for analysis, sudden changes in volume are often the result of news-related events. Commonly used by chartists and technical analysts, volume analysis is centered on the following ideas:
References
- ↑ Logue, Ann C. (2011). Day Trading For Dummies. Wiley. p. 196. ISBN 9781118051818.
- ↑ Elder, Alexander (1993). Trading for a Living: Psychology, Trading Tactics, Money Management . Wiley. ISBN 0-4715-9224-2.
- ↑ "Force Index [ChartSchool]". school.stockcharts.com. Retrieved 2024-03-17.