A functional flow block diagram (FFBD) is a multi-tier, time-sequenced, step-by-step flow diagram of a system's functional flow.[2] The term "functional" in this context is different from its use in functional programming or in mathematics, where pairing "functional" with "flow" would be ambiguous. Here, "functional flow" pertains to the sequencing of operations, with "flow" arrows expressing dependence on the success of prior operations. FFBDs may also express input and output data dependencies between functional blocks, as shown in figures below, but FFBDs primarily focus on sequencing.
In the early 1930s, an industrial engineer, Allan H. Mogensen began training business people in the use of some of the tools of industrial engineering at his Work Simplification Conferences in Lake Placid, New York. A 1944 graduate of Mogensen's class, Art Spinanger, took the tools back to Procter and Gamble where he developed their Deliberate Methods Change Program. Another 1944 graduate, Ben S. Graham, Director of Formcraft Engineering at Standard Register Industrial, adapted the flow process chart to information processing with his development of the multi-flow process chart to display multiple documents and their relationships. In 1947, ASME adopted a symbol set as the ASME Standard for Operation and Flow Process Charts, derived from Gilbreth's original work.[5]
The modern Functional Flow Block Diagram was developed by TRW Incorporated, a defense-related business, in the 1950s.[6] In the 1960s it was exploited by NASA to visualize the time sequence of events in space systems and flight missions.[7] FFBDs became widely used in classical systems engineering to show the order of execution of system functions.[3]
Development of functional flow block diagrams
Figure 2: Development of functional flow block diagrams
FFBDs can be developed in a series of levels. FFBDs show the same tasks identified through functional decomposition and display them in their logical, sequential relationship. For example, the entire flight mission of a spacecraft can be defined in a top level FFBD, as shown in Figure 2. Each block in the first level diagram can then be expanded to a series of functions, as shown in the second level diagram for "perform mission operations." Note that the diagram shows both input (transfer to operational orbit) and output (transfer to space transportation system orbit), thus initiating the interface identification and control process. Each block in the second level diagram can be progressively developed into a series of functions, as shown in the third level diagram on Figure 2.[8]
These diagrams are used both to develop requirements and to identify profitable trade studies. For example, does the spacecraft antenna acquire the tracking and data relay satellite (TDRS) only when the payload data are to be transmitted, or does it track TDRS continually to allow for the reception of emergency commands or transmission of emergency data? The FFBD also incorporates alternate and contingency operations, which improve the probability of mission success. The flow diagram provides an understanding of total operation of the system, serves as a basis for development of operational and contingency procedures, and pinpoints areas where changes in operational procedures could simplify the overall system operation. In certain cases, alternate FFBDs may be used to represent various means of satisfying a particular function until data are acquired, which permits selection among the alternatives.[8]
Graphical explanation of a "function block" used in these diagrams. Flow is from left to right.
Function block: Each function on an FFBD should be separate and be represented by single box (solid line). Each function needs to stand for definite, finite, discrete action to be accomplished by system elements.
Function numbering: Each level should have a consistent number scheme and provide information concerning function origin. These numbers establish identification and relationships that will carry through all Functional Analysis and Allocation activities and facilitate traceability from lower to top levels.
Functional reference: Each diagram should contain a reference to other functional diagrams by using a functional title reference (box in brackets).
Flow connection: Lines connecting functions should only indicate function flow and not a lapse in time or intermediate activity.
Flow direction: Diagrams should be laid out so that the flow direction is generally from left to right. Arrows are often used to indicate functional flows.
Summing gate: A circle is used to denote a summing gate and is used when AND/OR is present. AND is used to indicate parallel functions and all conditions must be satisfied to proceed. OR is used to indicate that alternative paths can be satisfied to proceed.
GO and NO-GO path: “G” and “bar G” are used to denote “go” and “no-go” conditions. These symbols are placed adjacent to lines leaving a particular function to indicate alternative paths.
Function symbolism
A function shall be represented by a rectangle containing the title of the function (an action verb followed by a noun phrase) and its unique decimal delimited number. A horizontal line shall separate this number and the title, as shown in see Figure 3 above. The figure also depicts how to represent a reference function, which provides context within a specific FFBD. See Figure 9 for an example regarding use of a reference function.[9]
Figure 3. Function symbol
Figure 4. Directed lines
Directed lines
A line with a single arrowhead shall depict functional flow from left to right, see Figure 4.[9]
Logic symbols
The following basic logic symbols shall be used.[9]
AND: A condition in which all preceding or succeeding paths are required. The symbol may contain a single input with multiple outputs or multiple inputs with a single output, but not multiple inputs and outputs combined (Figure 5). Read the figure as follows: F2 AND F3 may begin in parallel after completion of F1. Likewise, F4 may begin after completion of F2 AND F3.
Figure 5. "AND" symbol
Figure 6. "Exclusive OR" Symbol
Exclusive OR: A condition in which one of multiple preceding or succeeding paths is required, but not all. The symbol may contain a single input with multiple outputs or multiple inputs with single output, but not multiple inputs and outputs combined (Figure 6). Read the figure as follows: F2 OR F3 may begin after completion of F1. Likewise, F4 may begin after completion of either F2 OR F3.
Inclusive OR: A condition in which one, some, or all of the multiple preceding or succeeding paths are required. Figure 7 depicts Inclusive OR logic using a combination of the AND symbol (Figure 5) and the Exclusive OR symbol (Figure 6). Read Figure 7 as follows: F2 OR F3 (exclusively) may begin after completion of F1, OR (again exclusive) F2 AND F3 may begin after completion of F1. Likewise, F4 may begin after completion of either F2 OR F3 (exclusively), OR (again exclusive) F4 may begin after completion of both F2 AND F3
Figure 7. "Inclusive OR" logic
Contextual and administrative data
Each FFBD shall contain the following contextual and administrative data:[9]
Date the diagram was created
Name of the engineer, organization, or working group that created the diagram
Unique decimal delimited number of the function being diagrammed
Unique function name of the function being diagrammed.
Figure 8 and Figure 9 present the data in an FFBD. Figure 9 is a decomposition of the function F2 contained in Figure 8 and illustrates the context between functions at different levels of the model.
A logic gate is a device that performs a Boolean function, a logical operation performed on one or more binary inputs that produces a single binary output. Depending on the context, the term may refer to an ideal logic gate, one that has, for instance, zero rise time and unlimited fan-out, or it may refer to a non-ideal physical device.
A programmable logic controller (PLC) or programmable controller is an industrial computer that has been ruggedized and adapted for the control of manufacturing processes, such as assembly lines, machines, robotic devices, or any activity that requires high reliability, ease of programming, and process fault diagnosis.
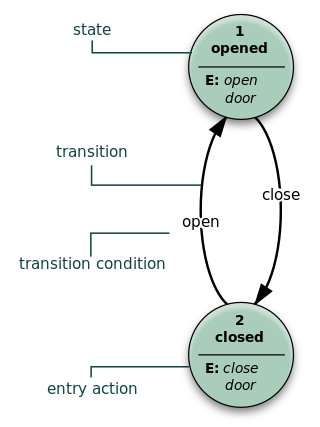
A state diagram is a type of diagram used in computer science and related fields to describe the behavior of systems. State diagrams require that the system described is composed of a finite number of states; sometimes, this is indeed the case, while at other times this is a reasonable abstraction. Many forms of state diagrams exist, which differ slightly and have different semantics.
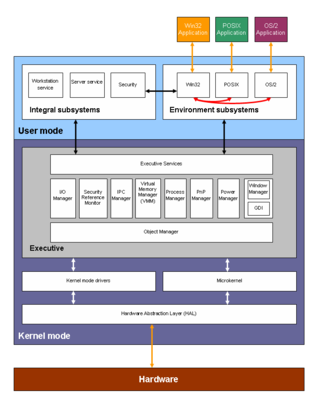
A system context diagram in engineering is a diagram that defines the boundary between the system, or part of a system, and its environment, showing the entities that interact with it. This diagram is a high level view of a system. It is similar to a block diagram.
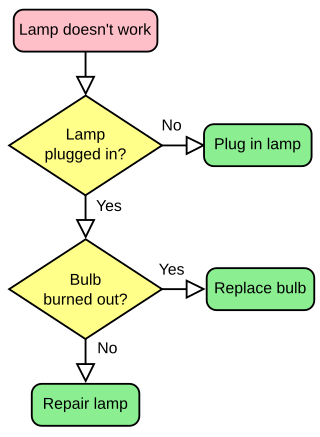
A flowchart is a type of diagram that represents a workflow or process. A flowchart can also be defined as a diagrammatic representation of an algorithm, a step-by-step approach to solving a task.
In computer programming, dataflow programming is a programming paradigm that models a program as a directed graph of the data flowing between operations, thus implementing dataflow principles and architecture. Dataflow programming languages share some features of functional languages, and were generally developed in order to bring some functional concepts to a language more suitable for numeric processing. Some authors use the term datastream instead of dataflow to avoid confusion with dataflow computing or dataflow architecture, based on an indeterministic machine paradigm. Dataflow programming was pioneered by Jack Dennis and his graduate students at MIT in the 1960s.
A block diagram is a diagram of a system in which the principal parts or functions are represented by blocks connected by lines that show the relationships of the blocks. They are heavily used in engineering in hardware design, electronic design, software design, and process flow diagrams.
A data-flow diagram is a way of representing a flow of data through a process or a system. The DFD also provides information about the outputs and inputs of each entity and the process itself. A data-flow diagram has no control flow—there are no decision rules and no loops. Specific operations based on the data can be represented by a flowchart.
An event-driven process chain (EPC) is a type of flow chart for business process modeling. EPC can be used to configure enterprise resource planning execution, and for business process improvement. It can be used to control an autonomous workflow instance in work sharing.
A functional block diagram, in systems engineering and software engineering, is a block diagram that describes the functions and interrelationships of a system.
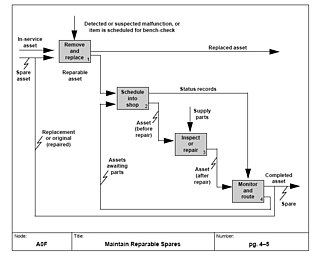
IDEF0, a compound acronym, is a function modeling methodology for describing manufacturing functions, which offers a functional modeling language for the analysis, development, reengineering and integration of information systems, business processes or software engineering analysis.
Business process mapping refers to activities involved in defining what a business entity does, who is responsible, to what standard a business process should be completed, and how the success of a business process can be determined.
In computer programming, flow-based programming (FBP) is a programming paradigm that defines applications as networks of black box processes, which exchange data across predefined connections by message passing, where the connections are specified externally to the processes. These black box processes can be reconnected endlessly to form different applications without having to be changed internally. FBP is thus naturally component-oriented.
Logic optimization is a process of finding an equivalent representation of the specified logic circuit under one or more specified constraints. This process is a part of a logic synthesis applied in digital electronics and integrated circuit design.
In software engineering, structured analysis (SA) and structured design (SD) are methods for analyzing business requirements and developing specifications for converting practices into computer programs, hardware configurations, and related manual procedures.
A signal-flow graph or signal-flowgraph (SFG), invented by Claude Shannon, but often called a Mason graph after Samuel Jefferson Mason who coined the term, is a specialized flow graph, a directed graph in which nodes represent system variables, and branches represent functional connections between pairs of nodes. Thus, signal-flow graph theory builds on that of directed graphs, which includes as well that of oriented graphs. This mathematical theory of digraphs exists, of course, quite apart from its applications.
In systems engineering, software engineering, and computer science, a function model or functional model is a structured representation of the functions within the modeled system or subject area.
The N2 chart or N2 diagram is a chart or diagram in the shape of a matrix, representing functional or physical interfaces between system elements. It is used to systematically identify, define, tabulate, design, and analyze functional and physical interfaces. It applies to system interfaces and hardware and/or software interfaces.
A control-flow diagram (CFD) is a diagram to describe the control flow of a business process, process or review.
The flow process chart is a graphical and symbolic representation of the activities performed on the work piece during the operation in industrial engineering.
This page is based on this Wikipedia article Text is available under the CC BY-SA 4.0 license; additional terms may apply. Images, videos and audio are available under their respective licenses.